. 2024 Jan:144:102462.
doi: 10.1016/j.tube.2023.102462. Epub 2023 Dec 2.

Combined cerebrospinal fluid metabolomic and cytokine profiling in tuberculosis meningitis reveals robust and prolonged changes in immunometabolic networks

Affiliations

Combined cerebrospinal fluid metabolomic and cytokine profiling in tuberculosis meningitis reveals robust and prolonged changes in immunometabolic networks

Jeffrey Tomalka et al. Tuberculosis (Edinb). 2024 Jan.

Abstract

Much of the high mortality in tuberculosis meningitis (TBM) is attributable to excessive inflammation, making it imperative to identify targets for host-directed therapies that reduce pathologic inflammation and mortality. In this study, we investigate how cytokines and metabolites in the cerebral spinal fluid (CSF) associate with TBM at diagnosis and during TBM treatment. At diagnosis, TBM patients (n = 17) demonstrate significant increases of cytokines and chemokines that promote inflammation and cell migration including IL-17A, IL-2, TNFα, IFNγ, and IL-1β versus asymptomatic controls without known central nervous system pathology (n = 20). Inflammatory immune signaling had a strong positive correlation with immunomodulatory metabolites including kynurenine, lactic acid, and carnitine and strong negative correlations with tryptophan and itaconate. Inflammatory immunometabolic networks were only partially reversed with two months of effective TBM treatment and remained significantly different compared to CSF from controls. Together, these data highlight a critical role for host metabolism in regulating the inflammatory response to TBM and indicate the timeline for restoration of immune homeostasis in the CSF is prolonged.

Keywords: CSF; Cytokines; Meningitis; Metabolomics; Tuberculosis.


Conflict of interest statement

Declaration of competing interest The authors declare that the research was conducted in the absence of any commercial or financial relationships that could be construed as a potential conflict of interest.

Figures
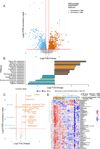
Figure 1 –
Figure 1 –
(A) Volcano plot showing m/z features that were differentially abundant in the cerebrospinal fluid of TBM cases versus controls. Those significantly increased in the CSF of TBM cases (log2 fold change ≥ 0.5 and q-value < 0.1) are in red while those increased in the CSF of control participants are in blue. (B) Metabolic pathway analysis showing metabolic pathways significantly enriched (p<0.05) in TBM CSF (red) and those significantly enriched in control CSF (blue). (C) Volcano plot of targeted metabolites significantly increased in the CSF of TBM cases (red; log2 fold change ≥ 0.5 and q-value < 0.1) and those increased in the CSF of control participants (blue). *Itaconate is isobaric with citraconate and mesoconate. (D) 2-way hierarchical clustering analysis of targeted metabolites that significantly differed in TBM CSF versus control CSF. Each column is annotated by whether the participant was diagnosed with TBM (dark orange) versus controls (light blue), whether TBM was definite/probable (light orange) or possible (yellow), and whether a TBM case had Grade 1 (grey) versus Grade 2 (green) severity.
Figure 2 –
Figure 2 –
(A) Principal component analysis of all 32 cytokines measured in the CSF showing clear separation between control CSF (light blue) and those with confirmed/probable TBM (red) while those with possible TBM (purple) had some overlap with both groups. Principal component 1 (x-axis) captured 59% of the variation in the data while principal component 2 (y-axis) captured 8%. (B) 2-way hierarchical clustering analysis of all measured cytokines annotated by whether the participant was diagnosed with TBM (red) versus controls (light blue), whether TBM was confirmed/probable (light orange) or possible (yellow), and whether a TBM case had Grade 1 (grey) versus Grade 2 (green) severity. (C-F) CSF concentrations of individual cytokines in persons diagnosed with TBM versus asymptomatic controls. (*P ≤ 0.05, **P < 0.01, ***P < 0.001).
Figure 3 –
Figure 3 –
(A) Pearson correlation heatmap of cytokines (x-axis) and differentially abundant metabolites (y-axis) in controls (n=20) and TBM cases at baseline (n=14) with 2-way hierarchical clustering. (B) Comparison of the centroid score of cluster 1 cytokines and (C) cluster 3 metabolites in TBM cases at baseline versus controls. (D) Unbiased network analysis showing all significant relationships between clinical characteristics of persons diagnosed with TBM and cytokine and metabolite concentrations in CSF at the time of diagnosis. Positive associations are denoted with red edges while negative associations are denoted with blue edges. The intensity and width of the line corresponds to the strength of the association. (*P ≤ 0.05, **P < 0.01, ***P < 0.001)
Figure 4 –
Figure 4 –
(A) Boxplots showing changes in cluster 1 cytokines after 7, 14, 28, and 56 days of treatment in persons with TBM who clinically responded to therapy. (B) After 7 and 14 days, treatment non-responders had elevated concentrations of cluster 1 cytokines versus responders. (C) Cluster 3 metabolites also significantly declined in the CSF in treatment responders. (D) Unbiased network analysis showing all significant relationships between clinical characteristics of persons diagnosed with TBM and cytokine and metabolite concentrations in CSF during treatment. Positive associations are denoted with red edges while negative associations are denoted with blue edges. The intensity and width of the line corresponds to the strength of the association. (*P ≤ 0.05, **P < 0.01, ***P < 0.001)

Update of

References

    1. Kalita J, Misra UK, Ranjan P. Predictors of long-term neurological sequelae of tuberculous meningitis: a multivariate analysis. Eur J Neurol. 2007;14(1):33–7. - PubMed
    1. Kempker RR, Smith AGC, Avaliani T, Gujabidze M, Bakuradze T, Sabanadze S, et al. Cycloserine and Linezolid for Tuberculosis Meningitis: Pharmacokinetic Evidence of Potential Usefulness. Clin Infect Dis. 2022;75(4):682–689. - PMC - PubMed
    1. Wilkinson RJ, Rohlwink U, Misra UK, van Crevel R, Mai NTH, Dooley KE, et al. Tuberculous meningitis. Nat Rev Neurol. 2017;13(10):581–98. - PubMed
    1. Burn CG, Finley KH. The role of hypersensitivity in the production of experimental meningitis: I. Experimental meningitis in tuberculosis animals. J Exp Med. 1932;56(2):203–21. - PMC - PubMed
    1. Quinn CM, Poplin V, Kasibante J, Yuquimpo K, Gakuru J, Cresswell FV, et al. Tuberculosis IRIS: Pathogenesis, Presentation, and Management across the Spectrum of Disease. Life (Basel). 2020;10(11). - PMC - PubMed

LinkOut - more resources