. 2023 Dec 21;186(26):5910-5924.e17.
doi: 10.1016/j.cell.2023.11.013. Epub 2023 Dec 8.

A tridimensional atlas of the developing human head

Affiliations

A tridimensional atlas of the developing human head

Raphael Blain et al. Cell. .

Abstract

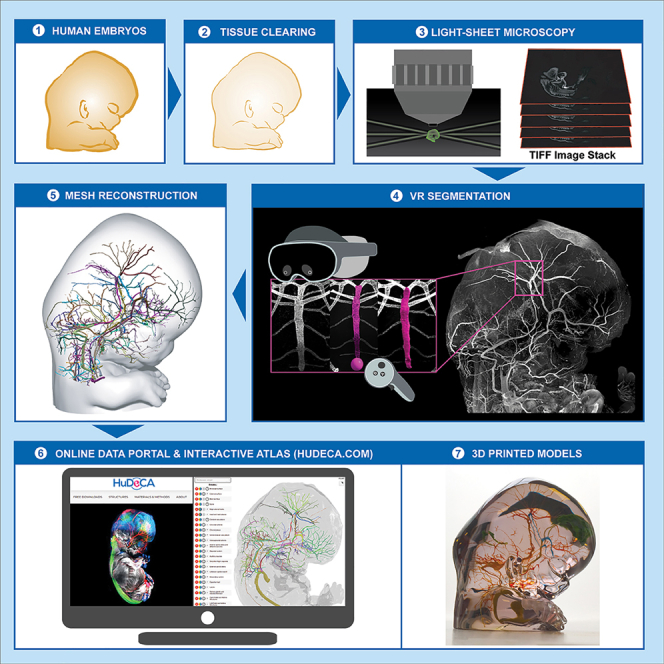
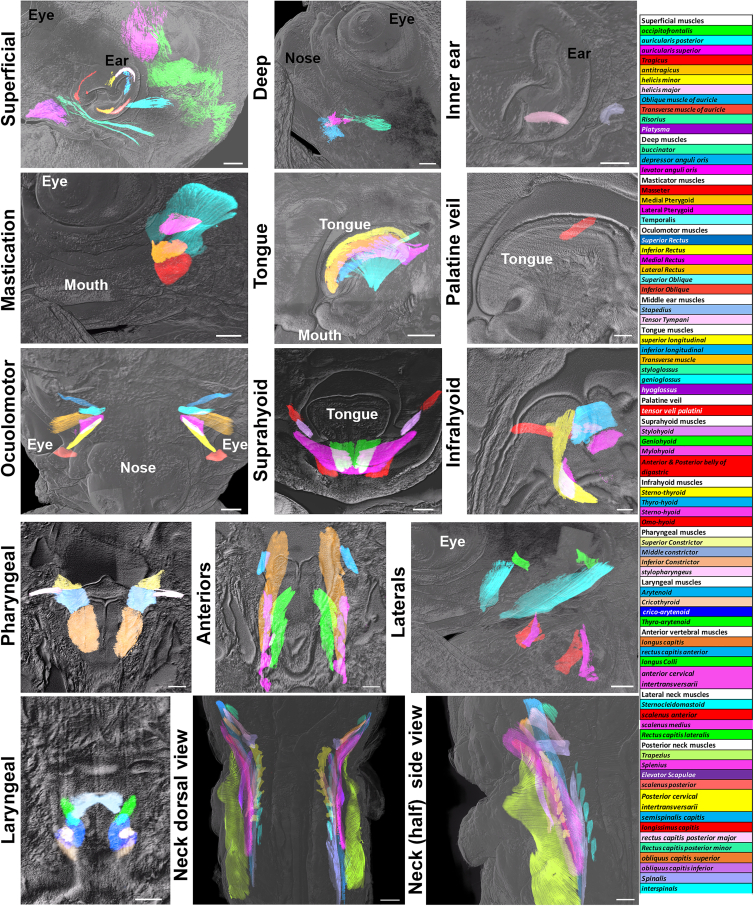
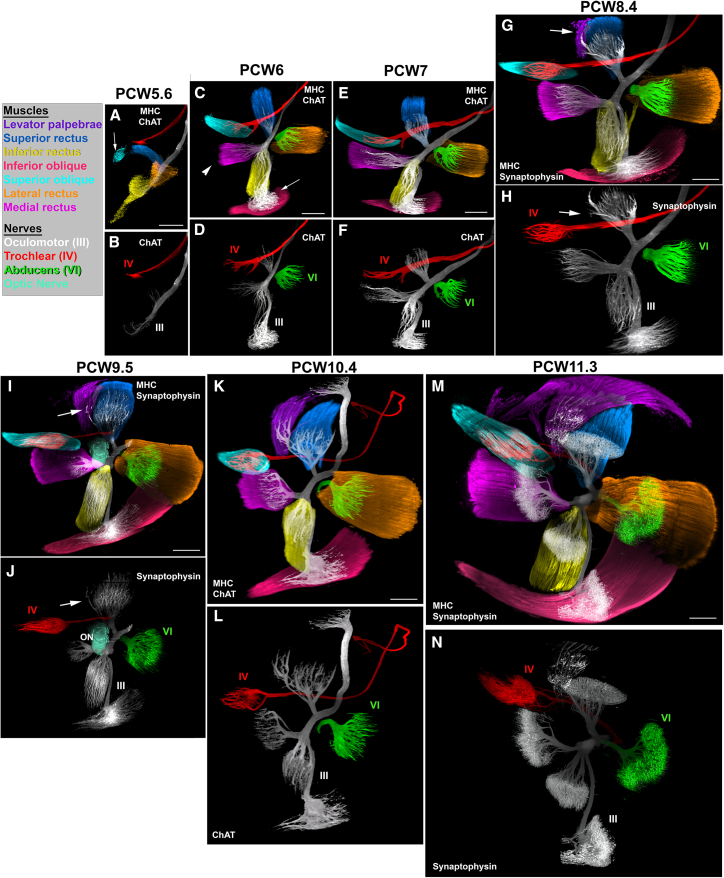
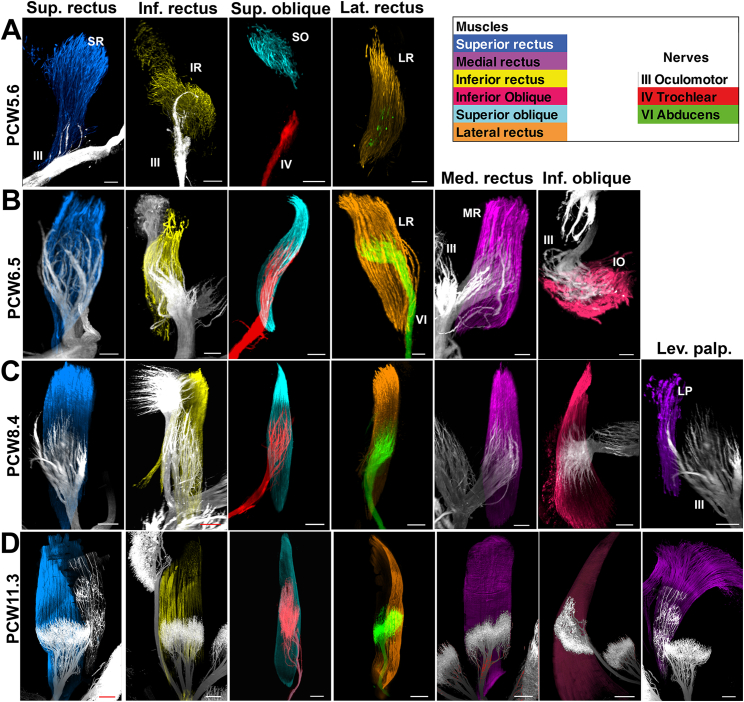
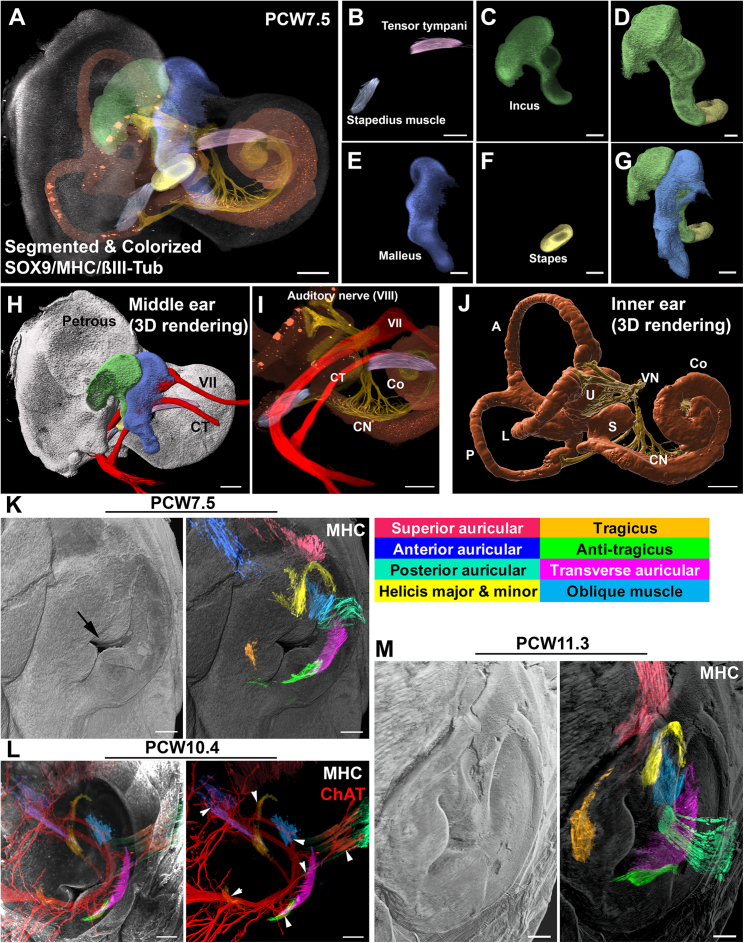
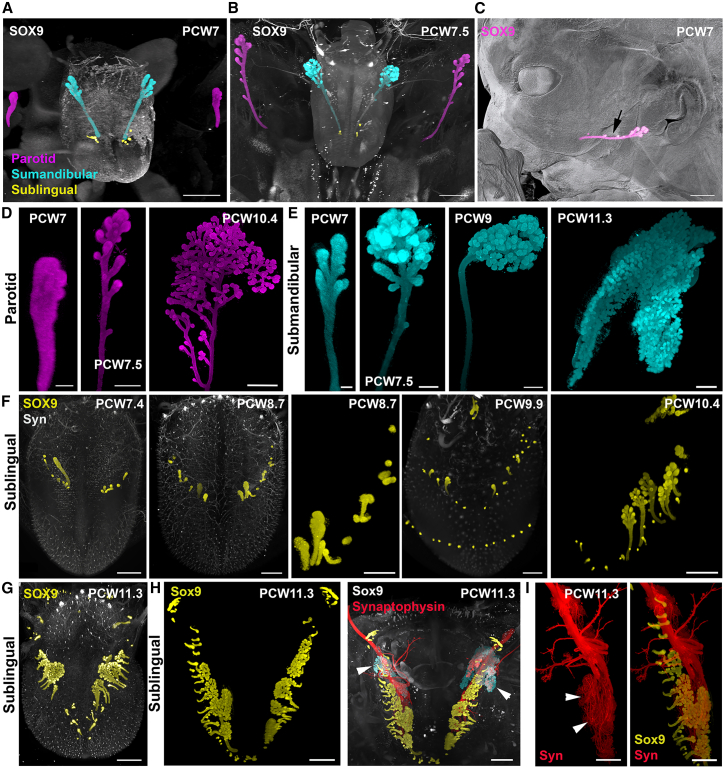
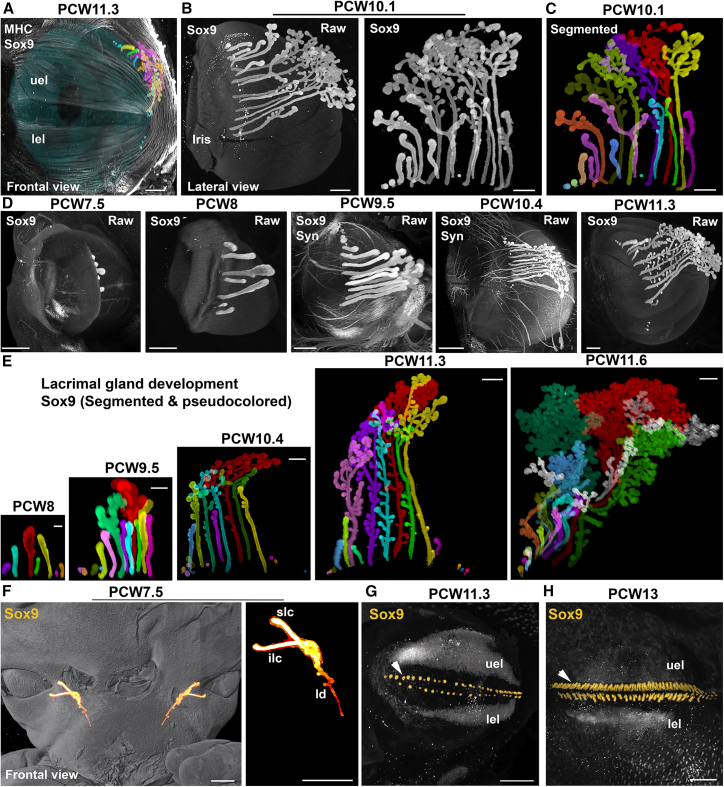
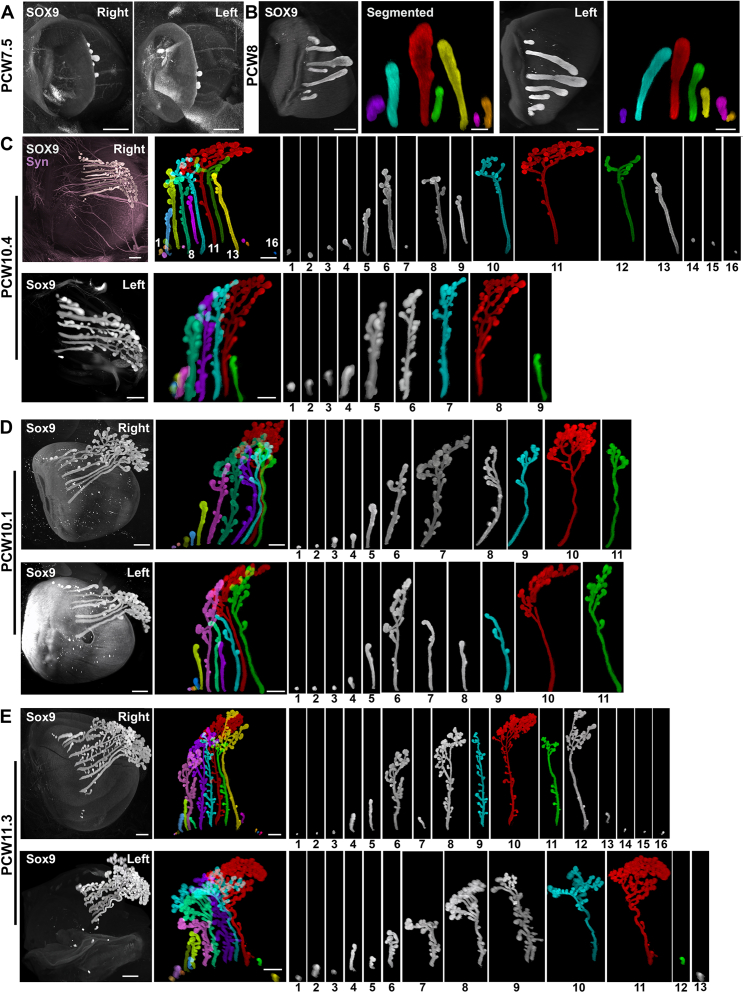
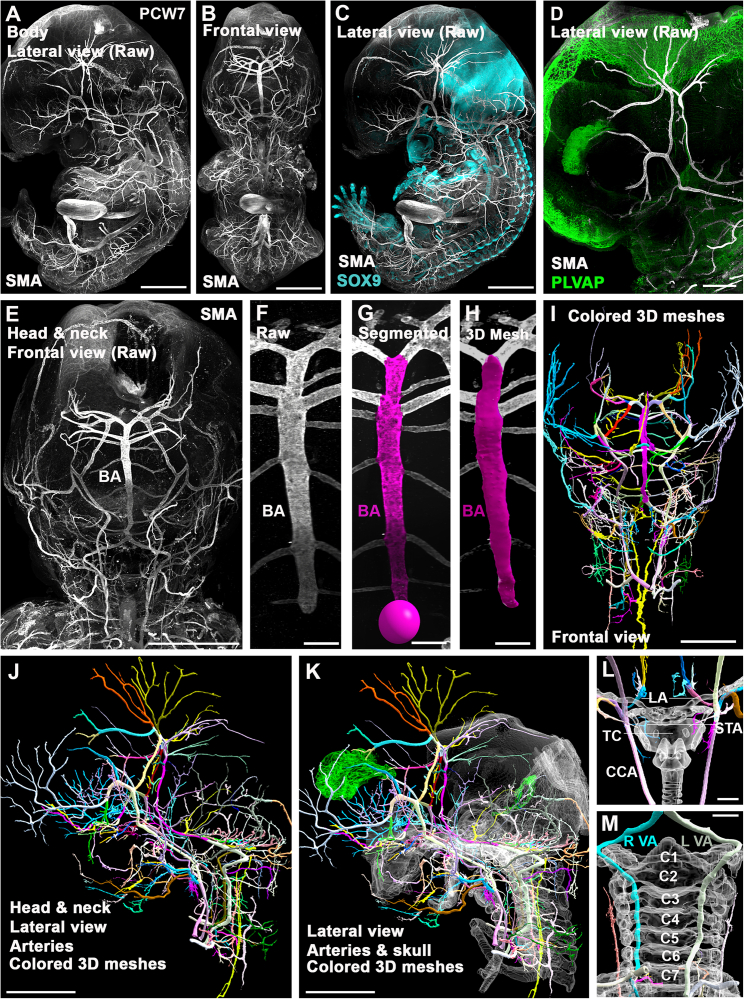
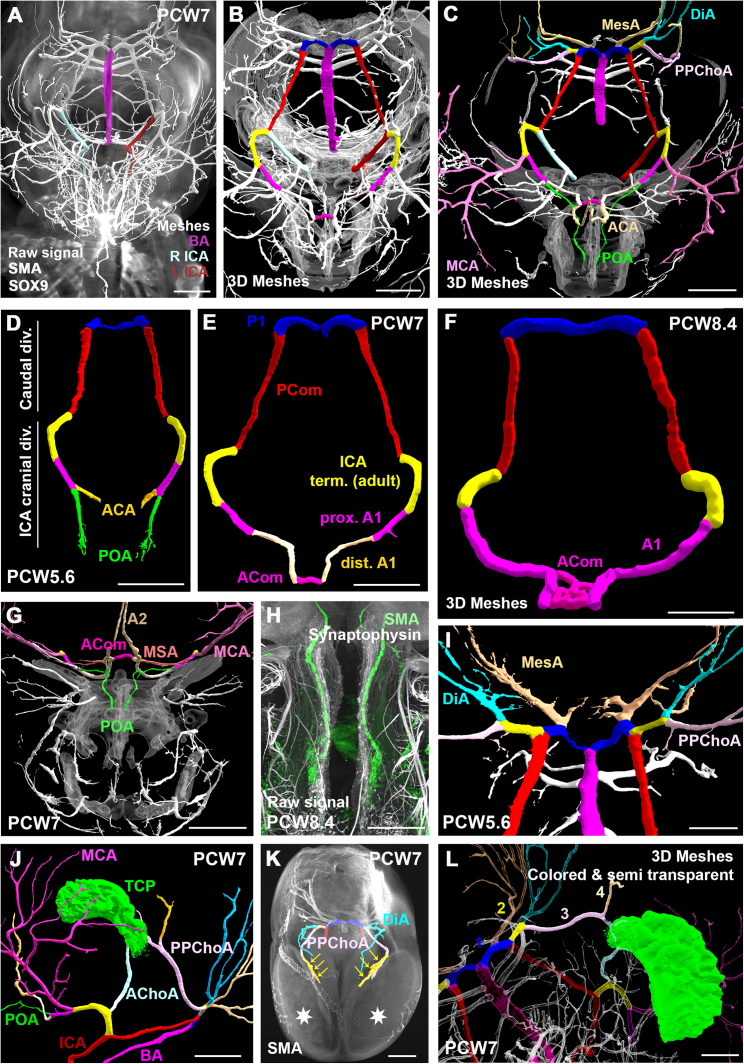
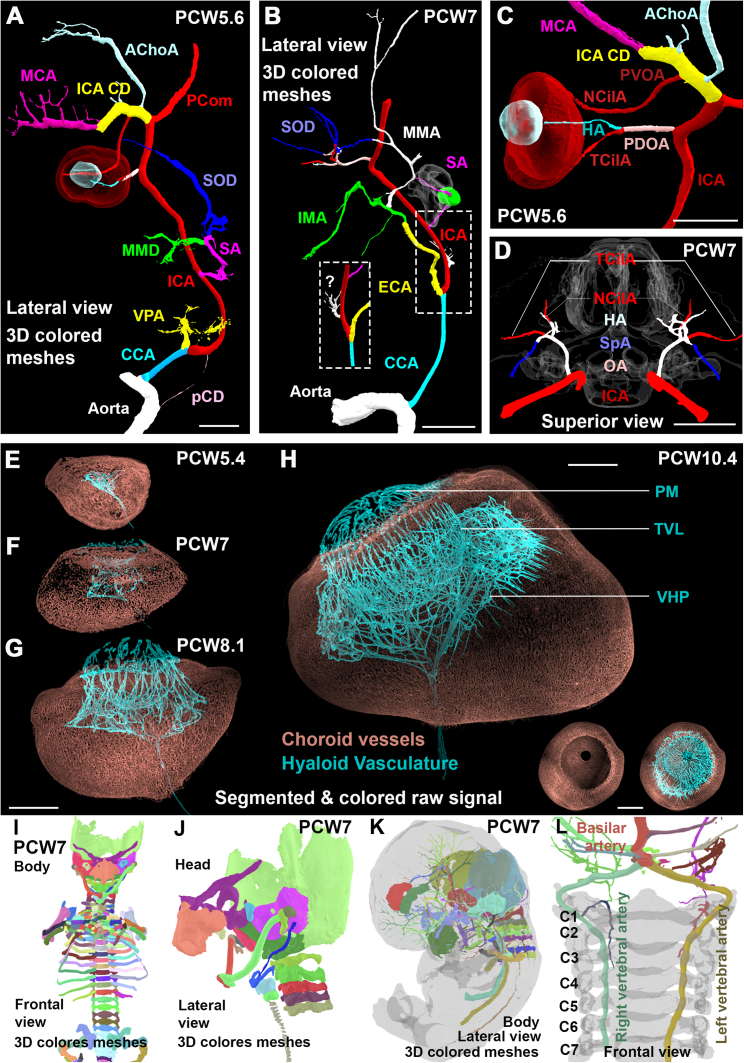
The evolution and development of the head have long captivated researchers due to the crucial role of the head as the gateway for sensory stimuli and the intricate structural complexity of the head. Although significant progress has been made in understanding head development in various vertebrate species, our knowledge of early human head ontogeny remains limited. Here, we used advanced whole-mount immunostaining and 3D imaging techniques to generate a comprehensive 3D cellular atlas of human head embryogenesis. We present detailed developmental series of diverse head tissues and cell types, including muscles, vasculature, cartilage, peripheral nerves, and exocrine glands. These datasets, accessible through a dedicated web interface, provide insights into human embryogenesis. We offer perspectives on the branching morphogenesis of human exocrine glands and unknown features of the development of neurovascular and skeletomuscular structures. These insights into human embryology have important implications for understanding craniofacial defects and neurological disorders and advancing diagnostic and therapeutic strategies.

Keywords: Tissue clearing; human embryo; iDISCO; light-sheet microscopy; oculomotor system; skull; vascular; virtual reality.


Conflict of interest statement

Declaration of interests The authors declare no competing interests.

Figures

None
Graphical abstract
Figure 1
Figure 1
3D Analysis of the human chondrocranium development All panels are LSFM images of solvent-cleared embryos and fetus, immunostained with anti-Collagen 2 (A–L) or anti-Sox9 (M) antibodies. (A–C) Lateral 3D views of a PCW7 embryo illustrating the image processing pipeline. Raw image data (A) are segmented using syGlass (B) to isolate all cartilage templates and a mesh image is built (C) for 3D rendering. (D and E) (D) All individual skeletal elements have been colored (lateral view). (E) is a frontal view of the same embryo. (F–M) (F) High-magnification 3D rendering of the cranium with all developing cartilage elements pseudocolored. Names appear on the chart on the right of the image. (G)–(L) are views of each element taken in situ (top panels) or isolated (bottom panels). The nasal capsule (G) assembles the mesethmoid (Mes) and ectethmoid (Ect). The hyoid and the larynx (elements numbered 1–4) are seen in (H). In (I), The Meckel’s cartilages join at the symphysis (arrowhead). (J) Frontal (upper panel) and superior (lower panel) views of the sphenoid. (K) shows the inner ear bones (dark purple, malleus; pink, incus; red, stapes) and their insertion in the petrous (yellow). In (L), the basilar process (arrowhead) and foramen magnum (asterisk) of the chondrogenic ventro-posterior component of the presumptive occipital bone complex are seen. (M) displays the developmental time course of the cranium in human from 5.6 to 11 PCW. All panels are 3D rendering images generated with syGlass from LSFM images of embryos (PCW5.6, PCW7, and PCW8) and fetus (PCW11.3) immunostained with anti-Sox9. Images are presented at the same scale to illustrate the growth of the cranium. See also Figure S1. Scale bars: 2 mm in (A)–(D) and (L, top panel), 4 mm in (E), 1 mm in (F)–(K), 3 mm in (L, bottom panel), and 1.5 mm in (M).
Figure S1
Figure S1
Sphenoid development in human embryos and fetus, related to Figure 1 (A–I) 3D reconstructions of chondrogenic markers immunolabeling at PCW5.6 (Sox9; A–D), PCW7.0 (Collagen 2; E–G) and PCW11.3 (Sox9; H and I), showing progressive assembly of nasal capsule (blue, 10–15), sphenoidal (green, 20–28), occipital (orange, 30–33), and petrosal (yellow, 40–45) chondrogenic templates of the skull base. (A–C) The nasal capsule develops remotely, anteriorly from the other three structures, which are already in close proximity at PCW5.6, as seen from superior (A), frontal (B), and lateral (C) views. The isolated sphenoid is a single mass, the basisphenoid (20) flanked by two independent ventro-lateral masses, the ala temporalis (22). (D) A weak Sox9 labeling delineates the trigeminal nerve, or fifth cranial nerve (CNV) , confirmed on section. This shows the passage of the maxillary (CNV2, 52) trigeminal branch through central holes of the ala temporalis (22), prefiguring the foramen rotundum (54). In contrast, other branches (CNV1, 51, and CNV3, 53, traced from the Gasserian ganglion, 50) run outside of this structure. (E–G) At PCW7.0 (E, supero-dorsal view; G, lateral view; F, superior close up of the nasal capsule showing the superior surface of the initial basiphenoid (20 in A), which will develop as the main sphenoid body in the adult, splits posteriorly into the sella turcica (21) and anteriorly into the presumptive planum sphenoidale (28). Laterally, the orbitosphenoids (23) that have formed and expanded are connected to the basisphenoid (20 in A), prefiguring the sphenoid lesser wings (23). Likewise, connected to the basisphenoid (20), the alar processes (24) connect to the ala temporalis (22) as the presumptive greater wings. Frontal spheno-ethmoidal cartilage interfaces (15) prefigure the dorsal domain of the orbit. The dorsum sellae (25) rises dorsally, flanked laterally by the posterior clinoid processes (26). A depression of the cartilage plate can be observed as the future hypophyseal fossa or sella turcica (21). The parietal lamina (or plate, delimited by the dotted line) was identified (G and I). (H and I) Interestingly, the pterygoid plates were not visible (while the pterygoid muscles were present). At PCW11.3 (H, superior view; I, lateral view), two large lateral holes prefigure the superior orbital fissures (55), along with other foramens (45, internal auditory canal; 58, hypoglossal canal; 59, foramen magnum). The bottom table lists all individual anatomical structures annotated on the figure. Scale bars: 500 μm in (A)–(D), (F), and (G); 1 mm in (E); and 1.5 mm in (H) and (I).
Figure 2
Figure 2
3D analysis of the development of head and neck muscles in human embryos All panels are LSFM images of a solvent-cleared embryos immunostained with anti-MHC (A–E, G, H, and J–M), anti-synaptophysin (F, G, I, J, L, and M), and anti-Sox9 (M). (A) Raw image of a lateral view of the embryo. (B–D) Lateral (B and C) and dorsal (D) views of the muscles of a PCW6.5 embryo segmented using syGlass. 14 muscle modules are differentially pseudocolored. (B) shows an overlay with the surface shading image (gray). (E–G) Lateral view of the tongue (To) and larynx (Lar) of a PCW7.5 embryo with all muscles (E) and nerves (F) segmented. (G) Merged image of the muscles and nerves. (H–K) Frontal view of the tongue of a PCW5.6 embryo with all muscles (H) and nerves (I) segmented. (J) Merged image of the muscles and nerves. (K) shows all individual tongue muscles. (L and M) Frontal view of the face of a PCW8 embryo with a 3D overlay of muscles (red) and nerves (white) illustrating the complexity of the staining and raw image before segmentation. (M) is an image of the same embryo after segmentation of all extraoculomotor muscles (EOMs; see Figure S4 for the color code), oculomotor nerves, Sox9+ nasal capsule (Nas, gray) and olfactory nerves (ONs, brown). Abbreviations are as follows: V, trigeminal nerve; VII, facial nerve; IX, glossopharyngeal nerve; X, vagus nerve; XII, hypoglossus nerve; Myloh.2, Mylohyoid 2; Geniogl., genioglossus; Sup. Lon, superior longitudinal; Genioh., geniohyoid; and Transv., transverse. See also Figures S2 and S3. Scale bars: 1 mm in (A), (B), (D), (E), and (L); 800 μm in (C) and (M); and 400 μm in (H) and (I); and 300 um in (K).
Figure S2
Figure S2
Organization of head and neck muscles in a PCW6.6 embryo, related to Figure 2 All panels are LSFM images of a solvent-cleared PCW6.6 embryo immunostained with anti-MHC. All head and neck muscles, grouped in 14 anatomical and functional modules are individually segmented. The names of all the modules and muscles (with a color code similar to the corresponding images) are presented on the right side. Two views are shown (bottom panels for the neck muscles). Scale bars: (panels: superficial, inner ear, mastication, tongue, and laterals) 500 μm, (deep, suprahyoid) 400 μm, (palatine veli) 200 μm, (infrahyoid, pharyngeal, anteriors, and laryngeal) 300 μm, (neck dorsal view) 800 μm, and (neck [half] side view) 700 μm.
Figure S3
Figure S3
Description of the muscles of the tongue, suprahyoid, larynx and pharynx in a PCW8 embryo, related to Figure 2 (but the embryo is different) 3D LSFM image of all tongue, suprahyoid, laryngeal, and pharyngeal muscles segmented and pseudocolored in a PCW8 embryo immunostained with anti-MHC, cleared with iDISCO and imaged using LSFM. All muscle names are indicated above each panel. Scale bars, 500 μm.
Figure 3
Figure 3
Development of the human oculomotor system All panels are LSFM images of solvent-cleared embryos (A–H) and fetuses (I–N) immunostained with anti-MHC combined with ChAT (A–F, K, and L) or synaptophysin (G–J, M, and N). For each specimen, the upper panel corresponds to the merge image of the motor nerves and oculomotor muscle and the lower panel to the nerves. The inset on the left upper side of the figure provides the color code for muscles and nerves. (A and B) At PCW5.6, only 4 muscles are visible. All muscles are innervated except the superior oblique (arrow). (C and D) At PCW6, the 6 extraocular muscles, including the medial rectus (arrowhead) and inferior oblique (arrow) are now present and innervated. (E and F) This is similar at PCW7. (G and H) At PCW8.4, the levator palpebrae starts to split from the superior rectus (arrow in G) and receives a small branch coming from the oculomotor nerve (arrow in H). Note the expansion of the inferior oblique. (I–K) Between PCW9.5 (I and J) and PCW10.4 (K and L), the size of the levator increases and it detaches completely from the superior oblique. (M and N) At PCW11.3, the terminal branches of the nerves occupy the central part of all muscles and display a large bouquet of synaptophysin+ endplates. Abbreviations are as follows: III, oculomotor nerve; IV: trochlear nerve; and VI, abducens nerve. See also Figure S4. Scale bars: 500 μm in (A)–(M).
Figure S4
Figure S4
Time course of oculomotor nerve development in human embryos, related to Figure 3 All panels are LSFM images of solvent-cleared embryos (A–C) and fetus (D) immunostained with anti-MHC combined with ChAT (A–C) or Synaptophysin (D). (A)–(D) are individual images illustrating the developmental time course of all extraocular muscles and their innervation between PCW5.6 and PCW11.3. The inset on the right gives the color code used for nerve and muscles. Scale bars: all panels are counted from left to right for each row; 100 μm in (A, first and third panels from the left) and (B, fourth and fifth panels); 300 μm in (A, second panel), (C, first, second, sixth, and seventh panels), and (D, first, second, and seventh panels); 200 μm in (A, fourth panel) (B, first and second panels), and (C, third, fourth, and fifth panels); 150 μm in (B, third and sixth panels); and 500 μm in (D, third, fourth, and sixth panels).
Figure S5
Figure S5
3D organization and ontogenesis of the ear, related to Figure 2 (A–J) 3D LSFM image of the inner and middle ear in a PCW7.5 human embryo stained with MHC, Sox9 and Synaptophysin, cleared and segmented with syGlass. (A) is a merge of all channels, with segmented elements pseudocolored. (B)–(G) shows the two muscles and the three bones of the middle ear, after segmentation (B, C, E, and F) and 3D surface rendering (D and G). (H) is a 3D rendering view showing all elements together: the petrous bone template (gray), the stapedius (light blue) connected to the stapes, the tensor tympani connected to the malleus, the facial nerve (VII), and its chorda tympani (CT) branch. (I) LSFM image showing the relative positions of the two muscles, together with the cochlea (Co), facial nerve (VII), chorda tympani (CT), cochlear nerve (CN), and vestibulocochlear/auditory nerve (VIII). (J) 3D rendering of the cochlea (Co), saccule (S), utricule (U), anterior (A), posterior (P), and lateral (L) semicircular canals together with the vestibular (VN) and cochlear (CN) nerves. The cochlea and canals were segmented based on the background of the Sox9 staining. (K–M) 3D ontogenesis of external ear muscles in human embryo (K) and fetuses (L and M), immunostained with anti-MHC antibodies (K–M) and ChAT (L). The overlays are surface shading images of the auricle/pinna (gray). Muscles have been segmented using VR and pseudocolored. The color code for muscle identification is on the upper right inset. (K) shows that all individual muscles have started to emerge at PCW7.5. The arrow indicates the developing external auditory meatus. (L) All muscles are innervated by ChAT+ motor nerves (arrowheads show innervating branches). (M) shows the muscles in a PCW11.9 fetus. The size of the muscles has increased, and they now form a ring around the ear. Scale bars: 500 μm in (A), (B), and (H)–(J); 300 μm in (C) and (E)–(G); 200 μm in (D); and 500 μm in (K)–(M).
Figure 4
Figure 4
Development of human salivary glands All panels are LSFM images of solvent-cleared embryos (A–F) and fetuses (D, E, and G–I) immunostained with anti-Sox9 (A–I) combined with synaptophysin (F, H, and I). Glands immunolabeled with Sox9 were segmented using VR and pseudocolored. (A–C) Dorsal view of the mouth and tongue of PCW7 (A) and PCW7.5 (B) embryos where the nascent parotid (magenta), submandibular (cyan), and sublingual (yellow) glands were segmented and pseudocolored. (C) shows a lateral view of the parotid (arrow) overlaid on the 3D rendering image (gray) of the face. (D and E) Branching morphogenesis of the parotid gland and submandibular glands. A unique duct connects the glands to the mouth. (F–H) Development of the sublingual glands. The first buds are visible at PCW7 and stay rather short until PCW9 when some sublingual glands start ramifying at their apex (F). (G and H) At PCW11.3, the number of glands has increased on both sides and they are distributed beneath the tongue, along all its length, all individually connected to the mouth floor. (H and I) Both the submandibular (arrowheads in H) and sublingual (arrowheads in I) are densely innervated by synaptophysin+ axons emanating from the chorda tympani branch of the facial nerve (VII). Scale bars: all panels are counted from left to right for each row; 700 μm in (A), (B), (D, right), and (I); 1 mm in (C), (G), and (H); 200 µm in (D, left and middlepanels); 100 μm in (E, first panel); 300 μm in (E, second and third panels) and (F, third panel); and 500 μm in (E, fourth panel) and (F, all panels except for the third).
Figure 5
Figure 5
Development of human lacrimal glands All panels are LSFM images of solvent-cleared eyes and heads immunostained with anti-Sox9 (A–H) and combined with MHC (A) and synaptophysin (D). (A) Frontal view of the left eye of a PCW11.3 fetus. The orbiculari oculari muscle is seen as well as the upper (uel) and lower (lel) eye lids. The eye is pseudocolored in blue. The lacrimal gland (arrowheads) and its individual ducts (colored) are seen lying on the superolateral side of the eyeball. (B–D) Organization the lacrimal gland in a PCW10.1 fetus. (B) shows the raw image obtained with Sox9 staining. In (C), all individual subglands are individually segmented and pseudocolored, the longest one in red. (D) shows the time course of lacrimal gland development, in situ on the eyeballs, between PCW7.5, when only a few buds are observed, and PCW11.3. (E) All images are at the same scale to illustrate the growth of the lacrimal glands. All subglands have been individually segmented and colored. The color code is conserved, with the longest one in red as a reference (see also Figure S6). (F) Frontal view of the face and nose/mouth of a PCW7.5 embryo stained with anti-Sox9. Overlays are 3D rendering images of the face (in gray). The superior (slc) and inferior (ilc) lacrimal canaliculi and nasolacrimal duct (ld) have been segmented and pseudocolored in orange. (G–H) The developing eye lashes are labeled with Sox9 and form 2 arrays lining the edges of the upper (uel) and lower (lel) eyelids at PCW11.3 (arrowheads in G and H). At PCW13 (H), the number of Sox9+ buds has increased and might also include the developing meibomian glands. Related to Figure S6. Scale bars: all panels are counted from left to right for each row; 150 μm in (A); 500 μm in (B, left panel), (D), and (E, fourth panel); 400 μm in (B, right panel), (C), and (E, all panels except for the first and fourth); 200 μm in (E, first panel); and 1 mm in (F)–(H).
Figure S6
Figure S6
Stochastic development of lacrimal glands in human embryos, related to Figure 6 (A–E) All panels are LSFM images of solvent-cleared embryo (A and B) and fetuses (C–E), immunostained for Sox9 (A–E) and Synaptophysin (Syn, C). In each case, the 2 eyes (right and left) are shown, to illustrate the heterogeneity and asynchrony of lacrimal gland development. A mirror image is presented for the left eye to facilitate the comparison with the right eye. (A–D) At PCW7 (A) and PCW8 (B) a few buds emerge on both sides. In (B) the longest one is colored in red, the two adjacent ones in green and cyan. The color code is conserved starting from the red/longest duct. Note that from the onset, the number and length of the buds differs between eyes. (C) and (D) shows the right and left eyes of 2 fetuses of similar age (PCW10.4 and PCW10.1 respectively). All subglands have been individually segmented and numbered. The number of glands varies between eyes and between cases. Their respective length is also highly variable with one (in red in all cases) always longer than the others. The relative position, along the superomedial to inferolateral axis, of the longest and most branched subgland (red) also varies between eyes and individuals (position 3/7 in B, 11/16 in right C, 8/9 in left C, 10/11 in D, 10/16 in right E, and 11/13 in left E). Branching mostly occurs at the growing tips, but side branches also form all along the individual ducts. (E) At PCW11.3, the glands have further developed and have more side branches. Variability in size and branching complexity is still high. Scale bars: all panels are counted from left to right for each row; 500 μm in (A), (C, first panel first row and second row), (D, first panel first row and second row), and (E, second panel second row); 400 μm in (B, first and third panels), (C, second panel first row), and (D, second panel first row); 200 μm in (B, second and fourth panels); 1 mm in (E, first panel second row).
Figure 6
Figure 6
3D analysis of developing cephalic arteries in human embryos (A–D) Head and neck vascular segmentation in a PCW7 embryo immunostained for SMA (A, lateral view and B, frontal view), SOX9 (C) and PLVAP (D). (E–H) Segmentation and mesh generation of the basilar artery (BA). (I–K) Isolated segmented head and neck arterial vasculature with randomization of individual arterial segment colors is shown in frontal (I) and lateral (J) views. (K) shows head and neck arteries in conjunction with semi-transparent meshes of reference cartilaginous structures (white) and the choroid plexuses (green). (L) Frontal view showing the right and left superior thyroid arteries (STAs) in relation to the thyroid cartilage (TC). Also showing the common carotid arteries (CCAs) and lingual arteries (LAs). (M) Frontal view of the right (R VA) and left (L VA) vertebral arteries in relation to semi-transparent cervical vertebra (numbered C1–C7). Related to Figure S7. Scale bars: 2.5 mm in (A)–(C), (E), (J), and (K); 1 mm in (D); 500 μm in (F)–(H), (L), and (M); and 2 mm in (I).
Figure 7
Figure 7
Closure of the arterial circle of Willis and establishment of major cerebral arteries Superior view of the circle of Willis in a PCW7 embryo (A–C and E). (A) The circle is fed by the right and left internal carotid arteries (ICAs) and the basilar artery (BA). (B and E) All segments of the circle of Willis are conspicuous including the caudal division of the ICA, subdivided into the most posterior P1 segment and posterior communicating (PCom) segment, the cranial division of the ICA with the adult ICA terminal segment, proximal A1 (distal to the origin of the middle cerebral artery (MCA) and proximal to the origin of the primitive olfactory artery (POA)), distal A1 and anterior communicating artery (ACom). (C) Both MCA and post communicating anterior cerebral artery (ACA) are well identified. Posterior branches of the circle of Willis include the mesencephalic arteries (MesAs) as well as the primitive posterior choroidal arteries (PPChoAs) and diencephalic arteries (DiAs) arising from a common trunk (yellow). (D–F) Anterior closure of the circle of Willis and subsequent growth in PCW5.6, PCW7, and PCW8.4 specimens. The series shows how the anterior cerebral artery first appears as a medial branch of the POA, before overshadowing the latter. (G and H) The POA is shown to course into the nasal capsule along the olfactory filaments (H). Notice the medial striate arteries (MSAs) or recurrent arteries of Heubner arising from the peri-communicating segment of the ACA. (I) The stem of the posterior cerebral artery (PCA) is represented by the most distal segment of the ICA caudal division (P1 segment). Notice the asymmetry of the P1 segments in the PCW5.6 embryo, showing early onset of a classical circle of Willis variant. (J) The telencephalic choroid plexus (TCP) or choroid plexus of the lateral ventricule, is seen to be fed by both the anterior choroidal artery (AChoA) and the PPChoA. (K) In another late PCW7 specimen, the PPChoAs give rise to prominent branches (yellow arrows) terminating at the medial posterior surface of the cerebral hemispheres (white stars). (L) The adult posterior cerebral artery is a composite vessel combining the posterior segment of the ICA caudal division (1; blue), the diencephalic-choroid common trunk (2; yellow), the proximal stem of the primitive posterior choroidal artery (3; pink), and post choroidal branches (4; beige) that are shown to vascularize the posterior and medial surface of the developing telencephalic vesicles. The terminal choroidal branches are likely represented in the adult by the lateral posterior choroidal arteries. Related to Figure S7. Scale bars: 1 mm in (A)–(H), (J), and (K) and 500 μm in (I) and (L).
Figure S7
Figure S7
Assembly of the external carotid and ophthalmic arteries and 3D visualization of human embryonic structures with Verge3D, related to Figures 1, 6, and 7 (A) In a PCW5.6 specimen, the left common carotid artery (CCA) primitively divides into an internal carotid artery (ICA) and a ventral pharyngeal artery (VPA), the future stem of the external carotid artery (ECA), not to be confused with the adult ascending pharyngeal artery. Note that the CCA is still connected to the aorta by a putative carotid duct (pCD) remnant. The ICA gives rise to the transient stapedial artery (SA), passing through the stapedial ring obturator foramen (well depicted with SOX9 staining in a PCW7 specimen in B). At PCW5.6 (A), the nascent SA divides into a lower maxillomandibular division (MMD) and an upper supraorbital division (SOD). The ICA (well depicted in C) gives rise to a primitive dorsal ophthalmic artery (PDOA), proximal to the posterior communicating artery (PCom), and a distal primitive ventral ophthalmic artery (PVOA). (B) Foreshadowing future reconfigurations, at age PCW7, the VPA has anastomosed with the lower division of the stapedial artery, acquiring the internal maxillary artery (IMA) in the process, and the ophthalmic artery has anastomosed with the upper division of the stapedial artery, acquiring its extraocular orbital branches (SOD). The persistent channel between the two (white vessel) is the future middle meningeal artery, connected to the ophthalmic artery by the so-called sphenoidal anastomosis (SpA, well depicted in D). The inset shows an unidentified branch of the ICA, proximal to the origin of the SA, speculatively related to the embryology of the ascending pharyngeal artery and warranting further exploration. (A and C) Interestingly and contrary to a common misconception, the PVOA is not a branch of the anterior cerebral artery but rather arises from ICA cranial division (ICA CD), opposite to the emergence of the anterior choroidal artery (AChoA) and proximal to the origin of the middle cerebral artery (MCA). The PDOA branches into a temporociliary artery (TCilA) and a hyaloid artery (HA) penetrating the optic nerve. The PVOA terminates as a nasociliary artery (NCilA). (D) At PCW7 (superior view), the stem of the definitive ophthalmic artery gives rise to both nasociliary and temporociliary arteries as well as the hyaloid artery. (E–H) PLVAP immuno-staining of four PCW5.4 to PCW10.4 eyes showing the choroid (brown, fed by the ciliary arteries) and hyaloid (blue, fed by the hyaloid artery) vasculatures. The ocular growth series between PCW5.4 and PCW10.4 specimens demonstrates the maturation of the vasa hyaloidea propria (VHP), the tunica vasculosa lentis (TVL), and the pupillary membrane (PM) vessels. Establishment of the PM vascular coverage was the last element of the hyaloid vasculature to appear between PCW7 and PCW8.1. (I–L) (I and L) Visualization of human embryonic structures, through screenshots of 3D models of two PCW7 human embryo visualized in Verge3D web interface. Structures were immunostained with Collagen 2 (I and J) SMA, PLVAP, and Sox9 (K and L), segmented and 3D meshes were generated. (I) Frontal view of the whole embryo presumptive skeleton. (J) Lateral view of the head and neck presumptive skeleton. (K) shows all segmented structures pseudocolored through the semi-transparent embryo surface. (L) shows the vertebral arteries in relation to the cervical spine (the embryo surface is deleted). Scale bars: 500 μm in (A), (C), and (E)–(H) and 1 mm in (B), (D), and (L).

References

    1. Darwin C. John Murray; 1859. On the Origin of Species by Means of Natural Selection, or the Preservation of Favoured Races in the Struggle for Life. - PMC - PubMed
    1. Gans C., Northcutt R.G. Neural crest and the origin of vertebrates: A new head. Science. 1983;220:268–273. - PubMed
    1. Mai C.T., Isenburg J.L., Canfield M.A., Meyer R.E., Correa A., Alverson C.J., Lupo P.J., Riehle-Colarusso T., Cho S.J., Aggarwal D., et al. National population-based estimates for major birth defects, 2010–2014. Birth Defects Res. 2019;111:1420–1435. - PMC - PubMed
    1. Martik M.L., Bronner M.E. Riding the crest to get a head: neural crest evolution in vertebrates. Nat. Rev. Neurosci. 2021;22:616–626. - PMC - PubMed
    1. Oisi Y., Ota K.G., Kuraku S., Fujimoto S., Kuratani S. Craniofacial development of hagfishes and the evolution of vertebrates. Nature. 2013;493:175–180. - PubMed

Publication types

LinkOut - more resources