. 2023 Dec 9;14(1):8153.
doi: 10.1038/s41467-023-43995-5.

Amplified fluorogenic immunoassay for early diagnosis and monitoring of Alzheimer's disease from tear fluid

Affiliations

Amplified fluorogenic immunoassay for early diagnosis and monitoring of Alzheimer's disease from tear fluid

Sojeong Lee et al. Nat Commun. .

Abstract

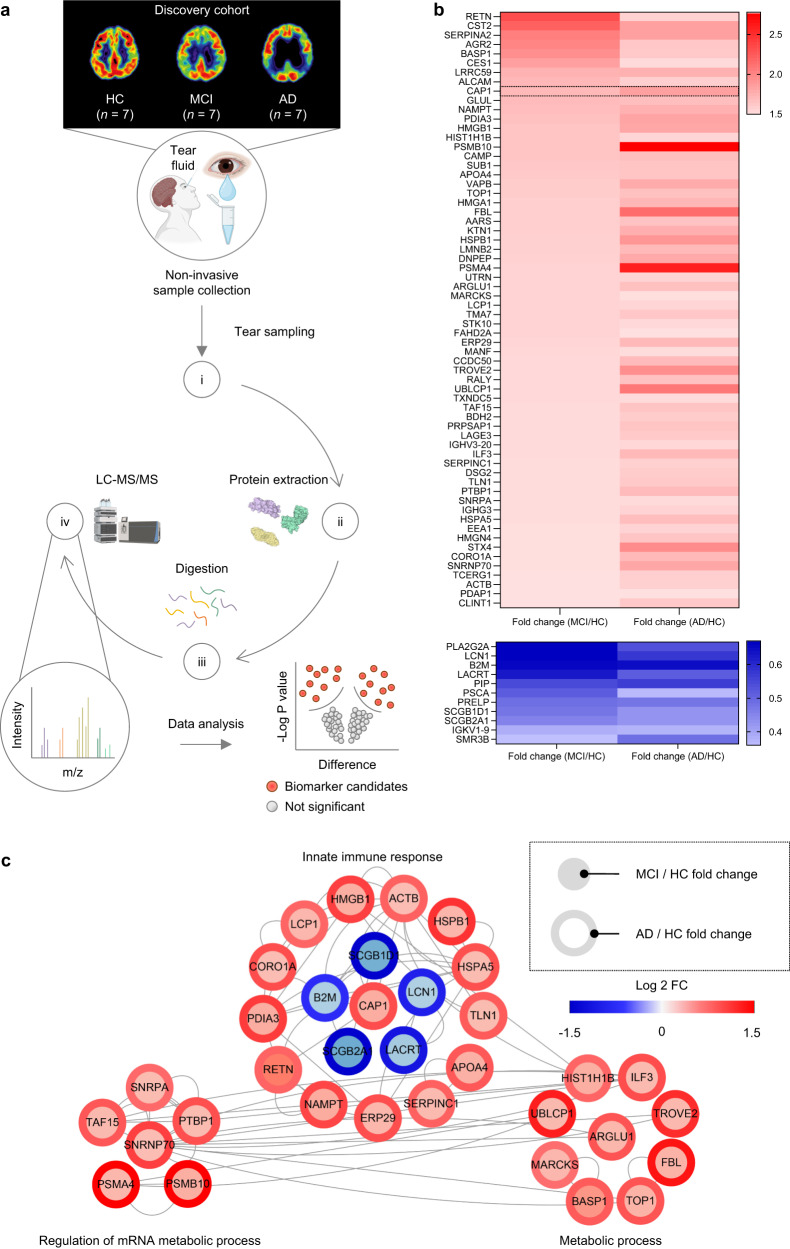
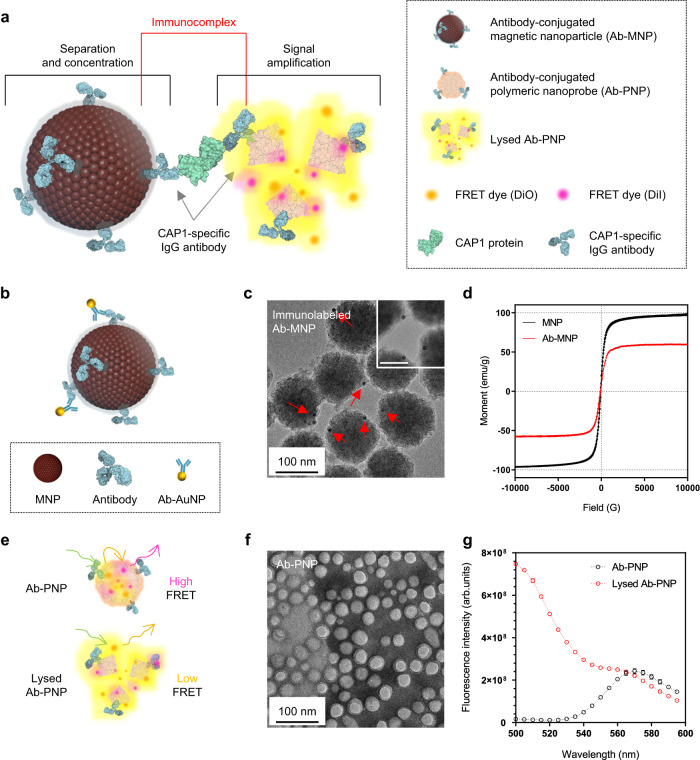
Accurate diagnosis of Alzheimer's disease (AD) in its earliest stage can prevent the disease and delay the symptoms. Therefore, more sensitive, non-invasive, and simple screening tools are required for the early diagnosis and monitoring of AD. Here, we design a self-assembled nanoparticle-mediated amplified fluorogenic immunoassay (SNAFIA) consisting of magnetic and fluorophore-loaded polymeric nanoparticles. Using a discovery cohort of 21 subjects, proteomic analysis identifies adenylyl cyclase-associated protein 1 (CAP1) as a potential tear biomarker. The SNAFIA demonstrates a low detection limit (236 aM), good reliability (R2 = 0.991), and a wide analytical range (0.320-1000 fM) for CAP1 in tear fluid. Crucially, in the verification phase with 39 subjects, SNAFIA discriminates AD patients from healthy controls with 90% sensitivity and 100% specificity in under an hour. Utilizing tear fluid as a liquid biopsy, SNAFIA could potentially aid in long-term care planning, improve clinical trial efficiency, and accelerate therapeutic development for AD.


Conflict of interest statement

The authors declare no competing interests.

Figures

Fig. 1
Fig. 1. Workflow of a discovery and verification cohort study for early diagnosis and monitoring of Alzheimer’s disease.
Sixty human tear fluid samples were utilized in two cohorts: a discovery cohort and a verification cohort. The discovery cohort was comprised of tear samples from 7 healthy controls (HC), 7 patients with mild cognitive impairment (MCI), and 7 patients with Alzheimer’s disease (AD) for a total of 21 tear samples. Proteomic analysis using mass spectrometry identified adenylyl cyclase-associated protein 1 (CAP1) as a promising potential biomarker. The verification cohort consisted of 14 HC, 15 MCI patients, and 10 AD patients, with a total of 39 tear samples. A self-assembled nanoparticle-mediated fluorescence immunoassay (SNAFIA) was applied to detect the target protein, CAP1, in human tear fluid samples. The presence of the CAP1 protein generated a sandwich immunocomplex with an antibody-conjugated magnetic nanoparticle (Ab-MNP) and an antibody-conjugated polymeric nanoprobe (Ab-PNP), enabling the discrimination of the three groups of participants based on the analysis of the fluorescence signals from the SNAFIA assay. The schematic was created with BioRender.com.
Fig. 2
Fig. 2. Discovery of human tear fluid biomarkers for AD by proteomic analysis.
a Schematic of the experimental design for global proteome profiling by tandem mass tag labeling using human tear fluid samples from the discovery cohort. (i) Tear fluids were collected non-invasively using a polyester wick. (ii) Proteins of the pooled tear fluids digested into peptides by in-solution digestion. (iii) Each peptide sample was labeled with tandem mass tags. Peptide separation was carried out using high-pH reverse-phase liquid chromatography fractionation. (iv) For the proteome profiling analysis, fractionated peptides were analyzed using the Q Exactive orbitrap hybrid mass spectrometer. Full mass spectrometry data were acquired using the Proteome Discoverer software version 2.1. b Heatmap of differentially expressed proteins (DEPs) determined by comparing the relative expression levels in patients with MCI or AD to the HC group (MCI/HC or AD/HC). Proteins exhibiting fold changes greater than 1.5 classified as upregulated (top) and proteins showing a fold change less than 0.67 classified as downregulated (bottom). Statistical analysis was performed for each protein using a t-test (p < 0.01). c Protein–protein interaction network with significantly enriched biological processes generated from proteins differentially expressed in tear fluid from patients with MCI and AD compared with HC. The inner and outer gray circles represent the relative protein expression (fold change) of each AD and MCI group compared to the HC group, with values close to 1.5 and −1.5 on the log2 fold change scale shown in red and blue, respectively. The colors of the nodes represent proteins that were significantly increased (red) or decreased (blue) in MCI or AD. Gray lines between nodes indicate biological or physical interactions between proteins. Schematics were created with BioRender.com.
Fig. 3
Fig. 3. Characterization of the synthesized Ab-MNPs and Ab-PNPs.
a Schematic of the immunocomplex constructed by Ab-MNPs and Ab-PNPs in the presence of the target protein (CAP1) in tear fluid. b Schematic representation of Ab-MNPs labeled with immunogold (Ab-AuNPs) for better visualization of the primary capture antibody bound to the MNPs. c Representative transmission electron microscopy (TEM) image of Ab-MNPs labeled with immunogold (Ab-AuNPs, approximately 10 nm in diameter). Red arrows indicate the localized AuNPs on the surface of Ab-MNPs. The scale bars indicate 100 nm and 50 nm (inset), respectively. d Magnetization curves of MNPs (black) and Ab-MNPs (red) obtained by vibrating sample magnetometer (VSM) at 25 °C. e Schematic of Förster resonance energy transfer (FRET) signal changes of Ab-PNPs induced by treatment with TX-100 surfactant as lysis buffer. f TEM image of Ab-PNPs negatively stained with 3% (w/v) phosphotungstic acid solution (pH 6.81). The scale bar represents 100 nm. g Emission fluorescence spectra of Ab-PNPs before (black circles) and after (red circles) treatment with lysis buffer (excitation at 475 nm). Data represent mean ± s.d. for three independent experiments. The representative images were taken from different samples and repeated at least 50 times independently collection with similar results. Schematics were created with BioRender.com.
Fig. 4
Fig. 4. Evaluation of the SNAFIA platform toward AD biomarker candidates in artificial tear fluid.
a Detailed process of SNAFIA test using tear fluid. First, (i) tears are combined with Ab-MNPs and Ab-PNPs to form a sandwich immunocomplex with a target protein. (ii) The immunocomplex is subsequently separated from the mixture using a magnet, removing non-target and excess Ab-PNPs. (iii) TX-100 surfactant is added as a lysis buffer to disrupt Ab-PNPs and allow to release of FRET dyes from the Ab-PNPs, amplifying the signal. b Normalized fluorescence intensity (FI) of SNAFIA with increasing concentrations of CAP1 protein spiked in phosphate-buffered saline (PBS, black circles) and artificial tear fluid (ATF, turquoise circles) solution (excitation at 475 nm, emission at 500 nm). The limit of detection (LOD) of SNAFIA in each condition was determined by three-sigma (3σ) and calculated to be 0.282 and 0.236 fM, respectively. c Fluorescence and absorbance signal responses of the SNAFIA (turquoise dots), half-SNAFIA (hSNAFIA, yellowish dots), and ELISA (black dots) tests with different concentrations of CAP1 protein ranging from 10−2 to 108 fM. Normalized FI and absorbance data were fitted to the four-parameter logistic curve (dotted line), and the linear dynamic range of each test is shown by the shaded area. d Selectivity of SNAFIA for various AD biomarker candidates and their mixtures in PBS. The concentrations of CAP1 (turquoise bars), apolipoprotein E (APOE, magenta bars), and acetylcholinesterase (ACHE, orange bars) were varied to 1 pM (1×), 5 pM (5×), and 10 pM (10×). Statistical analysis was performed by multiple comparisons of Brown-Forsythe and Welch one-way analysis of variance tests (****p < 0.0001). The measurement was performed in triplicate, and all reported values represent mean ± s.d.; n = 3 repeated tests. Schematics were created with BioRender.com.
Fig. 5
Fig. 5. Clinical diagnosis application of SNAFIA using tear fluids from MCI and AD patients from a verification cohort.
a Schematic of CAP1 detection by SNAFIA using tear fluid. The SNAFIA test is performed using non-invasively collected tear fluid. The intensity of the fluorescence signals obtained from the SNAFIA test determines the stage of AD progression. b SNAFIA test results showing the normalized FI using human tear fluid from the HC (left), MCI (middle), and AD (right) groups. The pink box labeled patient (patient ID: 16) showed disease progression from MCI to definite AD over two years. c Comparison of normalized FI of the CAP1 biomarker candidate in the human tear fluid of HC, MCI, and AD groups. Each signal analysis of SNAFIA was performed on HC (n = 14), MCI (n = 15), and AD (n = 10) individuals from the verification cohort. Statistical analysis was performed using a one-way analysis of variance (***p = 0.0003, *p = 0.0251, Kruskal-Wallis test). All measurements were performed in triplicate, and data represent mean ± s.d. d Receiver operating characteristic (ROC) curves of SNAFIA for MCI (yellow dots) or AD (red dots) groups compared with HC individuals. The area under the ROC curve values is shown in the graph. e Correlation between fluorescence signals of SNAFIA using clinical tear samples and the patient’s Mini-Mental State Examination (MMSE) score. The scatter plot shows that the SNAFIA signals and MMSE scores are negatively correlated, with a Pearson correlation coefficient value of −0.8255. Statistical analysis was performed by two-tailed (***p = 0.0002). Schematics were created with BioRender.com.

References

    1. Serrano-Pozo A, et al. APOE and Alzheimer’s disease: advances in genetics, pathophysiology, and therapeutic approaches. Lancet Neurol. 2021;20:68–80. doi: 10.1016/S1474-4422(20)30412-9. - DOI - PMC - PubMed
    1. Aisen PS, et al. Early-stage Alzheimer disease: getting trial-ready. Nat. Rev. Neurol. 2022;18:389–399. doi: 10.1038/s41582-022-00645-6. - DOI - PMC - PubMed
    1. Sperling RA, et al. Testing the right target and right drug at the right stage. Sci. Transl. Med. 2011;3:111cm33. doi: 10.1126/scitranslmed.3002609. - DOI - PMC - PubMed
    1. Cummings J, et al. Alzheimer’s disease drug development pipeline: 2021. Alzheimer’s Dement. 2021;7:e12179. doi: 10.1002/trc2.12179. - DOI - PMC - PubMed
    1. Petersen RC. How early can we diagnose Alzheimer disease (and is it sufficient)? The 2017 Wartenberg lecture. Neurology. 2018;91:395–402. doi: 10.1212/WNL.0000000000006088. - DOI - PMC - PubMed

Publication types