. 2023 Dec 9;14(1):8172.
doi: 10.1038/s41467-023-44053-w.

The long non-coding RNA HOTAIR contributes to joint-specific gene expression in rheumatoid arthritis

Affiliations

The long non-coding RNA HOTAIR contributes to joint-specific gene expression in rheumatoid arthritis

Muriel Elhai et al. Nat Commun. .

Abstract

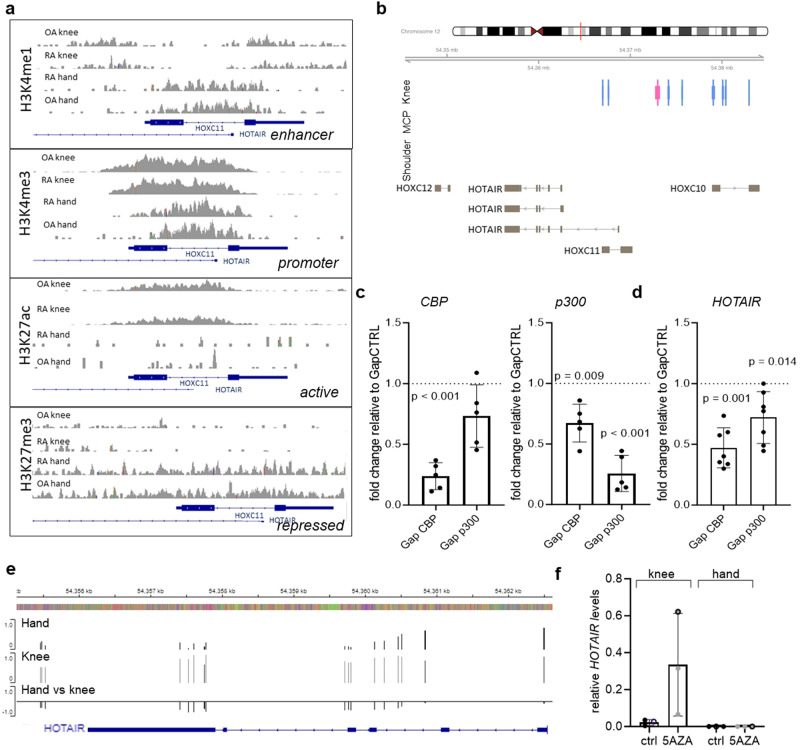
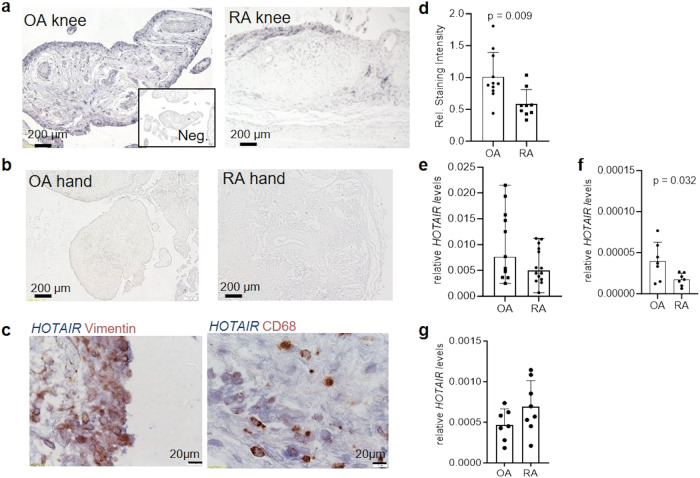
Although patients with rheumatoid arthritis (RA) typically exhibit symmetrical joint involvement, some patients develop alternative disease patterns in response to treatment, suggesting that different molecular mechanism may underlie disease progression depending on joint location. Here, we identify joint-specific changes in RA synovium and synovial fibroblasts (SF) between knee and hand joints. We show that the long non-coding RNA HOTAIR, which is only expressed in knee SF, regulates more than 50% of this site-specific gene expression in SF. HOTAIR is downregulated after stimulation with pro-inflammatory cytokines and is expressed at lower levels in knee samples from patients with RA, compared with osteoarthritis. Knockdown of HOTAIR in knee SF increases PI-Akt signalling and IL-6 production, but reduces Wnt signalling. Silencing HOTAIR inhibits the migratory function of SF, decreases SF-mediated osteoclastogenesis, and increases the recruitment of B cells by SF. We propose that HOTAIR is an important epigenetic factor in joint-specific gene expression in RA.


Conflict of interest statement

M.E., R.M., L.K., A.K., M.T., T.R., C.G., M.H., M.M., L.M., C.P., K.B., A.L., G.K., K.K., P.S., M.F.B., S.G.E., M.S., G.K., M.A., and C.O. declare no competing interests. O.D. has/had relationships with the following companies in the area of potential treatments for systemic sclerosis and its complications in the last three calendar years: Speaker fee: Bayer, Boehringer Ingelheim, Janssen, Medscape Consultancy fee: 4P-Pharma, Abbvie, Acceleron, Alcimed, Altavant Siences, Amgen, AnaMar, Arxx, AstraZeneca, Baecon, Blade, Bayer, Boehringer Ingelheim, Corbus, CSL Behring, Galapagos, Glenmark, Horizon, Inventiva, Kymera, Lupin, Miltenyi Biotec, Mitsubishi Tanabe, MSD, Novartis, Prometheus, Redxpharna, Roivant, Sanofi and Topadur Research Grants: Kymera, Mitsubishi Tanabe, Boehringer Ingelheim Oliver Distler has/had relationships with the following companies in the area of potential treatments for dermatomyositis and its complications in the last three calendar years: Consultancy fee for rheumatology topic: Pfizer (2021) Oliver Distler has/had relationships with the following companies in the area of potential treatments for arthritides in the last three Consultancy fee: Abbvie.

Figures

Fig. 1
Fig. 1. HOTAIR changes site-specific gene expression in synovial fibroblasts.
a Krenn synovitis score in hand (n = 36) and knee (n = 27) synovium from RA patients. Mean +/− standard deviation is shown. b Vascularization as assessed by CD31staining in synovium from RA patients (35 hands and 24 knees). Vessels were counted in 5 fields (20x magnification). χ2 test. c Synovial histological pattern in hand (n = 36) and knee (n = 26) RA synovium, χ2 test. d Cell proportions between hand (n = 8) and knee (n = 6) synovium using single cell RNA sequencing. SF synovial fibroblasts, SMC smooth muscle cells, EC endothelial cells, MastC mast cells, PC plasma cells, BC B cells, TC T cells, NKC NK cells, nGC neutrophilic granulocytes, MC myeloid cells, ProIC proliferating cells. e HOX gene expression in hand (n = 8) and knee (n = 6) synovial fibroblasts from RA patients in single cell RNA sequencing analysis. f Scatter dot plot of pathway enrichment analysis of genes significantly enriched in hand SF (n = 8) and in knee SF (n = 4) (FDR < 0.05; Log fold change +/−1). Blue dots: significantly enriched pathways, darker color corresponds to lower p-values. Grey dots represent pathways with p > 0.05. Fisher exact test. g Overlap between genes changed by HOX genes (HOXD10, HOXD11, HOXD13, HOTTIP, HOTAIR) and genes differentially expressed between hand (n = 8) and knee (n = 6) SF in single cell RNA sequencing. SF synovial fibroblasts. Not reported p-values on the figure were not significant.
Fig. 2
Fig. 2. Joint-specific HOTAIR expression is epigenetically imprinted.
a Assessment of H3K4me1, H3K4me3, H3K27ac and H3K27me3 marks by ChIP seq over the promoter/transcription start site region of HOTAIR, which lies within the intron of HOXC11. Data was extracted from GSE163548. b CAGE (cap analysis of gene expression) of enhancers/promoters at the HOTAIR locus. Active promoters (light blue bars) and an enhancers (pink bars) are present in SF from knees (n = 2), but not in metacarpophalangeal (MCP) joints (n = 3) or shoulders (n = 2). Data were extracted from GSE163548. c Expression of CBP (left panel) and p300 (right panel) was measured by qPCR in SF transfected with GapmeRs targeting CBP (n = 5) and p300 (n = 5), respectively. Mean +/− standard deviation is shown. One sample t test. d Expression of HOTAIR following silencing of SF for p300 and CBP, respectively (n = 6). Control transfected cells were set to 1. Mean +/− standard deviation is shown. One sample t test. e Average DNA methylation in hand (n = 1 OA/4 RA) and knee SF (n = 1 OA/4 RA) across the HOTAIR gene. Delta beta values (third row) show differentially methylated CpG sites between hand and knee samples. HumanMethylation 450 BeadChip data was taken from ref. . f Expression of HOTAIR following treatment with 1 μM 5-azacytidine (5AZA) for 5 days in knee and hand SF. Open circle RA SFs, closed circle OA SF (n = 3). Mean +/− standard deviation is shown. Not reported p-values on the figure were not significant.
Fig. 3
Fig. 3. HOTAIR is expressed in synovial tissues of lower extremity joints with higher expression in OA than in RA.
a Representative pictures of synovial tissues from knee joints of OA (left, n = 11) and RA (right, n = 9) patients stained for HOTAIR by in-situ hybridization (ISH). Magnification 100×. Inset shows staining with the anti-sense probe (negative control). b Representative picture of HOTAIR in-situ hybridization in synovial tissues of OA and RA hand joints (n = 3). Magnification 100×. c Double staining of HOTAIR (in blue) and vimentin (in red, left panel) or CD68 (in red, right panel) to assess HOTAIR expression in synovial fibroblasts and macrophages, respectively. Magnification 400×. d Relative quantification of HOTAIR ISH in OA (n = 11) and RA (n = 9) synovial tissue using ImageJ. Mean +/− standard deviation is shown. Unpaired t test. e Expression of HOTAIR measured by quantitative PCR in OA (n = 11) and RA (n = 14) synovial tissues normalized to GAPDH as housekeeping gene. Mean +/− standard deviation is shown. f Expression of HOTAIR measured by quantitative PCR in OA (n = 7) and RA (n = 7) synovial tissues normalized to COL3A1. Mean +/− standard deviation is shown. Unpaired t test. g Expression of HOTAIR measured by quantitative PCR in cultured OA (n = 7) and RA (n = 8) SF. Mean +/− standard deviation is shown. Unpaired t test. OA osteoarthritis, RA rheumatoid arthritis.
Fig. 4
Fig. 4. HOTAIR is downregulated by inflammatory cytokines and shapes the epigenetic landscape of synovial fibroblasts.
a SF were left untreated or stimulated with TNF (n = 21), LPS (n = 9), poly I:C (PIC) (n = 9), TGFβ (n = 9), IL1β (n = 9), or bacterial lipoprotein (bLP)(n = 3) for 24 h. Expression of HOTAIR was measured by qPCR. Unstimulated samples were set to 1. Mean +/− standard deviation is shown, one sample t test (all but IL1β). IL1β: median and range, one sample Wilcoxon. b CAGE analysis of enhancers/promoters at the HOTAIR locus in SF from knees (n = 2) in basal conditions and after stimulation with TNF. After TNF stimulation several active promoters (light blue bars) and the enhancer (pink bar) disappear in knee SF. c Correlation between TNF and HOTAIR expression measured by qPCR in RA synovial tissues. Pearson correlation, one-sided. d Expression of Hotair was measured by qPCR in knee and ankle SF isolated from wildtype (WT) (n = 14) and TNF transgenic (Tg197) (n = 13) C57BL/6 mice. Median and range is shown. Mann–Whitney test. e ChIP sequencing of H3K27me3 marks in SF silenced for HOTAIR (n = 3) and control SF (n = 3) was performed 48 h after transfection. TSS Transcription start site. SF synovial fibroblasts, RA rheumatoid arthritis, OA osteoarthritis. Not reported p-values on the figure were not significant.
Fig. 5
Fig. 5. HOTAIR modulates arthritis relevant pathways.
a Scatter dot plot of pathway enrichment analysis of genes significantly changed after HOTAIR silencing (FDR < 0.05; Log fold change +/− 1). Blue dots: significantly enriched pathways, darker color corresponds to lower p-values. Grey dots represent pathways with p > 0.05. Fisher exact test. b Expression of COL1A1 (n = 8), COL1A2 (n = 6) and COL1A3 (n = 5) measured by quantitative PCR between SF transfected with control (GapCTRL) or HOTAIR targeting GapmeR (GapHOTAIR) after 48 h. Control transfected cells were set to 1. Mean +/− standard deviation is shown. c Pro-Collagen was measured in supernatants of SF transfected with control or HOTAIR targeting GapmeR after 48 h (n = 10) and 72 h (n = 11) by ELISA. d Collagen I was stained by immunohistochemistry in 3D micromasses formed with control or HOTAIR silenced SF (n = 6). Right panel: representative pictures, 25× magnification, scale bare = 200 µm; left panel: quantification with ImageJ and analysis with paired t test. e Expression of FGF2 (n = 7), FGF7 (n = 8), FGF8 (n = 7) and FGFR2 (n = 8) measured by quantitative PCR between SF transfected with control or HOTAIR targeting GapmeR after 48 h. Control transfected cells were set to 1. Mean +/− standard deviation is shown. One sample t test. f FGF8 secretion in cell culture supernatants 48 h (n = 11) and 72 h (n = 5) after transfection measured by ELISA. Paired t test. g Expression of AKT and phosphorylated AKT in SF transfected with control or HOTAIR targeting GapmeR after 48 h (n = 4) and 72 h (n = 10). Right panel: representative examples; left panel: densitometric analysis. Paired t test.
Fig. 6
Fig. 6. HOTAIR modulates Wnt signaling and cytokine expression.
a Expression of CTNNB1 (n = 8), LRP6 (n = 5), LGR5 (n = 7) and GSK3B (n = 9) measured by quantitative PCR between synovial fibroblasts (SF) transfected with control (GapCTRL) or HOTAIR targeting GapmeR (GapHOTAIR) after 48 h. Control transfected cells were set to 1, Mean +/− standard deviation is shown, one sample t test. b Activation of the canonical Wnt pathway was assessed by luciferase assay with a TCF/LEF reporter assay (n = 6) or (c) with a Wnt reporter gene (Top) or a mutated Wnt reported gene (Fop) as control (n = 5) in SF transfected with control or HOTAIR targeting GapmeR after 48 h.Wilcoxon and one sample t test, respectively. d Expression of IL12A (n = 6), IL6 (n = 6), CXCL12 (n = 10), PTEN (n = 7), FOXO1 (n = 7) and RUNX1 (n = 6) measured by quantitative PCR between SF transfected with control or HOTAIR targeting GapmeR after 48 h. Control transfected cells were set to 1. Mean +/− standard deviation is shown. One sample t test. e IL12p35 (48 h: n = 9, 72 h: n = 7), (f) IL-6 (48 h: n = 13, 72 h: n = 12) and (g) CXCL12 (48 h: n = 8, 72 h: n = 9) were measured in supernatants of SF transfected with control or HOTAIR targeting GapmeR after 48 h and 72 h by ELISA. All paired t test. h IL-6 was measured in supernatants of micromasses after 7 days by ELISA (n = 7). Paired t test. Not reported p-values on the figure were not significant.
Fig. 7
Fig. 7. Changes in HOTAIR expression modulate synovial fibroblast subtypes.
a Single cell RNA sequencing (scRNAseq) data from synovial tissues were integrated with scRNAseq data from cultured synovial fibroblasts (SF) transfected with control (GapCTRL) or HOTAIR targeting GapmeR (GapHOTAIR) (n = 3). UMAP representation of the different SF subtypes is shown. b UMAP representation of the distribution of cells in control and HOTAIR silenced SF (cultured cells only). c Proportions of the different SF subtypes in control and HOTAIR silenced SF. x-squared = 80.947; df = 9; p-value = 10.48e-13. Chi-Square. d Change of expression of selected genes within the different SF subtypes. Red dots mark p < 0.05. Wilcoxon Rank Sum test.
Fig. 8
Fig. 8. HOTAIR silencing induces functional changes in synovial fibroblasts.
Real-time measurements of synovial fibroblasts (SF) (a) adhesion (0–16 h), (b) spreading (17–127 h) and (c) proliferation (132–245 h) in SF transfected with control GapmeR (GapCTRL) or HOTAIR GapmeR (GapHOTAIR) (n = 3). Cell index = arbitrary unit of impedance. Mean +/− standard deviation is shown. Two-way ANOVA. d Measurement of open area covered over time by SF transfected with control GapmeR or HOTAIR GapmeR (n = 6) in scratch assay. Mean +/− standard deviation is shown. Two-way ANOVA. e Caspase 3/7 activation in untransfected, control and HOTAIR GapmeR transfected SF after 48 h of transfection (n = 6). RLU relative luminescence units after background subtraction. Mean +/− standard deviation is shown. Paired t test. f Left panel: representative pictures of tartrate-resistant acid phosphatase (TRAP) staining of osteoclasts differentiated from monocytes by co-culture (n = 7) (upper panel) or incubation with supernatants (SN) (n = 5) of control or HOTAIR transfected SF (lower panel). Right panel: quantification of TRAP+ cells in the described conditions. SF: co-culture with synovial fibroblasts (black dots), median and range is shown. Wilcoxon paired test; SN: incubation with supernatant (white dots). Mean +/− standard deviation is shown. g Left panel: representative pictures of resorption areas after incubation of bone slices with osteoclasts differentiated by co-culture (n = 6)(upper panel) or incubation with supernatants of control or HOTAIR transfected SF (n = 9) (lower panel). Right panel: quantification of resorption areas in the described conditions. SF: co-culture with synovial fibroblasts (black dots); SN: incubation with supernatant (white dots). Mean +/− standard deviation is shown. Paired t test. Not reported p-values on the figure were not significant.
Fig. 9
Fig. 9. HOTAIR silencing increases lymphocyte chemotaxis.
a The amounts of PBMCs migrating through a transwell system towards conditioned supernatants from synovial fibroblasts (SF) transfected with control GapmeR (GapCTRL) or HOTAIR GapmeR (GapHOTAIR) (n = 10). Mean +/− standard deviation is shown. bd The percentage of (b) CD19, (c) CD14 and (d) CD3 positive cells was measured in PBMCs that had migrated towards supernatants of control or HOTAIR silenced SF (n = 10). Mean +/− standard deviation is shown. Paired t test. eg Expression levels of HOTAIR were measured by qPCR in synovial tissues from rheumatoid arthritis (RA) (black dots) and osteoarthritis (OA) (grey dots) with (e) high (CD20+ score ≥2) (n = 14) or low amounts of CD20 + B cells (n = 14) (mean +/− standard deviation is shown), (f) with high (CD138+ score ≥ 2) (n = 12) or low amounts of CD138+ plasma cells (n = 14) (median and range is shown, Mann–Whitney test), (g) with pauci-immune/fibroid (n = 5), myeloid (n = 4) or lymphoid (n = 6) histological patterns in RA (median and range is shown). h, i Expression levels of HOTAIR in RNA sequencing in synovial tissues from the PEAC cohort according to (h) pauci-immune/fibroid (n = 16), myeloid (n = 18) or lymphoid (n = 43) histological patterns (min max and median are shown) and to (i) CD138 infiltrates. j, k Expression of Hotair was measured by qPCR in C57/BL6 mice (n = 3) (j) in cervical, thoracal and lumbal spine and in (k) different parts of the gut (stomach, small intestine, caecum, colon and rectum). Heatmap of the relative HOTAIR expression according to the localisation are presented. Not reported p-values on the figure were not significant.

References

    1. Global, regional, and national incidence, prevalence, and years lived with disability for 354 diseases and injuries for 195 countries and territories, 1990-2017: a systematic analysis for the Global Burden of Disease Study 2017. Lancet.392, 1789–1858 (2018). - PMC - PubMed
    1. Bijlsma, J. W. J. et al. EULAR textbook on rheumatic diseases. BMJ Publishing Group United Kingdom (2018).
    1. van der Woude D. van der Helm-van Mil AHM. Update on the epidemiology, risk factors, and disease outcomes of rheumatoid arthritis. Best practice & research. Clin. Rheumatol. 2018;32:174–187. - PubMed
    1. Buch MH, Eyre S, McGonagle D. Persistent inflammatory and non-inflammatory mechanisms in refractory rheumatoid arthritis. Nat. Rev. Rheumatol. 2021;17:17–33. doi: 10.1038/s41584-020-00541-7. - DOI - PubMed
    1. Ciurea A, et al. Joint-level responses to tofacitinib and methotrexate: a post hoc analysis of data from ORAL Start. Arthr. Res. Ther. 2023;25:185. doi: 10.1186/s13075-023-03144-1. - DOI - PMC - PubMed

Publication types

MeSH terms

Substances

Associated data