. 2023 Dec 9;14(1):8159.
doi: 10.1038/s41467-023-43795-x.

RAAS-deficient organoids indicate delayed angiogenesis as a possible cause for autosomal recessive renal tubular dysgenesis

Affiliations

RAAS-deficient organoids indicate delayed angiogenesis as a possible cause for autosomal recessive renal tubular dysgenesis

Naomi Pode-Shakked et al. Nat Commun. .

Abstract

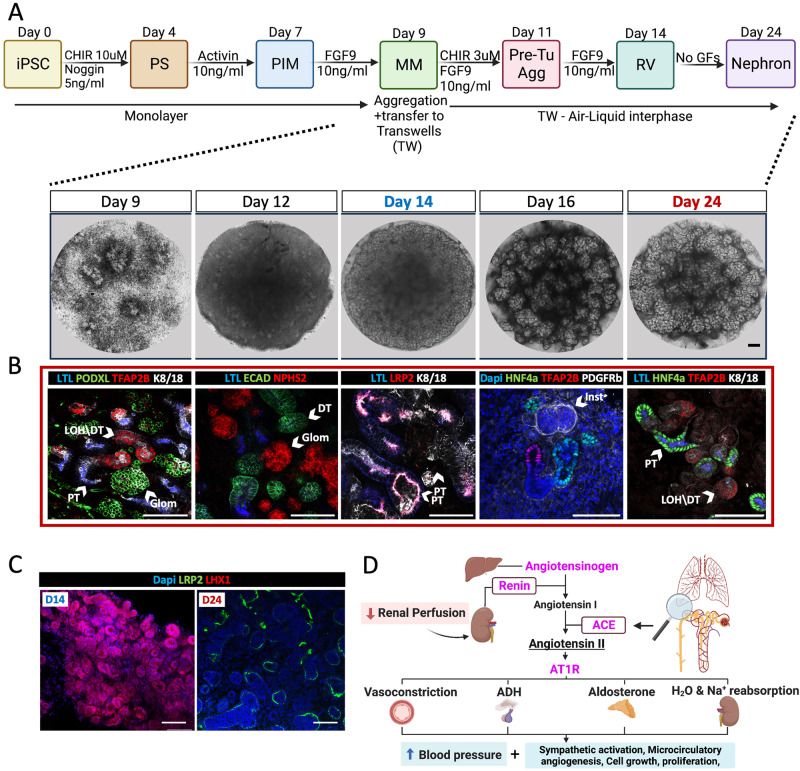
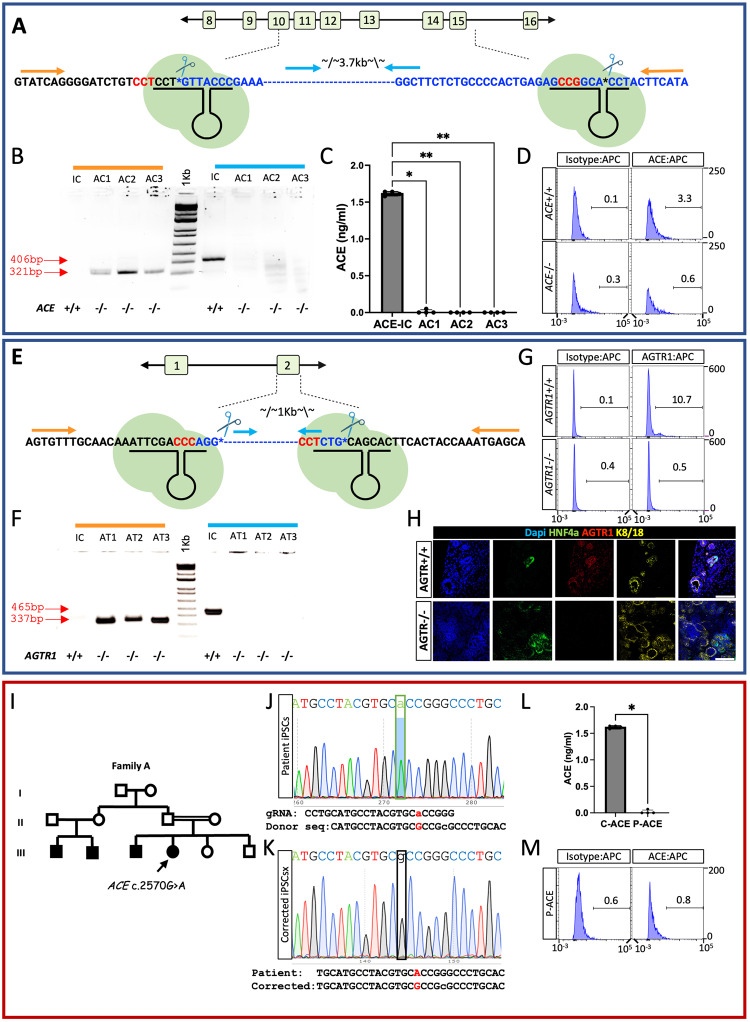
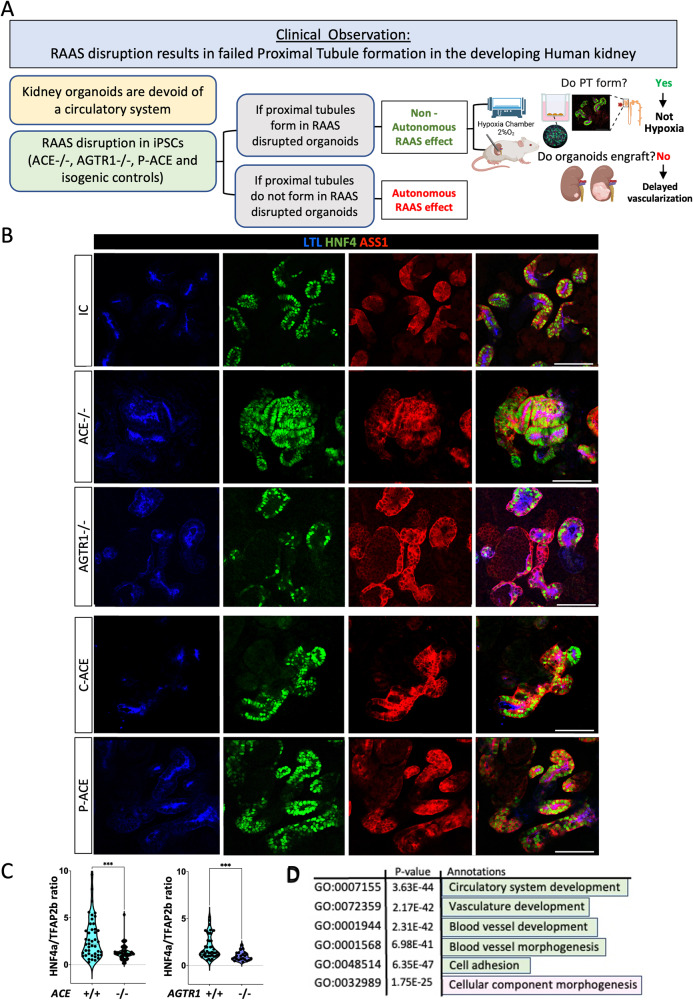
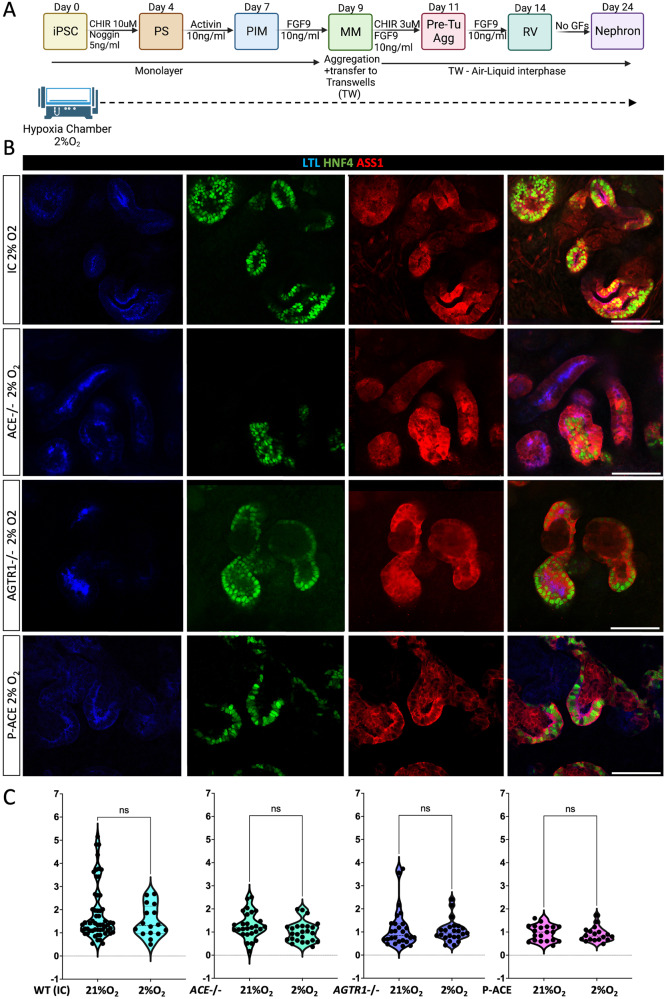
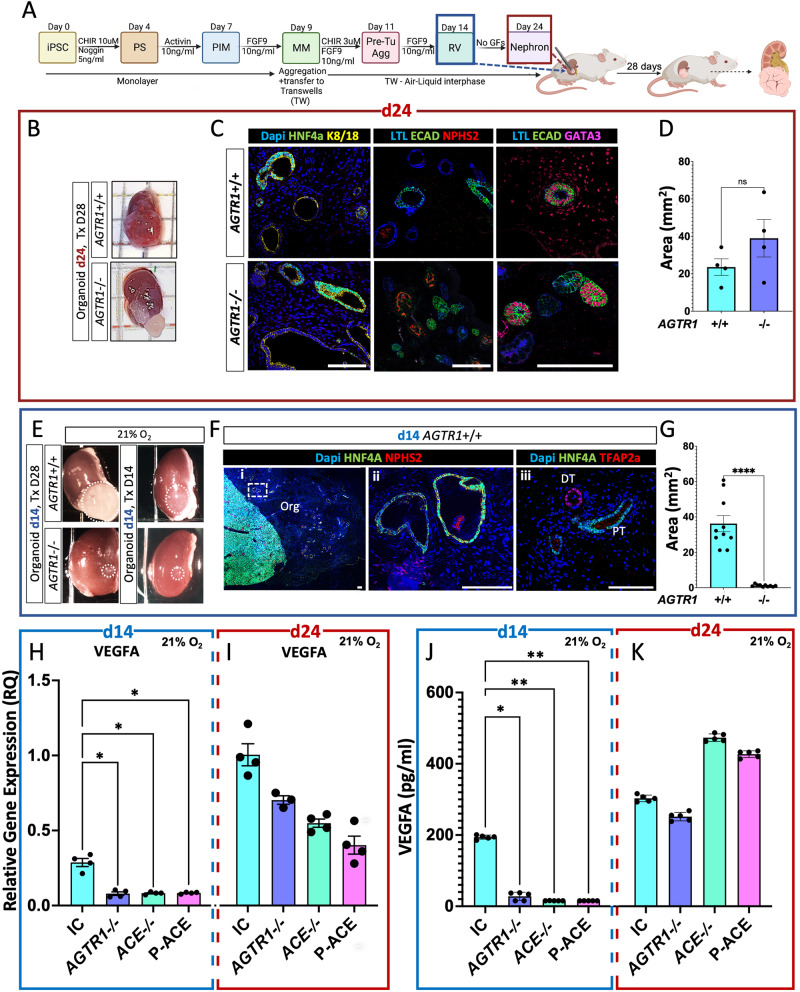
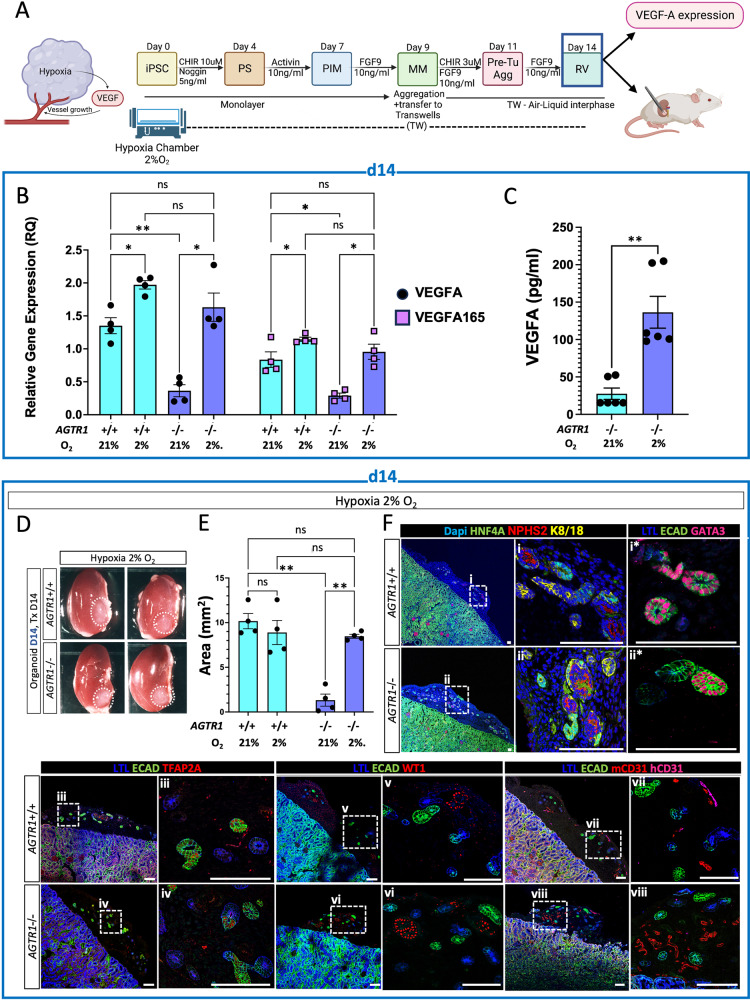
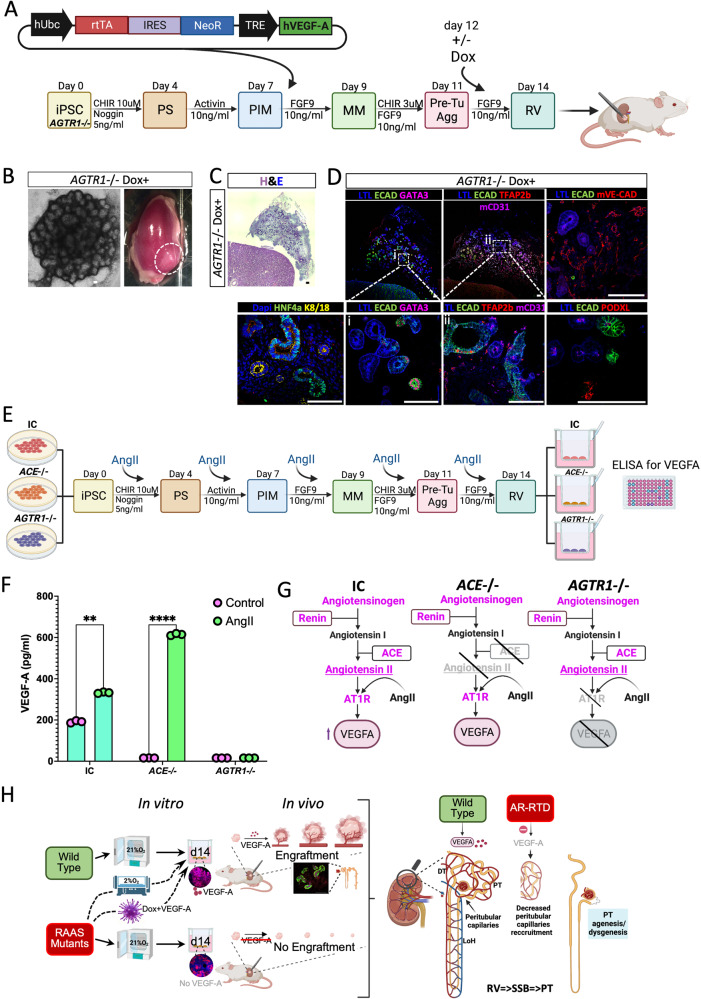
Autosomal Recessive Renal Tubular Dysgenesis (AR-RTD) is a fatal genetic disorder characterized by complete absence or severe depletion of proximal tubules (PT) in patients harboring pathogenic variants in genes involved in the Renin-Angiotensin-Aldosterone System. To uncover the pathomechanism of AR-RTD, differentiation of ACE-/- and AGTR1-/- induced pluripotent stem cells (iPSCs) and AR-RTD patient-derived iPSCs into kidney organoids is leveraged. Comprehensive marker analyses show that both mutant and control organoids generate indistinguishable PT in vitro under normoxic (21% O2) or hypoxic (2% O2) conditions. Fully differentiated (d24) AGTR1-/- and control organoids transplanted under the kidney capsule of immunodeficient mice engraft and mature well, as do renal vesicle stage (d14) control organoids. By contrast, d14 AGTR1-/- organoids fail to engraft due to insufficient pro-angiogenic VEGF-A expression. Notably, growth under hypoxic conditions induces VEGF-A expression and rescues engraftment of AGTR1-/- organoids at d14, as does ectopic expression of VEGF-A. We propose that PT dysgenesis in AR-RTD is primarily a non-autonomous consequence of delayed angiogenesis, starving PT at a critical time in their development.


Conflict of interest statement

The authors declare no competing interests.

Figures

Fig. 1
Fig. 1. iPSC-derived kidney organoids as an experimental model to explore the pathomechanism for in AR-RTD.
A Schematic representation Created with BioRender.com of the protocol used for iPSC-derived kidney organoid generation with representative bright field images of the organoids at days 9, 12, 14, 16, and 24 of differentiation, demonstrating landmarks of the differentiation process. Abbreviations: PS, primitive streak; PIM, posterior intermediate mesoderm; MM, metanephric mesenchyme; RV, renal vesicle. B Immunofluorescence confocal images of iPSC-derived kidney organoids on d24 for different nephron compartments. C Expression of LHX1 and LRP2 in RV stage (d14) and differentiated organoid (d24). D Schema of the canonical Renin-Angiotensin-Aldosterone-System (RAAS) Created with BioRender.com. Proteins encoded by the genes causing AR-RTD in magenta. Enzymes (renin, ACE) are framed. Abbreviations: RV- Renal Vesicle, PT- Proximal Tubules, DT- Distal Tubules, Glom - Glomerulus, LOH - Loop of Henle, LTL- Lotus tetragonolobus lectin, HNF4a - Hepatocyte Nuclear Factor 4α, TFAP2b - Transcription factor AP-2 beta, K8/18 - KRT8/KRT18, PODXL- Podocalyxin, ECAD- E-Cadherin, NPHS2 - Podocin, LRP2- Megalin, LHX1- Lim Homeobox 1, PDGFRβ- Platelet-derived growth factors receptor β. In all images, Scale bars = 100 µm.
Fig. 2
Fig. 2. Generation and characterization of iPSC line with genetically disrupted RAAS.
A Schematic illustrating CRISPR/Cas9 mediated strategy for disrupting the ACE gene by deleting DNA spanning Exons 10 to 15 (upper panel; created in part with BioRender.com), and validation experiments of selected clones. Location of PCR primers (orange and blue lines) used for genotyping is shown. B PCR genotyping of three iPSC ACE-/- clones (AC1-3) and isogenic controls (IC). The orange amplicon is only expected after deletion, the blue amplicon detects the intact ACE locus. 1KiloBase (1 KB) DNA ladder was used, PCR product sizes are shown in the image (red arrows). C ELISA for ACE protein in media from ACE-/- and ACE+/+ iPSC. Results are presented as the mean ± S.E.M of n = 4 biologically independent experiments. Comparisons were performed using a one-way ANOVA on ranks. P-values were adjusted for multiple comparisons using the two-stage step-up method of Benjamini, Krieger and Yekutieli. *p = 0.01, **p = 0.003. D Flow Cytometry analysis for ACE expression in kidney organoids derived from ACE-/- and ACE+/+ iPSC failing to detect ACE protein in ACE-/- lines. E Schematic illustrating CRISPR/Cas9 mediated strategy for disrupting the AGTR1 gene by deleting Exon 2, created in part with BioRender.com. Location of PCR primers (orange and blue lines) used for genotyping (F) is shown. F PCR genotyping of three AGTR-/- clones (AT1-3) and isogenic controls (IC). The orange amplicon is only expected after deletion, the blue amplicon detects the intact AGTR1 locus. 1KiloBase (1 KB) DNA ladder was used, PCR product scale is designated in the image. G Flow Cytometry analysis for AT1R protein expression. H IF staining for AT1R in kidney organoids derived from AGTR1-/- and AGTR1+/+ iPSC. IM Generation and validation of iPSC line from an AR-RTD patient harboring a homozygous pathogenic c.2570 A>G missense mutation in the ACE gene. I The pedigree of the patient’s (marked by an arrow) family shows a brother and two maternal cousins with AR-RTD. When known, consanguinity is noted by a double line. J Sequencing of the ACE gene in the patient-derived iPSC line (P-ACE). K CRISPR/Cas9 correction of the c.2570 A>G missense mutation in P-ACE generating an isogenic control (C-ACE). Donor sequences disrupt the PAM sequence GGG→GcG, both coding for ARG. L ELISA assay for ACE protein expression in P-ACE and control iPSCs media. Results are presented as the mean ± S.E.M of n = 4 biologically independent experiments. Comparison was performed using a two-sided t test. *p = 0.03. M Flow Cytometry analysis for ACE expression in kidney organoids derived from P-ACE iPSCs. Source data for Fig. 2B, C, F and L are provided as a Source Data file.
Fig. 3
Fig. 3. RAAS genes are not required for proximal tubule patterning in iPSC-derived kidney organoids grown under standard conditions.
A Flowchart of hypothesis-based study design; (B) Representative confocal images identifying PT in both mutant (ACE-/-, AGTR1-/-, P-ACE) and their respective ICs (IC, C-ACE) using the PT markers LTL, HNF4a, ASS1; (C) Quantification of PTs in ACE-/- and AGTR1-/- kidney organoids compared to their isogenic controls (IC). Graphs show the mean ratio of HNF4a (PT cells) to TFAP2b (DT cells) in mutant compared to IC organoid. Each dot represents the mean of x4 z-sections per organoid. Quantification was performed on n = 22 ACE-IC, n = 27 ACE-/-, n = 22 AGTR1-IC and n = 23 AGTR1-/- iPSC-derived organoids from n = 4 biologically independent differentiation experiments. Data is presented as mean ± S.E.M; Comparisons were performed using a two-sided t test. ***p<0.0001 for ACE-IC to ACE-/- and p = 0.0003 for AGTR1-IC to AGTR1-/-. D Functional enrichment analysis with ToppFun, depicting the most significant GO terms between batch corrected and differentially expressed ACE-/- and AGTR1-/- genes relative to respective isogenic control iPSC-derived organoids. GO terms significantly decreased (p < 0.05) in both ACE-/- and AGTR1-/- compared to IC are indicated in green, and significantly increased terms in pink (for the statistical method used see Supplemental Data S8). Abbreviations: LTL- Lotus tetragonolobus lectin, HNF4a- Hepatocyte Nuclear Factor 4α, ASS- ArgininoSuccinate Synthetase. TFAP2b- Transcription factor AP-2 beta. ACE-IC=ACE+/+ Isogenic control iPSC clone, AGTR1-IC=AGTR+/+ Isogenic control iPSC clone. Scale bars=100µm. Source data for Fig. 3C is provided as a Source Data file.
Fig. 4
Fig. 4. PT patterning in RAAS deficient kidney organoids is not sensitive to hypoxia.
A Schematic representation of the protocol used to generate kidney organoid in standard condition (21%O2) and in a hypoxia chamber (2%O2), created with BioRender.com. B Representative confocal images PT markers (LTL, HNF4a, and ASS1) in ACE-/, AGTR1-/-, and P-ACE and their respective Isogenic Control (IC) organoids cultured in standard (21%O2) versus hypoxic (2%O2) conditions. Magnification - 40x; scale bars = 100 µm. C Quantification of PT in ACE-/-, AGTR1-/-, and P-ACE and their respective isogenic control organoids grown either in standard (21%O2) or hypoxic (2%O2) conditions. Bar graphs show the mean ratio of HNF4a (PT cells) to TFAP2b (DT cells) positive cells in mutant organoid compared to controls. Each dot represents the mean of x4 z-sections per organoid. Quantification was performed on n = 28 Isogenic Control (IC), n = 27 ACE-/-, n = 27 AGTR1-/-, and n = 23 P-ACE iPSC-derived organoids grown in 21%O2 and n = 16 IC, n = 25 ACE-/-, n = 23 AGTR1-/- and n = 18 P-ACE iPSC-derived organoids grown in 2%O2 from n = 4 biologically independent differentiation experiments. Data is presented as mean ±S.E.M. Comparisons were performed using a two-sided t test. ns = not significant. p = 0.5 for IC 21%O2 vs 2%O2, p = 0.07 for ACE-/- 21%O2 vs 2%O2, p = 0.7 for AGTR1-/- 21%O2 vs 2%O2 and p = 0.67 for P-ACE 21%O2 vs 2%O2. Abbreviations: LTL- Lotus tetragonolobus lectin, HNF4a- Hepatocyte Nuclear Factor 4α, ASS- ArgininoSuccinate Synthetase. TFAP2b- Transcription factor AP-2 beta. P-ACE- AR-RTD patient-derived iPSC line. Source data for Fig. 4C is provided as a Source Data file.
Fig. 5
Fig. 5. Organoid transplantation under the kidney capsule of immunodeficient mice reveals dependence on RAAS and VEGF-A for engraftment.
A Schematic illustration of organoids transplantation under the kidney capsule of immunodeficient mice either at the RV stage (d14, blue frames) or after differentiation (d24, burgundy frames), created with BioRender.com. Organoids were left to grow in vivo for 14 or 28 days prior to retrieval and analysis. B representative images of kidneys with engrafted AGTR1-/- or Isogenic Control (IC) organoids transplanted at day 24. C IF Stained AGTR1-/- and IC explanted organoids contain PT (HNF4a, LTL), podocytes (NPHS2+) and DT (ECAD, GATA3). D Comparison of the mean area of four explanted AGTR1-/- and four IC d24 organoids. Results are presented as mean ± S.E.M from each line. Comparison was performed using a two-sided t test. n s= not significant; p = 0.6. E Representative images of kidneys with transplanted AGTR1-/- or IC d14 organoids. Only IC organoids engrafted. F Comparison of the mean area of 10/22 explanted AGTR1-/- and 10/22 remnants of IC d14 organoids. Results are presented as mean ± S.E.M from each line. Comparison was performed using a two-sided t-test. ****p < 0.0001. G IF images of engrafted IC d14 organoid. Frame (i) contains tiled 10x images showing a section of the engrafted organoid and mouse kidney. Wire frame is enlarged in (ii, 40x magnification). A different engrafted organoid was stained for TFAP2a in frame (iii). Scale bars in all frames = 100 µm. Q-PCR analyses of VEGF-A gene expression in d14 (H) and day 24 (I) isogenic control (IC), AGTR1-/-, ACE-/- and P-ACE iPSC-derived organoids. Results are presented as mean ± S.E.M of n = 4 biologically independent experiments. Comparisons were performed using one-way ANOVA on ranks. P-values were adjusted for multiple comparisons using the two-stage step-up method of Benjamini, Krieger and Yekutieli. *p < 0.03, ELISA assay to detect VEGF-A protein in conditioned media from d14 (J) and day 24 (K) IC, AGTR1-/-, ACE-/- and P-ACE organoids. Results are presented as the mean ± S.E.M of n = 5 biologically independent experiments. Comparisons were performed using one-way ANOVA on ranks. P-values were adjusted for multiple comparisons using the P-values were adjusted for multiple comparisons using the two-stage step-up method of Benjamini, Krieger and Yekutieli. *p = 0.04, **p = 0.003, **p = 0.001. Abbreviations: ECAD- E-Cadherin (CDH1), GATA3- GATA binding protein 3. Scale bars=100µm. Source data for Fig. 5D, F and H-K are provided as a Source Data file.
Fig. 6
Fig. 6. Hypoxia induces VEGF-A expression and rescues engraftment of RV stage AGTR1-/- organoids.
A Schematic illustration of regime used to culture organoids in different oxygen (21% or 2%O2) concentrations prior to analysis of VEGF-A expression and transplantation, created in part with BioRender.com. B Q-PCR analyses of VEGF-A and VEGFA165 gene expression in d14 AGTR1-/- and respective isogenic control (IC) organoids grown either in standard (21%O2) or in hypoxia (2% O2) conditions. Results are presented as mean ± S.E.M of n = 4 biologically independent experiments. Multiple comparisons were performed using a two-way ANOVA. P-values were adjusted for multiple comparisons using the two-stage step-up method of Benjamini, Krieger and Yekutieli. For differences in VEGF-A gene expression: ns = not significant (p > 0.05), *p = 0.04, **p = 0.003 between Isogenic Control (IC) organoids grown in 21%O2 compared to AGTR1-/- organoids grown in 21%O2, and **p = 0.009 for AGTR1-/- organoids grown in 21%O2 compared to AGTR1-/- organoids grown in 2%O2. For differences in VEGFA165 gene expression: ns = not significant (p > 0.05), *p = 0.02 between AGTR1-/- organoids grown in 21%O2 compared to 2%O2, *p = 0.01 between IC organoids grown in 21%O2 compared to AGTR1-/- organoids grown in 21%O2.and *p = 0.04 between IC organoids grown in 21%O2 compared to 2%O2. C ELISA to detect VEGF-A protein in conditioned media from d14 AGTR1-/- organoids grown either in standard (21%O2) or in hypoxic (2% O2) conditions. Results are presented as the mean ±S.E.M of n = 4 biologically independent experiments. Comparison was performed using a two-sided t-test. **p = 0.002. D Representative images of kidneys with engrafted AGTR1-/- or IC d14 organoids grown in hypoxia chamber prior to transplantation. E Comparison of the mean area of four explanted AGTR1-/- and four IC d14 organoids grown under different oxygen concertation prior to transplantation. Results are presented as mean ±S.E.M from each cell line. Multiple comparisons were performed using a two-way ANOVA. P-values were adjusted for multiple comparisons using the two-stage step-up method of Benjamini, Krieger and Yekutieli. ns=not significant (p > 0.05), **p= 0.004 for the difference in area between IC and AGTR1-/- organoids grown in 21%O2 and **p= 0.003 between AGTR1-/- organoids grown in 21%O2 compared to 2%O2. F IF images of engrafted d14 organoids grown under 2%O2. Frames (i-viii) contain tiled 10x images of the engrafted organoid on the left with wireframes enlarged on the right at 40x magnification. Different sections of engrafted organoids were stained in frames (i*, ii*). Scale bars in all frames = 100 µm. Source data for Fig. 6B, C and E are provided as a Source Data file.
Fig. 7
Fig. 7. VEGF-A induction is sufficient to rescue day 14 AGTR1-/- engraftment and AngII induces VEGF-A expression via the AT1R.
All the schematic representations in this figure were created with BioRender.com. A Schematic illustration: AGTR1-/- iPSCs were differentiated into kidney organoids and on day 7 of the differentiation protocol growing as a monolayer were transiently transduced with a lentivirus encoding a doxycycline (dox)-inducible hVEGF-A construct. Following aggregation (day 9), on day 12 and 13 of differentiation, organoids were treated with dox and transplanted under the kidney capsule of immunodeficient mice at day 14 (RV). B A representative bright field image of a Day 14 AGTR1-/- organoid exposed to Dox prior to transplantation under the kidney capsule of immunodeficient mice (left); and a representative image of a harvested kidney with engrafted day 14 Dox-treated AGTR1-/- organoid (right). C A representative Hematoxylin and Eosin (H&E) image of an explanted organoid showing kidney structures in the organoid 14 days after transplantation. D Immunofluorescence images of engrafted Dox-induced AGTR1-/- organoids. Wireframes are enlarged in (i, ii) at 40x magnification, sections from a different engrafted organoid are shown in the other frames. E Schematic representation of the experimental design for treatment of IC, ACE-/- and AGTR1-/- iPSC-derived organoids with 100 nM of AngII during differentiation until day 14, when media is collected and analyzed via an ELISA assay for secretion of VEGF-A. F Quantification of VEGF-A protein secretion in conditioned media of day 14 organoids derived from IC, ACE-/- or AGTR1-/- iPSCs either treated with 100 nM of AngII (AngII) or untreated (control). Results are presented as the mean ±S.E.M of n = 3 biologically independent experiments. Comparisons were performed using two-ways ANOVA. **p = 0.001, ****p < 0.0001. G Graphic summary of VEGF-A induction by AngII. H Graphic summary of our AGTR-/- engraftment rescue with pretreatment with hypoxia or VEGF-A, followed by schematic of hypothetical pathomechanism leading to PT paucity in RTD: delayed vasculogenesis with resultant nutrient deprivation impacts a critical time for PT development (RV =>SSB=>PT). Abbreviations: IC (Isogenic control), Dox- Doxycycline, AT1R- Angiotensin II receptor type 1 (protein), RV- Renal Vesicle, SSB- S-shaped bodies. Scale bar in all frames =100 µm. Source data for Fig. 7A are provided as a Source Data file.

References

    1. Lindstrom NO, et al. Integrated beta-catenin, BMP, PTEN, and Notch signalling patterns the nephron. eLife. 2015;3:e04000. doi: 10.7554/eLife.04000. - DOI - PMC - PubMed
    1. Lindstrom NO, et al. Spatial transcriptional mapping of the human nephrogenic program. Dev. Cell. 2021;56:2381–2398.e2386. doi: 10.1016/j.devcel.2021.07.017. - DOI - PMC - PubMed
    1. Costantini F, Kopan R. Patterning a complex organ: branching morphogenesis and nephron segmentation in kidney development. Dev. Cell. 2010;18:698–712. doi: 10.1016/j.devcel.2010.04.008. - DOI - PMC - PubMed
    1. Rymer C, et al. Renal blood flow and oxygenation drive nephron progenitor differentiation. Am. J. Physiol. Ren. Physiol. 2014;307:F337–345. doi: 10.1152/ajprenal.00208.2014. - DOI - PMC - PubMed
    1. Takasato M, et al. Kidney organoids from human iPS cells contain multiple lineages and model human nephrogenesis. Nature. 2016;536:238. doi: 10.1038/nature17982. - DOI - PubMed

Publication types

Substances

Supplementary concepts

Associated data