. 2023 Dec 9;14(1):8158.
doi: 10.1038/s41467-023-43976-8.

The NERP-4-SNAT2 axis regulates pancreatic β-cell maintenance and function

Affiliations

The NERP-4-SNAT2 axis regulates pancreatic β-cell maintenance and function

Weidong Zhang et al. Nat Commun. .

Abstract

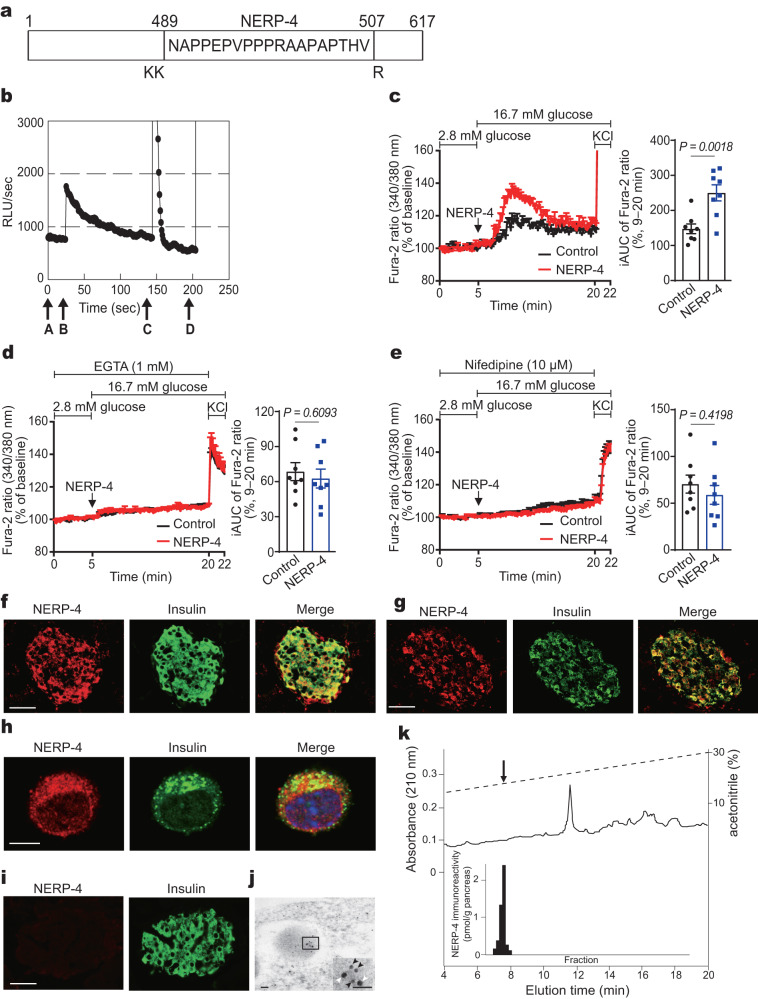
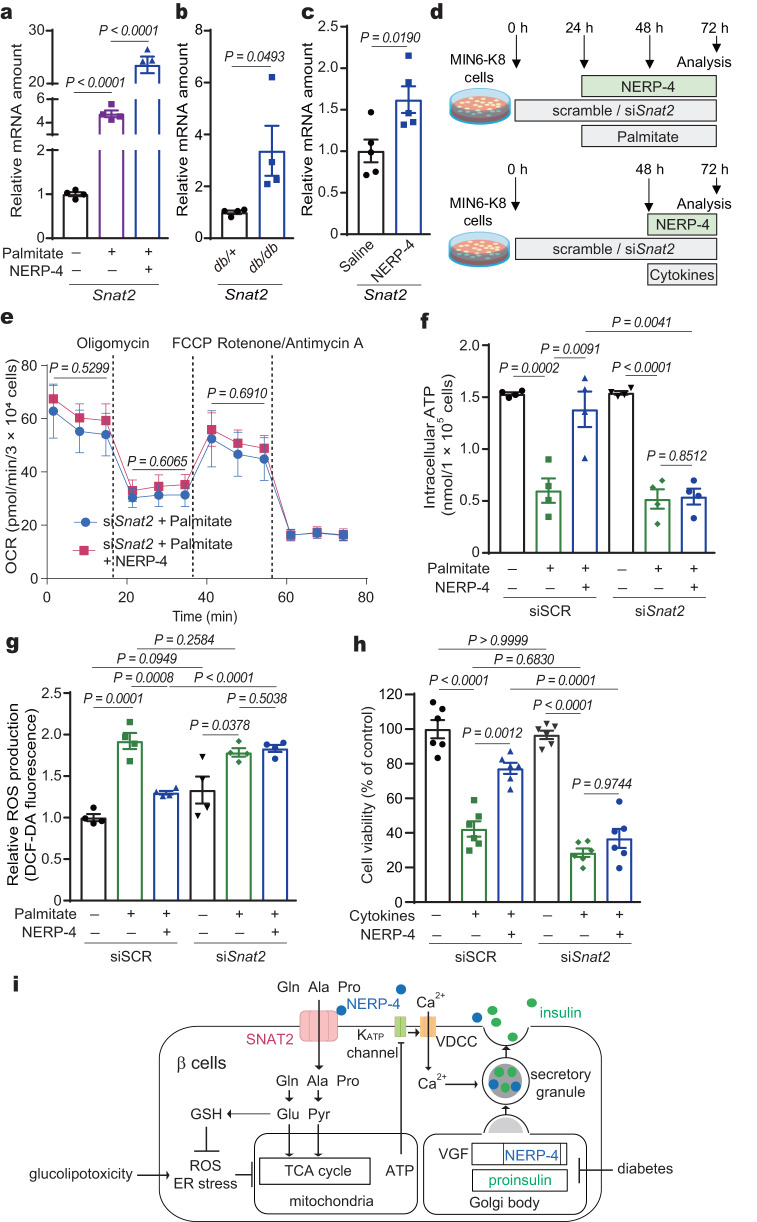
Insulin secretion from pancreatic β cells is regulated by multiple stimuli, including nutrients, hormones, neuronal inputs, and local signalling. Amino acids modulate insulin secretion via amino acid transporters expressed on β cells. The granin protein VGF has dual roles in β cells: regulating secretory granule formation and functioning as a multiple peptide precursor. A VGF-derived peptide, neuroendocrine regulatory peptide-4 (NERP-4), increases Ca2+ influx in the pancreata of transgenic mice expressing apoaequorin, a Ca2+-induced bioluminescent protein complex. NERP-4 enhances glucose-stimulated insulin secretion from isolated human and mouse islets and β-cell-derived MIN6-K8 cells. NERP-4 administration reverses the impairment of β-cell maintenance and function in db/db mice by enhancing mitochondrial function and reducing metabolic stress. NERP-4 acts on sodium-coupled neutral amino acid transporter 2 (SNAT2), thereby increasing glutamine, alanine, and proline uptake into β cells and stimulating insulin secretion. SNAT2 deletion and inhibition abolish the protective effects of NERP-4 on β-cell maintenance. These findings demonstrate a novel autocrine mechanism of β-cell maintenance and function that is mediated by the peptide-amino acid transporter axis.


Conflict of interest statement

The authors declare no competing interests.

Figures

Fig. 1
Fig. 1. NERP-4 induces intracellular Ca2+ mobilisation.
a NERP-4 sequence in mouse VGF. NERP-4 is cleaved from VGF after a basic pair (lysine–lysine: KK) and before a single basic amino acid (arginine: R). b Representative profile of the relative luminescence evoked in the apoaequorin transgenic mouse pancreas. Arrows (A–D) represent the tested substances. Medium (A), 1 μM NERP-4 (B), 100 μM ATP (C), and 2.5% Triton X-100 (D) were administered before the time indicated by the corresponding arrow. ATP was used as a positive control. ce Representative Fura-2-AM ratios in MIN6-K8 cells in response to NERP-4 with or without EGTA or nifedipine treatment (n = 8 cells), and average incremental AUC (iAUC) (9–20 min) of [Ca2+]i (n = 8 cells). Representative immunofluorescence images of NERP-4, insulin, and their merged images in C57BL/6 J mouse islet (f), rat islet (g), MIN6-K8 cell (h), and Vgf KO mouse islet (i). j A representative immunoelectron micrograph showing co-localisation of NERP-4 with insulin in C57BL/6 J mouse islets. Inset is a higher-magnification image (NERP-4: 5-nm gold particles; black arrowheads: insulin; 10-nm gold particles: white arrowheads). k RP-HPLC of immunoreactive NERP-4 extracted from human pancreas. The arrow indicates the elution position of synthetic human NERP-4. Results are representative of three (ce) or two (fj) independent experiments. Data are mean ± s.e.m (ce). Unpaired two-tailed Student’s t-test (ce). Scale bars, 50 μm (f, g, i), 5 μm (h), 50 nm (j). Source data are provided as a Source data file.
Fig. 2
Fig. 2. NERP-4 induces insulin secretion.
NERP-4 enhances GSIS in human islets (a, n = 5, 5, 6 biological replicates), islets from male (b, n = 13, 9, 13, 14 biological replicates) and female (c, n = 6, 6, 8, 8 biological replicates) C57BL/6 J mice, and MIN6-K8 cells (d, n = 4, 4, 5, 5 biological replicates). e ATP production in MIN6-K8 cells (n = 6 biological replicates). f Intracellular cAMP level in MIN6-K8 cells incubated with NERP-4 (n = 7 biological replicates). GSIS from MIN6-K8 cells treated with EGTA (g) or nifedipine (h) (n = 4 biological replicates). Glucose-induced secretion of NERP-4 (i) and insulin (j) from MIN6-K8 cells (n = 3 biological replicates). k Anti–NERP-4 IgG suppression of insulin secretion in C57BL/6 J mouse islets (n = 8 biological replicates). Results are pooled from three (b) or two (c, e, f, k) independent experiments, or are representative of three (a, d) or two (gj) independent experiments. Data are mean ± s.e.m (ak). One-way ANOVA and Tukey’s multiple comparisons test (ah, k). Unpaired two-tailed Student’s t-test (i, j). Source data are provided as a Source data file.
Fig. 3
Fig. 3. NERP-4 reverses palmitate-induced β-cell dysfunction and NERP-4 IgG induces β-cell dysfunction in mouse islets.
a NERP-4 was administered at 0, 24, and 48 h to isolated C57BL/6 J mouse islets under palmitate. b GSIS from C57BL/6 J mouse islets (n = 5 biological replicates). ce Ins1, Ins2, and Vgf mRNA amounts (n = 4 biological replicates). f Protein levels of CHOP and SOD2 (n = 3 biological replicates). g Nrf2 protein levels in nuclear and cytosolic fractions (n = 3 biological replicates). hm C57BL/6 J mouse islets treated for 72 h with NRS IgG or NERP-4 IgG. h GSIS from C57BL/6 J mouse islets (n = 5 biological replicates). im Ins1, Ins2, Sod2, Nrf2, and Chop mRNA amounts (n = 3 biological replicates). Representative results of two independent experiments (bm). Data are mean ± s.e.m (bm). One-way ANOVA and Tukey’s multiple comparisons test (bg). Unpaired two-tailed Student’s t-test (hm). Source data are provided as a Source data file.
Fig. 4
Fig. 4. NERP-4 reverses palmitate- or cytokine-induced β-cell dysfunction in MIN6-K8 cells.
a NERP-4 was administered at 0 and 24 h to MIN6-K8 cells under palmitate (bg) or at 0 h under cytokines (hk). b OCR analyses of MIN6-K8 cells (n = 3 biological replicates). The P values indicated the differences of basal respiration (1.6–14.8 min), ATP production (21.4–34.6 min), and maximal respiration (41.2–54.4 min) in palmitate-treated MIN6-K8 cells with or without NERP-4. c ATP production in MIN6-K8 cells treated with or without palmitate and NERP-4 (n = 6 biological replicates). Atp5e (d), Atp5j2 (e), and Vgf (f) mRNA amounts in MIN6-K8 cells (n = 4 biological replicates). g ROS production in MIN6-K8 cells (n = 3 biological replicates). hk MIN6-K8 cells were treated with a cytokine cocktail and NERP-4 for 24 h. h Protein level of cleaved caspase-3 (n = 3 biological replicates). i GSIS from MIN6-K8 cells (n = 4 biological replicates). j Cell viability (n = 6, 6, 5, 4 biological replicates). k Representative TUNEL images and per cent ratio of TUNEL-positive cells (green) to DAPI-positive cells (blue) (n = 5 independent samples). Representative results of two independent experiments (bk). Data are mean ± s.e.m. (bk). Unpaired two-tailed Student’s t-test (b). One-way ANOVA and Tukey’s multiple comparisons test (ck). Scale bar, 100 μm (k). Source data are provided as a Source data file.
Fig. 5
Fig. 5. NERP-4 is reduced in db/db mice.
a Representative NERP-4 (red) and insulin (green) immunoreactivities in pancreatic islets of 15-week-old db/+ or db/db mice (n = 3 biological animals). b Relative fluorescence intensity of insulin or NERP-4 in pancreatic islets of 15-week-old db/+ mice (11 islets from three mice) or db/db mice (25 islets from three mice). c Vgf, Ins1, and Ins2 mRNA amounts in islets of 10-week-old db/+ mice and db/db mice (n = 4 biological animals). Data are mean ± s.e.m. Unpaired two-tailed Student’s t-test (b, c). Scale bar, 50 μm (a). Source data are provided as a Source data file.
Fig. 6
Fig. 6. NERP-4 administration reverses β-cell impairment in db/db mice.
a Daily administration of NERP-4 or saline for 14 days to db/db mice. Blood was collected on Days 0, 7, and 14. GTT and ITT were performed on Day 14. b Changes in blood glucose and plasma insulin concentrations (n = 28, 27 biological animals). c, d Blood glucose and plasma insulin concentrations and their areas under the curves (AUCs) in an intraperitoneal GTT (n = 7, 5 biological animals). e Representative TEM micrograph of β cells. f Number of insulin storage granules (n = 6, 8 biological replicates). Box plots show the diameters of insulin storage granules (saline, n = 448; NERP-4, n = 790). gk Ins1, Ins2, Iapp, Vgf, and Pdx-1 mRNA amounts in pancreatic islets (n = 5 biological replicates). l Insulin content (n = 10 biological replicates). m Representative images of Ki67-positive cells (red) and insulin (green). n Number of Ki67-positive cells per islet (n = 3; saline, 145 islets from three mice and NERP-4, 147 islets from three mice). o Insulin intensity (saline, 78 islets from five mice and NERP-4, 69 islets from five mice). Results are pooled from four (b) or two (c, d, l) independent experiments or are representative of two independent experiments (ek, mo). Data are mean ± s.e.m (bd, fk, n). Centre line, median; box edges, first and third quartiles; whiskers, 1.5 times the interquartile range; outliers, individual points (f, l, o). Two-way ANOVA followed by Bonferroni’s post-test for multiple comparisons (bd). Unpaired two-tailed Student’s t-test (fl, n, o), Scale bars, 1 μm (e), 50 μm (m). Source data are provided as a Source data file.
Fig. 7
Fig. 7. NERP-4 administration reverses mitochondrial dynamics in the islets of db/db mice.
a Representative TEM images of mitochondria in β cells. Organelles surrounded by single or double membranes represent mitophagic vacuoles containing mitophagosomes (yellow arrows). Box plots displaying mitochondrial number (b) and size (c) (saline, 386 mitochondria from three mice and NERP-4, 417 mitochondria from three mice). d Quantification of the number of mitophagic vacuoles (12 cells from five mice). e Pgc1α, Drp1, Mfn1, Park2, and Pink1 mRNA amounts in pancreatic islets (n = 5 biological replicates). f Protein levels of CHOP and SOD2 (n = 4 biological replicates). Representative results of three (e) or two (f) independent experiments. Data are mean ± s.e.m (df). Centre line, median; box edges, first and third quartiles; whiskers, 1.5 times the interquartile range; outliers, individual points (bc). Unpaired two-tailed Student’s t-test (bf). Scale bar, 1 μm (a). Source data are provided as a Source data file.
Fig. 8
Fig. 8. SNAT2 is a target protein candidate for NERP-4.
a Volcano plot depicting a comparison of proteins captured by NERP-4 or NERP-2. Data are shown at the protein level and are annotated using the UniProt mouse database. Y-axis = −Log10 (adjusted P value), X-axis = Log2 fold change compared to the other samples (n = 3 independent experiments). b Target candidates identified by the TriCEPS™-based ligand–receptor capture method. SCRB2: lysosome membrane protein 2. c Binding of [125I]-Y-NERP-4[8–19] to the membrane of SNAT2-OE HEK293 cells with or without unlabelled NERP-4 (n = 4 biological replicates). d Binding of [125I]-Y-NERP-4[8–19] with or without unlabelled NERP-4 in SNAT2-overexpressing (OE) HEK293 cells (n = 4 biological replicates). e mRNA levels of Snat1, Snat2, Snat3, Snat4, and Snat5 in C57BL/6 J mouse islets and MIN6-K8 cells (n = 5 biological replicates). f Binding of [125I]-Y-NERP-4[8–19] to mock, SNAT2-, SNAT3-, SNAT4-, or SNAT5-OE HEK293 cells (n = 3 biological replicates). Representative results of two independent experiments (cf). Data are mean ± s.e.m (cf). Differential protein abundance was tested using a statistical ANOVA model followed by multiple testing corrections (a, b). One-way ANOVA and Fisher’s LSD test, #P value, SNAT2 OE vs. SNAT2 OE plus unlabelled NERP-4; *P value, SNAT2 OE vs. mock (c). One-way ANOVA and Tukey’s multiple comparisons test (d, e). Two-way ANOVA and Tukey’s multiple comparisons test, *P = 0.0444, **P = 0.0051, ***P < 0.0001 vs. mock; not significant, SNAT3/SNAT4/SNAT5 vs. mock (f). Source data are provided as a Source data file.
Fig. 9
Fig. 9. NERP-4 stimulates glutamine and alanine uptake into β cells via SNAT2.
NERP-4–induced [14C]-l-glutamine uptake into human islets (a, n = 4 biological replicates), C57BL/6 J mouse islets (b, n = 6, 5 biological replicates), and MIN6-K8 cells (c, n = 4 biological replicates). d [14C]-l-Alanine uptake into MIN6-K8 cells (n = 4 biological replicates). [14C]-l-Glutamine (e) and [14C]-l-alanine (f) uptake in siSnat2-MIN6-K8 cells (n = 4 biological replicates). [14C]-l-Glutamine (g) and [14C]-l-alanine (h) uptake by MIN6-K8 cells with or without NERP-4 and MeAIB (n = 4 biological replicates). i Representative Fura-2-AM ratios in siSnat2–MIN6-K8 cells in response to NERP-4 (n = 8 cells), and average iAUC (9–20 min) of [Ca2+]i (n = 8 cells). Effects of Snat2 knockdown (j, n = 6 biological replicates) and MeAIB (k, n = 8 biological replicates) on NERP-4–induced GSIS in MIN6-K8 cells. Effect of MeAIB on NERP-4–induced GSIS in human islets (l, n = 5 biological replicates) and C57BL/6 J mouse islets (m, n = 6 biological replicates). n Concentration dependence of MeAIB uptake into MIN6-K8 cells in the presence or absence of NERP-4 (n = 4 biological replicates). Inset shows 1 or 10 μM MeAIB uptake. All experiments were performed under 16.7 mM glucose. Representative results of two independent experiments (bn). Data are mean ± s.e.m (an). One-way ANOVA and Tukey’s multiple comparisons test (a, c, eh, jn). Unpaired two-tailed Student’s t-test (b, d, i). Source data are provided as a Source data file.
Fig. 10
Fig. 10. NERP-4 reverses β-cell impairment via SNAT2.
a, Snat2 mRNA amounts in mouse islets under palmitate treatment with or without NERP-4 (n = 4 biological replicates). b Snat2 mRNA amounts in 10-week-old db/+ mouse and db/db mouse islets (n = 4 biological animals). c Snat2 mRNA amounts in islets from db/db mice administered NERP-4 for two weeks (n = 5 biological replicates). d NERP-4 was administered at 24 and 48 h after the start of siSCR treatment or Snat2 knockdown to MIN6-K8 cells under palmitate (eg) or at 48 h under cytokines (h). e OCR (n = 3 biological replicates). The P values indicated the differences of basal respiration (1.6–14.8 min), ATP production (21.4–34.6 min), and maximal respiration (41.2–54.4 min) in palmitate-treated siSnat2-MIN6-K8 cells with or without NERP-4. f ATP production (n = 4 biological replicates). g ROS production (n = 4 biological replicates). h Cell viability (n = 6 biological replicates). Representative results of two independent experiments (ac, eh). Data are mean ± s.e.m. (ac, eh). One-way ANOVA and Tukey’s multiple comparisons test (a, eh). Unpaired two-tailed Student’s t-test (b, c). i Schematic of NERP-4 roles in pancreatic β cells. NERP-4 is processed from VGF, a granin protein that is critical for granule biogenesis in pancreatic β cells. NERP-4 is packed with insulin in secretory granules and secreted by glucose. NERP-4 binds to SNAT2 to stimulate amino acid uptake into β cells, thereby enhancing mitochondrial ATP production, glucose-induced Ca2+ mobilisation into β cells, and GSIS. NERP-4 expression is reduced in β cells in db/db mice. NERP-4 protects β cells from glucolipotoxicity by reducing ROS production and ER stress, thereby enhancing mitochondrial biogenesis and dynamics. Source data are provided as a Source data file.

References

    1. Gutiérrez-Preciado A, Romero H, Peimbert M. An evolutionary perspective on amino acids. Nat. Educ. 2010;3:29.
    1. Newsholme P, Bender K, Kiely A, Brennan L. Amino acid metabolism, insulin secretion and diabetes. Biochem. Soc. Trans. 2007;35:1180–1186. doi: 10.1042/BST0351180. - DOI - PubMed
    1. Kandasamy P, Gyimesi G, Kanai Y, Hediger MA. Amino acid transporters revisited: new views in health and disease. Trends Biochem. Sci. 2018;43:752–789. doi: 10.1016/j.tibs.2018.05.003. - DOI - PubMed
    1. Javed K, Fairweather SJ. Amino acid transporters in the regulation of insulin secretion and signalling. Biochem. Soc. Trans. 2019;47:571–590. doi: 10.1042/BST20180250. - DOI - PubMed
    1. Bröer S. Amino acid transporters as modulators of glucose homeostasis. Trends Endocrinol. Metab. 2022;33:120–135. doi: 10.1016/j.tem.2021.11.004. - DOI - PubMed

Publication types