. 2023 Dec 9;14(1):8170.
doi: 10.1038/s41467-023-43991-9.

Single cell multi-omics reveal intra-cell-line heterogeneity across human cancer cell lines

Affiliations

Single cell multi-omics reveal intra-cell-line heterogeneity across human cancer cell lines

Qionghua Zhu et al. Nat Commun. .

Abstract

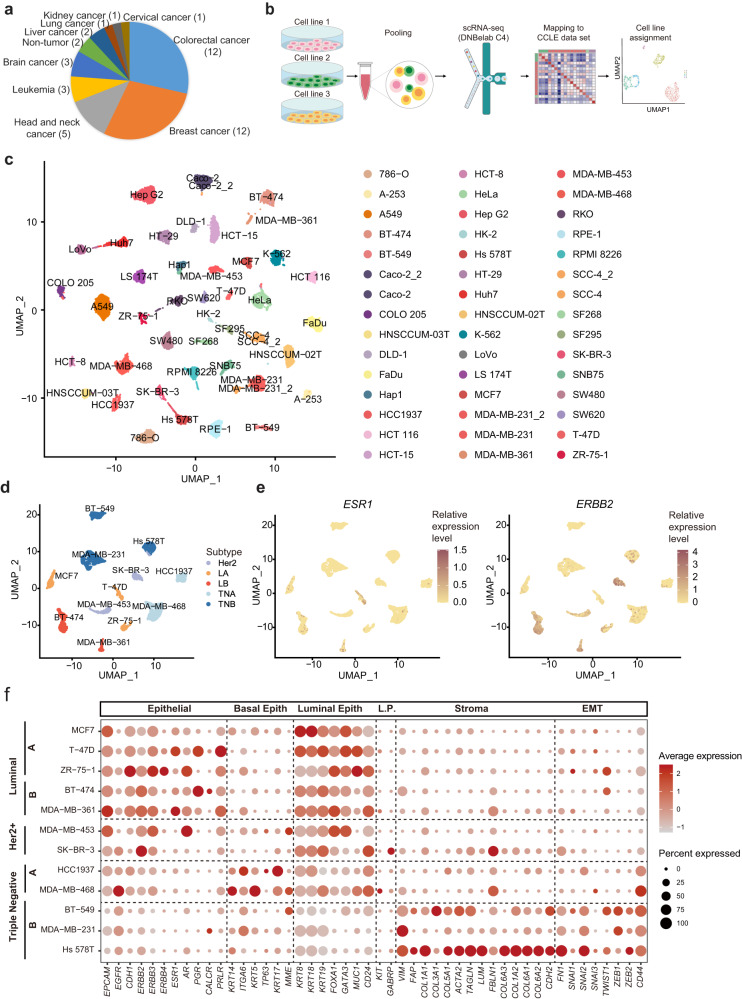
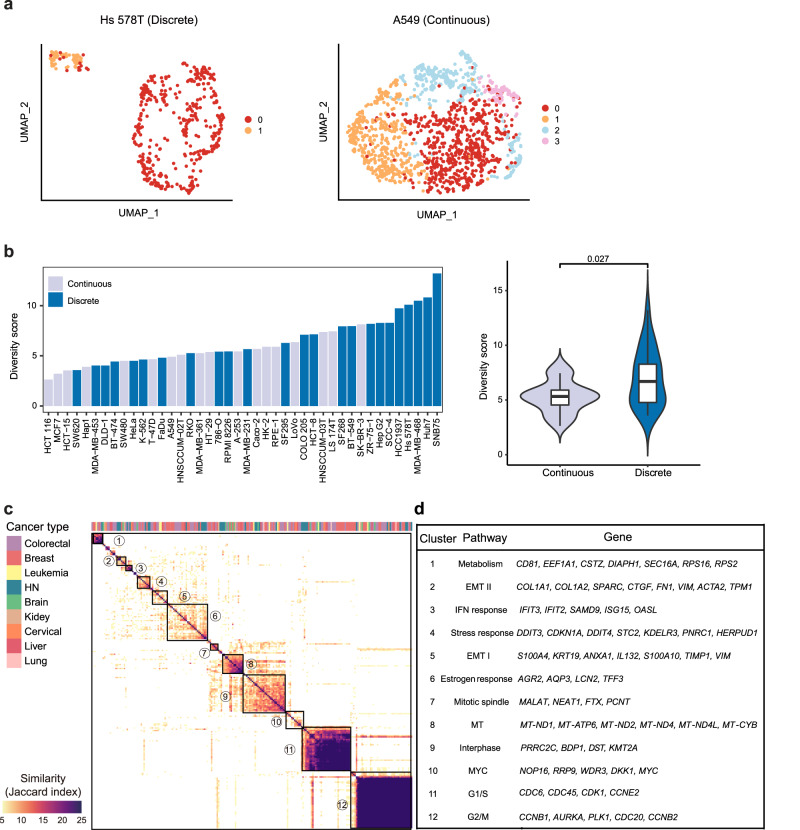
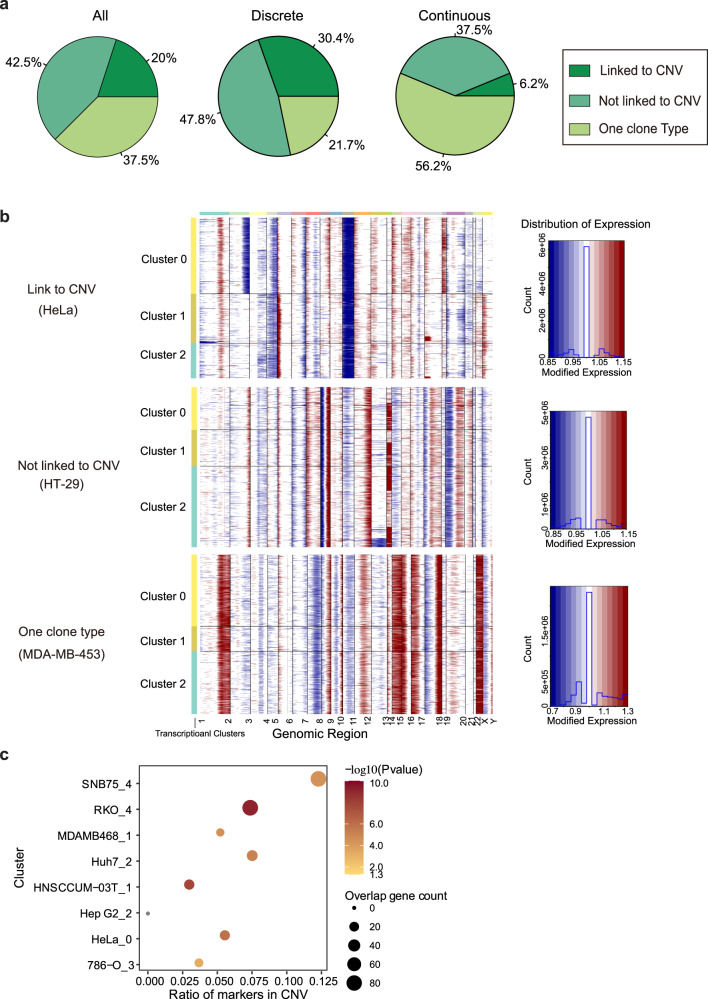
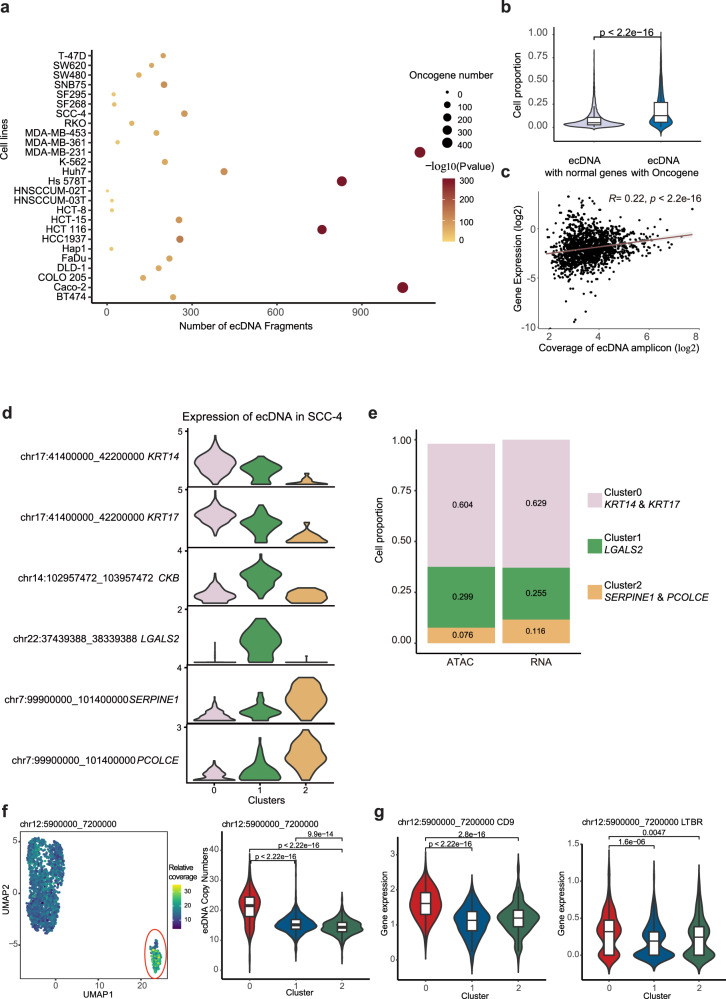
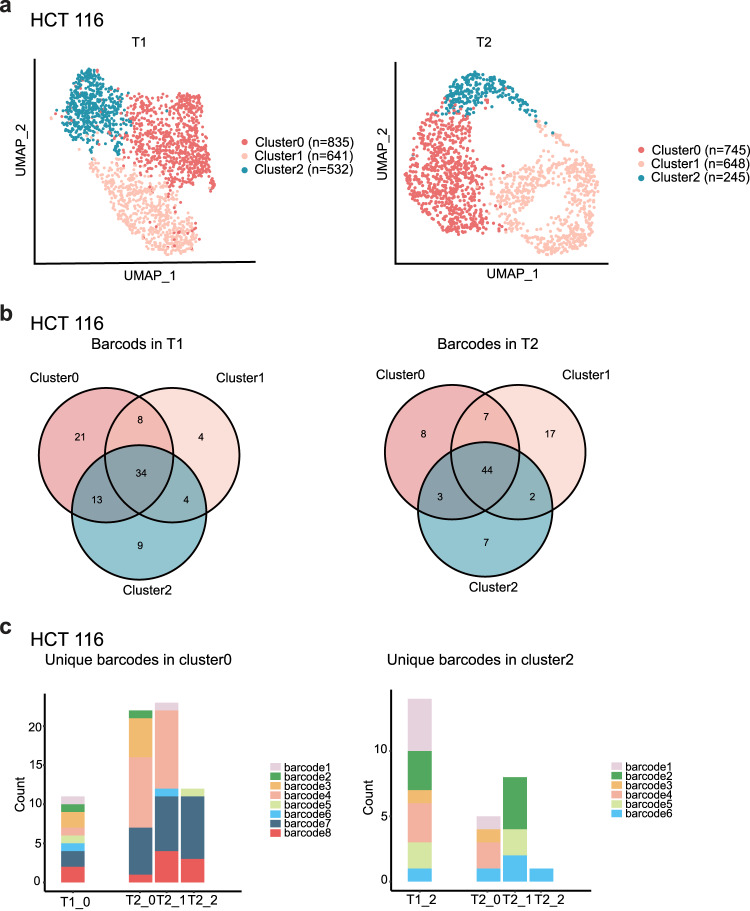
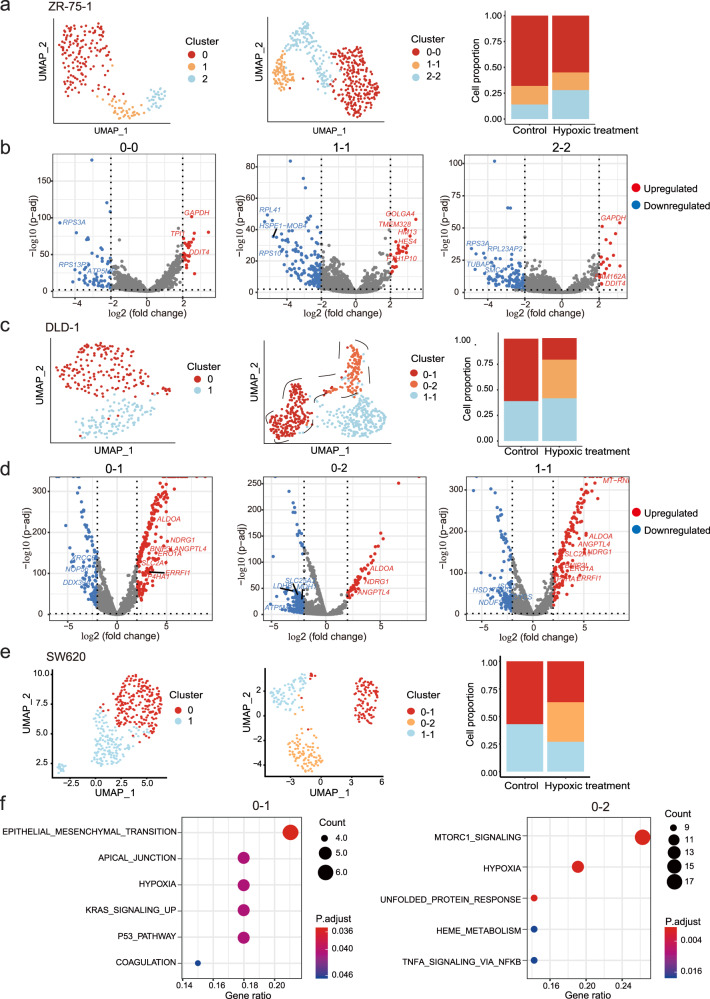
Human cancer cell lines have long served as tools for cancer research and drug discovery, but the presence and the source of intra-cell-line heterogeneity remain elusive. Here, we perform single-cell RNA-sequencing and ATAC-sequencing on 42 and 39 human cell lines, respectively, to illustrate both transcriptomic and epigenetic heterogeneity within individual cell lines. Our data reveal that transcriptomic heterogeneity is frequently observed in cancer cell lines of different tissue origins, often driven by multiple common transcriptional programs. Copy number variation, as well as epigenetic variation and extrachromosomal DNA distribution all contribute to the detected intra-cell-line heterogeneity. Using hypoxia treatment as an example, we demonstrate that transcriptomic heterogeneity could be reshaped by environmental stress. Overall, our study performs single-cell multi-omics of commonly used human cancer cell lines and offers mechanistic insights into the intra-cell-line heterogeneity and its dynamics, which would serve as an important resource for future cancer cell line-based studies.


Conflict of interest statement

The authors declare no competing interests.

Figures

Fig. 1
Fig. 1. Characterizing cellular heterogeneity within cell lines by scRNA-seq.
a Quantitative scRNA-seq analysis of 42 diverse cell lines from 9 lineages. The cell line number of each lineage is indicated. b Schematic of the experimental workflow of scRNA-seq analysis. Three cell lines were pooled for scRNA-seq and then data from Harmonizome was utilized to assign cells to the most similar one based on their gene expression profile. c UMAP plot of all cell lines demonstrating the robustness of cell line assignment. Different cell lines were labeled in different colors. d Graphical representation of single-cell transcriptomics of breast cancer cell lines according to cancer subtype labeled in different colors. e Normalized expression levels of indicated biomarker genes (ESR1 and ERBB2) in individual cells, with redness indicating expression level. f Bubble plot represents the average expression levels of marker genes and fractions of expressed cells in breast cancer cell lines. Basal Epith = Basal Epithelial, Luminal Epith = Luminal Epithelial, L.P. = Luminal Progenitor, EMT = Epithelial to Mesenchymal Transformation. Source data are provided in the Source Data file.
Fig. 2
Fig. 2. Different patterns of transcriptome heterogeneity within cell lines.
a Illustration of two types of transcriptional heterogeneity: continuous vs discrete; UMAP plot showing exemplary cell lines for different patterns: Hs 578T for discrete and A549 for continuous. b Diversity scores for different cell lines, cell lines with light blue indicating continuous pattern and cell lines with dark blue indicating discrete pattern. A violin plot depicted the diversity score of the cell lines with the two patterns, including continuous (n = 18 cell lines) and discrete (n = 24 cell lines). For each boxplot, the center line represents the median, the box indicates the upper and lower quartiles and the whisker represents 1.5-fold of the interquartile range. A one-sided Wilcoxon test was used to test the statistical significance (p-value = 0.021). c The main heatmap depicts pairwise similarities between all NMF programs, quantified by Jaccard Index over the programs’ genes, ordered by hierarchical clustering. Twelve clusters are indicated by squares and numbers. d Annotation and selected top marker genes were shown for each cluster. Source data are provided in the Source Data file.
Fig. 3
Fig. 3. Characterizing the heterogeneity of chromatin accessibility within cell lines by scATAC-seq.
a Schema of the experimental workflow of scATAC-seq analysis. Cell lines were pooled for scATAC-seq and then differential genes were utilized to assign cells to the most similar cell line based on the gene score calculated according to their chromatin accessibility. b UMAP representation of all cell lines’ scATAC profile. Different cell lines were labeled in different colors. c UMAP plot illustration of two types of expression variability: with (differential, MDA-MB-231 and SF268) or without (indiscriminate, COLO 205) distinct chromatin accessibility. d Diversity scores for different cell lines. Cell lines with light blue indicate an indiscriminate pattern and cell lines with red indicate a differential pattern. e A violin plot depicted the diversity score of the cell lines with the two patterns, including differential (n = 15 cell lines) and indiscriminate (n = 25 cell lines). For each boxplot, the center line represents the median, the box indicates the upper and lower quartiles and the whisker represents 1.5-fold of the interquartile range. A one-sided Wilcoxon test was used to test the statistical significance (p-value = 0.045). Source data are provided in the Source Data file.
Fig. 4
Fig. 4. Assessing the role of CNVs in cellular transcriptomic heterogeneity.
a Percentage of cell lines whose transcriptomic subclusters are associated or not associated with CNV subclones in all cell lines (left), discrete pattern cell lines (middle), and continuous pattern cell lines (right), respectively. b Representative cell lines with or without the association between transcriptomic subclusters and CNV-based subclones: CNV subclone, identified by chromosomes 2, 5 and 18, is linked to transcriptomic subcluster (upper, HeLa,); CNV subclones, identified by chromosome 13, are not linked to transcriptional subclusters (middle, HT-29); there is only one CNV clone type existing within the cell line (bottom, MDA-MB-453). c The differentially expressed genes between subclusters are enriched in CNV regions for listed cell lines (DEG number: n = 284 in cluster 3 of 786-O, n = 284 in cluster 0 of HeLa, n = 289 in cluster 2 of Hep G2, n = 159 in cluster 1 of HNSCCUM-03T, n = 643 in cluster 2 of Huh7, n = 256 in cluster 1 of MDA-MB-468, n = 638 in cluster 4 of RKO, n = 1351 in cluster 4 of SNB75). A one-tailed hypergeometric test was used to test the statistical significance. Source data are provided in the Source Data file.
Fig. 5
Fig. 5. Expression heterogeneity regulated by epigenetic plasticity.
a The heatmap depicted the hierarchical clustering of cell lines and TFs heterogeneously activated in more than three or at least four cell lines. The exact number and identity of cell lines for each TF are listed in the accompanying source data file. Five clusters of subgroups of cell lines and seven functional groups of TFs were identified, respectively. bd Integration of scRNA-seq and scATAC-seq of three cell lines (MDA-MB-231, RPMI 8226, and SNB75): b UMAP plot scATAC-seq clusters of three cell lines; c Mapping between transcriptomic subclusters and scATAC-seq clusters. UMAP plot scATAC-seq data with transcriptomic subcluster labels indicated. d Dot plot showing the corresponding scRNA-seq clusters (X-axis) and scATAC-seq clusters (Y-axis). Dot color indicates the matching degree between scRNA clusters and scATAC clusters, and dot size indicates the cell proportion in the scATAC-seq cluster that overlaps with corresponding scRNA-seq clusters. A/R combined with the original cluster number was indicated, e.g., A1 represented cluster 1 from scATAC-seq data, and R0 represented cluster 0 from scRNA-seq data. e TFs sorted with the motif enriched in the peaks of heterogenous accessibility of MDA-MB-231. f Ridge plot showed the activity of FOXA2 across subclusters of MDA-MB-231. g The chromatin accessibility of FOXA2 gene locus in different subclusters of MDA-MB-231. h Functional enrichment analysis of FOXA2 downstream target genes with Hallmark gene set. A one-tailed hypergeometric test was used to test the statistically significant differences. FDR-adjusted p-value < 0.05. Q value for Kras_signaling_up is 0.074. i Comparison of the average expression level of ‘KRAS signaling up’ related genes among FOXA2 target genes across subclusters of MDA-MB-231 (n = 208 in subcluster 0, n = 687 in subcluster 1, and n = 724 in subcluster 2). For each boxplot, the center line represents the median, the box indicates the upper and lower quartiles and the whisker represents 1.5-fold of the interquartile range. A two-sided Wilcoxon test was used to test the statistical significance. Source data are provided in the Source Data file.
Fig. 6
Fig. 6. Contribution of ecDNAs to the cellular transcriptomic heterogeneity.
a The number of ecDNA in different cell lines and ecDNA amplicons with oncogenes accumulate in cells. A one-tailed hypergeometric test was used to test the statistical significance. b ecDNAs with oncogenes (n = 2149), compared to ecDNAs with non-oncogenes (n = 5469), appeared in a higher proportion of cells within individual cell line. For each boxplot, the center line represents the median, the box indicates the upper and lower quartiles and the whisker represents 1.5-fold of the interquartile range. Each dot stands for the cell proportion of cells with one specific ecDNA within an individual cell line. A two-sided Wilcoxon test was used to test the statistical significance. c The correlation between the relative coverage number of ecDNAs and the RNA expression level of genes that appeared in ecDNAs. Spearman’s rank correlation coefficient was used to evaluate the correlation between the scATAC-seq read coverage of ecDNA amplicon (x-axis) and the RNA expression level. A two-tailed Spearman correlation test was used to test statistical significance. d The expression of genes appearing in ecDNA regions in the subcluster of SCC-4. e The percentage of ecDNA-positive cells and high expression cells was correlated in SCC-4. f UMAP map of coverage of ecDNA (chr12: 5900000_7200000). Each dot represents a cell, the color from blue to yellow represents the coverage from low to high, and the red circle marked out is cluster 0 of MDA-MB-231 (n = 208 in cluster 0, n = 687 in cluster 1, and n = 724 in cluster2). For each boxplot, the center line represents the median, the box indicates the upper and lower quartiles and the whisker represents 1.5-fold of the interquartile range. A two-sided Wilcoxon test was used to test the statistical significance. g The expression of genes located on ecDNA (chr12: 5900000_7200000) in different clusters (n = 208 in cluster 0, n = 687 in cluster 1, and n = 724 in cluster2). For each boxplot, the center line represents the median, the box indicates the upper and lower quartiles and the whisker represents 1.5-fold of the interquartile range. A two-sided Wilcoxon test was used to test the statistical significance. Source data are provided in the Source Data file.
Fig. 7
Fig. 7. The plasticity of cellular transcriptomic heterogeneity.
a A UMAP plot of HCT 116 at time point 1 (T1, left) and time point 2 (T2, right) (n = 2008 cells at T1, n = 1638 cells at T2). N represents cell numbers in different subclusters. b Venn diagram of barcodes in different subclusters of HCT116 at T1 (left) and T2 (right). c The distribution of unique barcodes in subclusters at T1 was rearranged at T2 for HCT 116. Time point combined with the original cluster number was indicated, e.g., T1_0 represented cluster0 from T1. Source data are provided in the Source Data file.
Fig. 8
Fig. 8. Cells responded differently under hypoxia.
a The subclusters could be matched before and after hypoxia treatment in ZR-75-1. Left, UMAP plots scRNA-seq of ZR-75-1 before hypoxia treatment. Middle, UMAP plots scRNA-seq of ZR-75-1 upon hypoxia treatment. Right, the barplot shows the abundance of clusters in ZR-75-1 with or without hypoxia treatment. Different clusters are labeled with different colors. b Volcano plot showing log2 fold change (x-axis) and −log10-transformed FDR-adjusted P-value (y-axis) of differentially expressed genes in corresponding clusters of ZR-75-1 between control and hypoxia treatment (n = 83 DEGs in corresponding cluster 0 of ZR-75-1 between control and hypoxia, n = 182 DEGs in corresponding cluster 1 of ZR-75-1 between control and hypoxia, n = 144 DEGs in corresponding cluster 2 of ZR-75-1 between control and hypoxia). A moderated t-statistics and empirical Bayes methods was used to test statistical significance. Upregulated genes are shown in red, and downregulated genes are highlighted in blue. Insignificant genes are colored in gray. c Cells in the same subcluster responded differently to hypoxia in DLD-1. Left, UMAP plots scRNA-seq of DLD-1 before hypoxia treatment. Middle, UMAP plots scRNA-seq of DLD-1 upon hypoxia treatment. Right, the barplot shows the abundance of clusters in DLD-1 with or without hypoxia treatment. Different clusters are labeled with different colors. d Volcano plot showing log2 fold change (x-axis) and −log10-transformed FDR-adjusted P-value (y-axis) of differentially expressed genes in corresponding clusters of DLD-1 between control and hypoxia treatment (n = 337 DEGs between cluster 0 and 0-1, n = 422 DEGs between cluster 0 and 0-2, n = 332 DEGs in corresponding cluster 1 of DLD-1 between control and hypoxia). A moderated t-statistics and empirical Bayes methods was used to test statistical significance. Upregulated genes are shown in red, and downregulated genes are highlighted in blue. Insignificant genes are colored in gray. e Cells in one subcluster responded differently to hypoxia in SW620. Left, UMAP plots scRNA-seq of SW620 before hypoxia treatment. Middle, UMAP plots scRNA-seq of SW620 upon hypoxia treatment. Right, the barplot shows the abundance of clusters in SW620 with or without hypoxia treatment. Different clusters are labeled with different colors. f Functional enrichment analysis of differentially expressed genes in subclusters of SW620 between control and hypoxia treatment (n = 93 DEGs between 0 and 0-1, n = 190 DEGs between 0 and 0-2). A one-tailed hypergeometric test was used to test the statistical significance. EMT-related genes were differentially induced by hypoxia treatment in one subcluster of SW620. Source data are provided in the Source Data file.
Fig. 9
Fig. 9. TFs are responsible for heterogeneous response under hypoxia treatment.
a UMAP plot of integration of scATAC-seq under normoxia and scRNA-seq with hypoxia treatment of DLD-1 (left). UMAP plot of scRNA-seq of DLD-1 upon hypoxia treatment (right). b The activity of ETS (ELK4, FLI1) and E2F (E2F3, E2F6) family TFs across clusters in DLD-1. c UMAP plot of integration of scATAC-seq under normoxia and scRNA-seq with hypoxia treatment of SW620 (left). UMAP plot of scRNA-seq of SW620 upon hypoxia treatment (right). d The activity of HMG (TCF4, TCF3) family TFs across clusters in SW620. Source data are provided in the Source Data file.

References

    1. McGranahan N, Swanton C. Clonal heterogeneity and tumor evolution: past, present, and the future. Cell. 2017;168:613–628. doi: 10.1016/j.cell.2017.01.018. - DOI - PubMed
    1. Method of the Year 2019: single-cell multimodal omics. Nat. Methods17, 1 (2020). - PubMed
    1. Baslan T, Hicks J. Unravelling biology and shifting paradigms in cancer with single-cell sequencing. Nat. Rev. Cancer. 2017;17:557–569. doi: 10.1038/nrc.2017.58. - DOI - PubMed
    1. Ben-David U, et al. Genetic and transcriptional evolution alters cancer cell line drug response. Nature. 2018;560:325–330. doi: 10.1038/s41586-018-0409-3. - DOI - PMC - PubMed
    1. Fang L, et al. CASB: a concanavalin A-based sample barcoding strategy for single-cell sequencing. Mol. Syst. Biol. 2021;17:e10060. doi: 10.15252/msb.202010060. - DOI - PMC - PubMed

Publication types

Associated data

LinkOut - more resources