. 2023 Dec 9;6(1):1248.
doi: 10.1038/s42003-023-05645-w.

Single-cell map of dynamic cellular microenvironment of radiation-induced intestinal injury

Affiliations

Single-cell map of dynamic cellular microenvironment of radiation-induced intestinal injury

Hao Lu et al. Commun Biol. .

Abstract

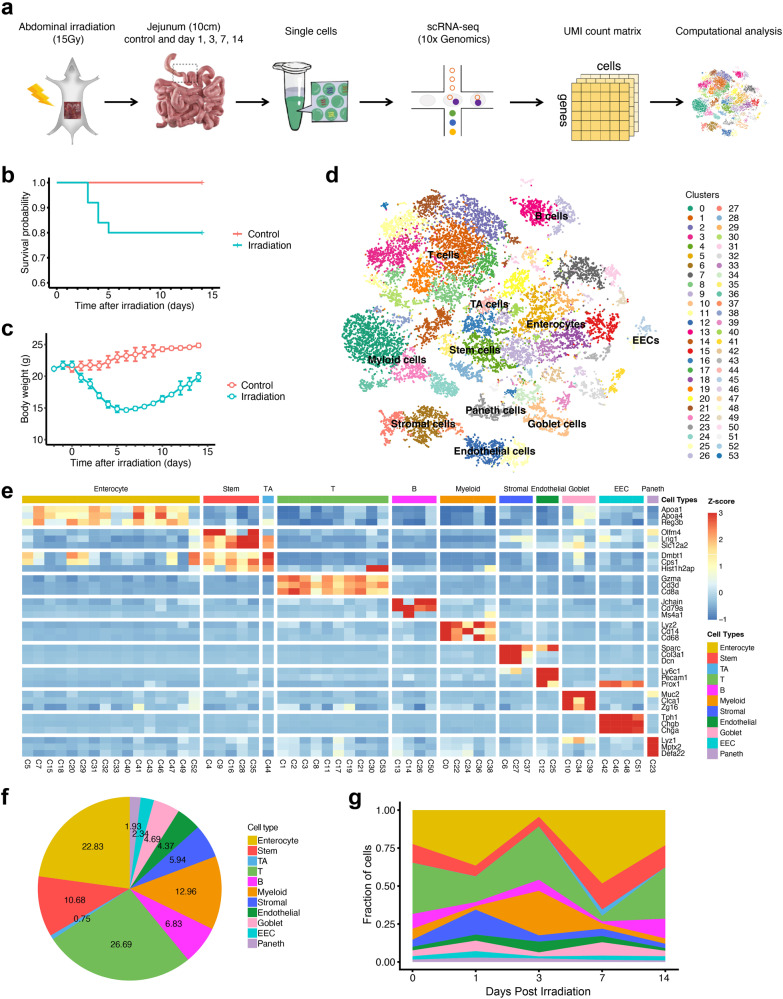
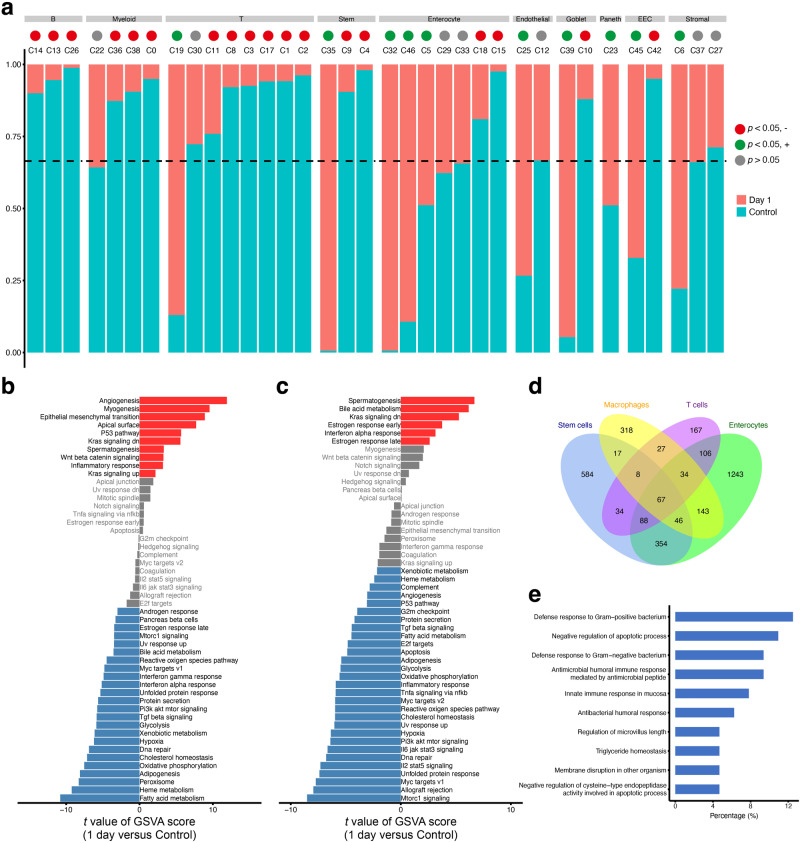
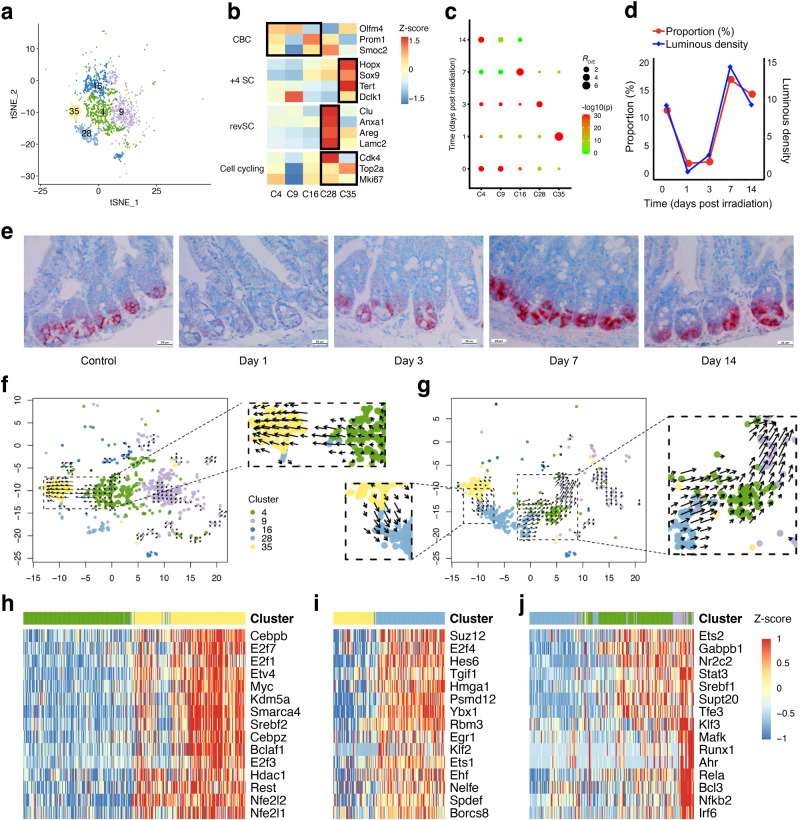
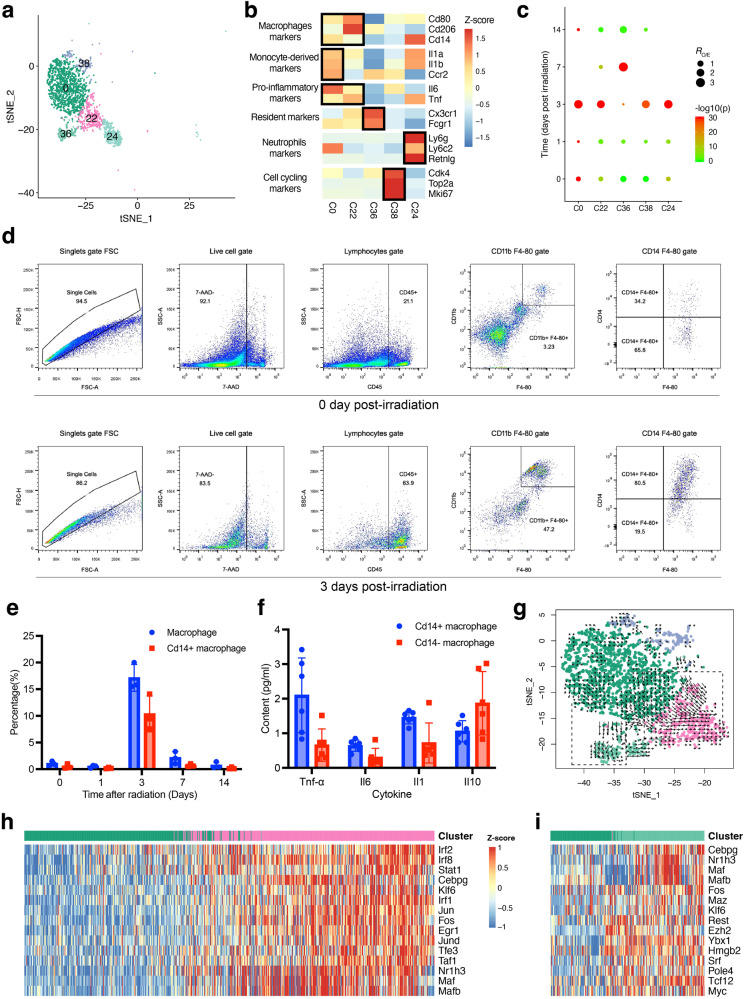
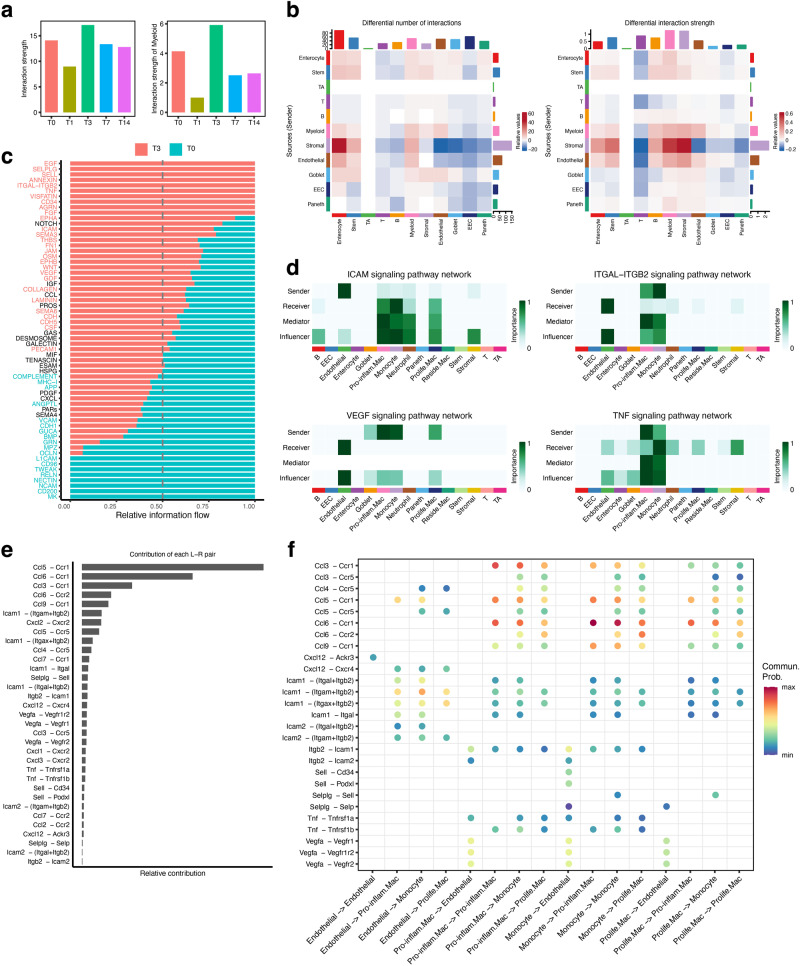
Intestine is a highly radiation-sensitive organ that could be injured during the radiotherapy for pelvic, abdominal, and retroperitoneal tumors. However, the dynamic change of the intestinal microenvironment related to radiation-induced intestine injury (RIII) is still unclear. Using single-cell RNA sequencing, we pictured a dynamic landscape of the intestinal microenvironment during RIII and regeneration. We showed that the various cell types of intestine exhibited heterogeneous radiosensitivities. We revealed the distinct dynamic patterns of three subtypes of intestinal stem cells (ISCs), and the cellular trajectory analysis suggested a complex interconversion pattern among them. For the immune cells, we found that Ly6c+ monocytes can give rise to both pro-inflammatory macrophages and resident macrophages after RIII. Through cellular communication analysis, we identified a positive feedback loop between the macrophages and endothelial cells, which could amplify the inflammatory response induced by radiation. Besides, we identified different T cell subtypes and revealed their role in immunomodulation during the early stage of RIII through inflammation and defense response relevant signaling pathways. Overall, our study provides a valuable single-cell map of the multicellular dynamics during RIII and regeneration, which may facilitate the understanding of the mechanism of RIII.


Conflict of interest statement

The authors declare no competing interests.

Figures

Fig. 1
Fig. 1. Identification of major intestinal cell types and their markers using scRNA-seq.
a Overview of single-cell RNA sequencing (scRNA-seq) analysis for the irradiation-induced intestinal injury (RIII). b Survival rates of the mice exposed to 15 Gy abdominal irradiation and in control group. c Body weights of the mice exposed to 15 Gy abdominal irradiation and in control group. The error bars represent the standard deviation (SD). d tSNE projection of the 22,680 cells profiled, colored by Seurat cluster and annotated with major cell types. e Heatmap displaying the z-score normalized mean expression of cell type-specific canonical marker genes across clusters. f Pie chart of cell type fractions in all sequenced samples. g Area chart showing the dynamic changes of the proportions of major cell types in healthy intestinal samples (Control) and exposed intestinal samples at different times after irradiation. D1, day 1; D3, day 3; D7, day 7; and D14, day 14.
Fig. 2
Fig. 2. Characteristics of in vivo radiosensitivities of different cell types in intestine.
a Bar plots showing the fraction of cells originating from the control and day 1 groups in each cluster. Only the clusters that had >50 cells from the two groups and that showed no inter-individual difference (clusters with no more than 70% of cells from a single sample) were shown. Vertical dashed lines indicate the overall fraction of cells originating from the control group in all shown clusters. b Difference of hallmark pathway activities between stem cells from the control and day 1 (D1) groups. Shown are t values calculated in a linear modal comparing the pathway scores estimated by gene set variation analysis (GSVA) between cells from the two groups. c The same as (b) for macrophages from the control and day 1 groups. d Venn diagram showing the intersection of differentially expressed genes between cells from the control and day 1 groups for stem cells, macrophages, T cells, and enterocytes. e Top 10 significantly enriched gene ontology (GO) terms of 67 common differentially expressed genes for stem cells, macrophages, T cells, and enterocytes.
Fig. 3
Fig. 3. Dynamics and differentiation trajectories of intestinal stem cell (ISC) subsets in irradiation-induced intestinal injury and regeneration.
a tSNE projection of 2,411 ISCs identified, colored by Seurat cluster identities. b Heatmap of the average expression of the selected ISC function-related marker genes in five ISC clusters. c Dot plots showing the ratio of observed to expected cell numbers (RO/E) of each ISC cluster in the indicated samples, with log-transformed Bonferroni-corrected P values in Chi-square tests. d Line charts showing the average luminous density of Olfm4 in immunostaining (blue) and the fraction of Olfm4+ CBCs (clusters 4, 9 and 16; red) in the indicated groups. e Olfm4 immunostaining (red) in jejunum in the control, day 1, 3, 7 and 14 groups. Scale bar = 25 μm. f RNA velocities of ISCs from the control and day 1 groups visualized on the tSNE projection. g The same as (f) for ISCs from the day 1 and day 3 groups. h Heatmap depicting the estimated activity of top 15 regulons showing differential activation in ISCs along the velocity flow from the control and day 1 groups, which is depicted by a black dashed line in (f). Shown are normalized mean area under the curve (AUC) scores of expression regulation by each transcription factor estimated in SCENIC. Cells are ordered according to first principal component (PC1) coordinate to grasp the primary velocity orientation. i, j The same as (h) for ISCs along the velocity flow from the day 1 and day 3 groups, which is depicted by black dashed lines in the left (i) and right (j) panel in (g).
Fig. 4
Fig. 4. The characteristics and roles of macrophage subsets in the irradiation-induced intestinal inflammation.
a tSNE projection of 2,926 myeloid cells identified, colored by Seurat cluster identities. b Heatmap of the average expression of the selected myeloid cell function-related marker genes in five myeloid cell clusters. c Dot plots showing the ratio of observed to expected cell numbers of each myeloid cell cluster in the indicated samples, with Bonferroni-corrected P values by Chi-square tests. d Flow cytometry analyses showing the percentages of Cd14+ inflammatory macrophages at control and 3 days post irradiation groups. e Dynamic change of the percentages of Cd14+ macrophages at control, 1, 3, 7 and 14 days post irradiation groups. The error bars represent the SD. f Expression levels of inflammatory cytokines by Cd14+ and Cd14- macrophages in intestine 3 day post irradiation. The error bars represent the SD. g RNA velocities of four macrophage clusters visualized on the tSNE projection. h, i Heatmap depicting the estimated activities of top 15 differentially activated regulons along the velocity flow, which was depicted by black dashed lines in the right (h) and left (i) panel in (g). Shown are normalized mean area under the curve (AUC) scores of expression regulation of each transcription factor estimated by SCENIC. Cells are ordered according to first principal component (PC1) coordinate to grasp the primary velocity orientation.
Fig. 5
Fig. 5. Cellular interaction between the myeloid and endothelial cells.
a The overall (lift) and myeloid cell-derived (right) interaction strength at different times post irradiation. b Heatmap depicting the differential interaction numbers (left) and strength (right) among major cell types in day 3 group compared to those in control group. c Bar graph showing the overall information flow of each signaling pathway in day 3 and control group. d Heatmap depicting the network centrality scores for each cell type in the selected signaling pathways. e Bar graph showing the contribution of each ligand-receptor pair to the myeloid cell migration and activation relevant signaling pathways. f Dot plot showing the significant ligand-receptor pairs associated with the myeloid cell migration and activation relevant signaling pathways.
Fig. 6
Fig. 6. The characteristics of T cell subtypes and the associated cellular interaction in irradiation-induced intestinal inflammation.
a tSNE projection of 6027 T cells identified, colored by Seurat cluster identities. b Heatmap of the average expression of the selected T cell function-related marker genes in 10 T cell clusters. c The top 10 significantly GO terms of the marker genes in each T cell subtype. d Dot plots showing the ratio of observed to expected cell numbers of each T cell subtype in the indicated samples, with Bonferroni-corrected P values by Chi-square tests. e Heatmap showing the relative strength of overall signaling pathways associated with each cell population in the day 3 group. f Circle plot depicting the inferred signaling network of the selected signaling pathways in the day 3 group. g Dot plot showing the significant ligand-receptor pairs associated with the signaling pathways shown in (f).

References

    1. Shukla PK, et al. Rapid disruption of intestinal epithelial tight junction and barrier dysfunction by ionizing radiation in mouse colon in vivo: protection by N-acetyl-l-cysteine. Am. J. Physiol. Gastrointest. Liver Physiol. 2016;310:G705–G715. doi: 10.1152/ajpgi.00314.2015. - DOI - PMC - PubMed
    1. Hauer-Jensen M, Wang J, Denham JW. Bowel injury: current and evolving management strategies. Semin. Radiat. Oncol. 2003;13:358–371. doi: 10.1016/S1053-4296(03)00032-8. - DOI - PubMed
    1. Hauer-Jensen M, Denham JW, Andreyev HJN. Radiation enteropathy—pathogenesis, treatment and prevention. Nat. Rev. Gastroenterol. Hepatol. 2014;11:470–479. doi: 10.1038/nrgastro.2014.46. - DOI - PMC - PubMed
    1. Qu W, Zhang L, Ao J. Radiotherapy induces intestinal barrier dysfunction by inhibiting autophagy. ACS Omega. 2020;5:12955–12963. doi: 10.1021/acsomega.0c00706. - DOI - PMC - PubMed
    1. Zhao Z, Cheng W, Qu W, Shao G, Liu S. Antibiotic alleviates radiation-induced intestinal injury by remodeling microbiota, reducing inflammation, and inhibiting fibrosis. ACS Omega. 2020;5:2967–2977. doi: 10.1021/acsomega.9b03906. - DOI - PMC - PubMed

Publication types