. 2023 Dec 9;14(1):8160.
doi: 10.1038/s41467-023-43869-w.

Loss of cohesin regulator PDS5A reveals repressive role of Polycomb loops

Affiliations

Loss of cohesin regulator PDS5A reveals repressive role of Polycomb loops

Daniel Bsteh et al. Nat Commun. .

Abstract

Polycomb Repressive Complexes 1 and 2 (PRC1, PRC2) are conserved epigenetic regulators that promote transcriptional gene silencing. PRC1 and PRC2 converge on shared targets, catalyzing repressive histone modifications. Additionally, a subset of PRC1/PRC2 targets engage in long-range interactions whose functions in gene silencing are poorly understood. Using a CRISPR screen in mouse embryonic stem cells, we found that the cohesin regulator PDS5A links transcriptional silencing by Polycomb and 3D genome organization. PDS5A deletion impairs cohesin unloading and results in derepression of a subset of endogenous PRC1/PRC2 target genes. Importantly, derepression is not linked to loss of Polycomb chromatin domains. Instead, PDS5A removal causes aberrant cohesin activity leading to ectopic insulation sites, which disrupt the formation of ultra-long Polycomb loops. We show that these loops are important for robust silencing at a subset of PRC1/PRC2 target genes and that maintenance of cohesin-dependent genome architecture is critical for Polycomb regulation.


Conflict of interest statement

The authors declare no competing interests.

Figures

Fig. 1
Fig. 1. CRISPR screen of cPRC1-dependent gene silencing reveals Pds5a.
a Schematic of ectopic dual reporter locus consisting of 7x TetO landing sites flanked by an upstream Ef1a promoter driven BFP and a downstream PGK driven puromycin/GFP (top). Genomic ChIP-CapSeq screenshot of PcG proteins and histone modifications before (black) and after ectopic TetR-Cbx7 expression (orange) (bottom). Also see Supplementary Fig. 1a and Supplementary Table 3. b Flow cytometry histograms of GFP signal before (left) and after 4 days of Dox-dependent reversal of TetR-CBX7 tethering (right) in control (top) and Ring1b KO (bottom) Polycomb reporter ESCs. Percentages refer to fraction of GFP-negative ESCs. c Schematic of CRISPR screen design. MOI = multiplicity of infection. Genes (sgRNA library described in ref. ) are rank-ordered based on CRISPR significance score (−log 10 MAGeCK significance score; n = mean of three independent experiments). d Flow cytometry histograms of GFP signal before (left) and after 4 days of Dox-dependent reversal of TetR-CBX7 tethering (right) in control (top) and Pds5a KO (bottom) Polycomb reporter ESCs. Percentages refer to fraction of GFP-negative ESCs.
Fig. 2
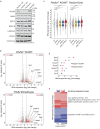
Fig. 2. Loss of cohesin regulator PDS5A results in de-repression of canonical PRC1/PRC2 target genes.
a Western blot of cohesin, PcG proteins and histone modifications in Pds5aGT KO and Pds5aGT WT ESCs and in Pds5a KO and wild-type ESCs. b Volcano plots show gene expression changes in Pds5aGT KO vs. Pds5aGT WT ESCs (top) and Pds5a KO vs. wild-type ESCs (bottom) (n = three replicates). Number of significantly up- or downregulated genes (black) (adjusted P value ≤ 0.05; LFC ≥ 0.5). Number of significantly up- and downregulated PRC1/PRC2 target genes (red). c Violin plots compare expression changes of all DEGs with different gene classes in Pds5aGT KO ESCs and Pds5a KO ESCs. In the middle of each density curve is a small box plot, with the rectangle showing the ends of the first and third quartiles and central dot the median. Significance was determined by Wilcoxon rank-sum test. Asterisks indicate significant differences between groups (**** p < 1 × 10−5; n.s. – not significant). d Dot plots show expression changes of selected PRC1/PRC2 target genes in Pds5aGT KO ESCs and Pds5a KO ESCs. e Heatmap shows cluster analysis of common upregulated (red) and downregulated (blue) DEGs in Pds5aGT KO ESCs and Pds5a KO ESCs. Most enriched gene ontology (GO) terms and corresponding significance are indicated for each cluster (right).
Fig. 3
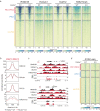
Fig. 3. PDS5A deletion has minimal effect on Polycomb chromatin domains.
a cChIP-seq heatmaps of RING1B, H2Aub1, SUZ12 and H3K27me3 at PRC1/PRC2 target genes in Pds5aGT WT and Pds5aGT KO ESCs. Enrichment signal is plotted around the TSS (±5 kb) and clustered based on gene class annotation: PRC1/PRC2 target genes (red; n = 2895), vPRC1 target genes (blue; n = 2448), non-PcG genes (yellow; n = 10591). b Meta plots show average RING1B, H2Aub1, SUZ12 and H3K27me3 cChIP-seq signals in Pds5aGT WT and Pds5aGT KO ESCs. For each plot, normalized read density is plotted in 10 kb window centered around the TSS. c Genomic screenshot of cChIP-seq and RNA-seq in Pds5aGT WT (black) and Pds5aGT KO (red) ESCs. d ATAC-seq heatmaps in Pds5aGT WT and Pds5aGT KO ESCs. ATAC signal is plotted around the TSS (±5 kb) and clustered based on gene class annotation: PRC1/PRC2 target genes, vPRC1 target genes, non-PcG genes.
Fig. 4
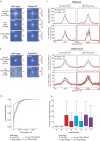
Fig. 4. PDS5A deletion causes aberrant cohesin activity and TAD boundary violations.
a Hi-C contact matrices of chromosome 2 in wild-type (left) and Pds5a KO (right) ESCs. b Eigenvector compartment signal tracks of chromosomes 1 and 2 comparing wild-type and Pds5a KO ESCs. c Genomic-distance-dependent contact probability from Hi-C in wild-type and Pds5a KO ESCs. Dashed line separates expected size ranges of TADs and compartments. d Aggregate TAD analysis in wild-type (left) and Pds5a KO (right) ESCs at 5-kb resolution. Effective contact probability is displayed using a set of published TADs in ESCs. e Aggregate interaction analysis in wild-type (left) and Pds5a KO (right) ESCs at 5-kb resolution. Effective contact probability is displayed using a set of published loops in ESCs. f Boxplot quantifies TAD boundary violation displaying changes in Hi-C contacts with n+ (x-axis) neighboring TADs in wild-type and Pds5a KO ESCs. Shown are median (horizontal line in the middle) and 25th to 75th percentiles (at the end of the boxes).
Fig. 5
Fig. 5. PDS5A is required for maintenance of ultralong-range Polycomb loops.
a Loop pileup analysis of non-PcG loops (n = 11,900), PcG loops (PRC1/2 and vPRC1; n = 525) and PRC1/PRC2 loops (PRC1/2 only; n = 476) in wild-type (left) and Pds5a KO (right) ESCs. Number indicates relative peak enrichment. b Loop pileup analysis of Polycomb loops overlapping unchanged/downregulated PRC1/PRC2 target genes (not up PRC1/PRC2 loop; n = 411) and upregulated PRC1/PRC2 target genes (up PRC1/PRC2 loop; n = 65) in wild-type (left) and Pds5a KO (right) ESCs. Number indicates relative peak enrichment. c Meta plots show average RING1B and H3K27me3 cChIP-seq signals at Polycomb loop anchors associated with unchanged/downregulated PRC1/PRC2 target genes (not up PRC1/PRC2 loop; n = 411) and upregulated PRC1/PRC2 target genes (up PRC1/PRC2 loop; n = 65) in wild-type (left) and Pds5a KO (right) ESCs. Red box indicates loop anchor that overlaps upregulated PRC1/PRC2 target genes in Pds5a KO ESCs. d Cumulative distribution of chromatin loop lengths. e Box plot shows number of TADs traversed by different types of chromatin loops in A or B compartments. Shown are median (horizontal line in the middle), 25th to 75th percentiles (at the end of the boxes) and 90% percentiles (whiskers).
Fig. 6
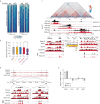
Fig. 6. Loss of Polycomb loops is linked to cohesin-mediated insulation gain.
a Heatmaps show insulation scores in wild-type and Pds5a KO ESCs for differentially insulated regions that lose (left, n = 17,269) or gain (right, n = 1,408) insulation upon PDS5A deletion. Insulation scores are plotted ±300 kb around differentially insulated regions. b Boxplots shows genomic distances of gene class TSSs to the closest insulation-gaining regions. Shown are median (horizontal line in the middle), 25th to 75th percentiles (at the end of the boxes) and 90% percentiles (whiskers). Significance was determined by Wilcoxon rank-sum test. Asterisks indicate significant differences between groups (* P value = 0.039). c Top: Hi-C matrix shows interaction differences on chromosome 2 between wild-type and Pds5a KO ESCs (blue = loss; red = gain). Middle: Virtual 4C contact plots compare interaction frequencies at three viewpoints (v1, Dlx1, and Dlx2), (v2, insulation-gaining region indicated with black bar) and (v3, Hoxd gene cluster) in wild-type (black) and Pds5a KO ESCs (red). Bottom: Genomic screenshots of cChIP-seq of PcG proteins and histone modifications at v1 and v3, and of normalized RNA-seq counts in wild-type (black) and Pds5a KO (red) ESCs. Genomic screenshot at v2 shows RAD21 cChIP-seq in wild-type (black) and Pds5a KO (red) ESCs, CTCF ChIP-seq in wild-type (black), and insulation score heatmaps. Asterisks indicate significantly increased RAD21 binding. d Genomic screen shot showing cChIP-seq signals of PcG proteins and histone modifications in wild-type (black) and Pds5aGT KO (red) ESCs and Polycomb loops in wild-type ESCs. Irx2 (a1) and Foxd1 (a2) are highlighted (gray) and cChIP-seq of PcG proteins and histone modifications and RNA-seq of normalized expression counts are shown at higher resolution below. Scissors indicate CRISPR excision at Irx2 locus. e RT-qPCR analysis of Foxd1, Ccno, Dll1 and Barx1 expression changes relative to Gapdh. Shown are data of experimental replicates in two independent CRISPR excision ESC clones. Source data are provided as a Source Data file.

References

    1. Kassis JA, Kennison JA, Tamkun JW. Polycomb and trithorax group genes in drosophila. Genetics. 2017;206:1699–1725. doi: 10.1534/genetics.115.185116. - DOI - PMC - PubMed
    1. Schuettengruber B, Bourbon H-M, Croce LD, Cavalli G. Genome regulation by polycomb and trithorax: 70 years and counting. Cell. 2017;171:34–57. doi: 10.1016/j.cell.2017.08.002. - DOI - PubMed
    1. Béguelin W, et al. EZH2 is required for germinal center formation and somatic EZH2 mutations promote lymphoid transformation. Cancer Cell. 2013;23:677–692. doi: 10.1016/j.ccr.2013.04.011. - DOI - PMC - PubMed
    1. Béguelin W, et al. EZH2 and BCL6 cooperate to assemble CBX8-BCOR complex to repress bivalent promoters, mediate germinal center formation and lymphomagenesis. Cancer Cell. 2016;30:197–213. doi: 10.1016/j.ccell.2016.07.006. - DOI - PMC - PubMed
    1. Chan HL, et al. Polycomb complexes associate with enhancers and promote oncogenic transcriptional programs in cancer through multiple mechanisms. Nat. Commun. 2018;9:3377. doi: 10.1038/s41467-018-05728-x. - DOI - PMC - PubMed

Publication types

Associated data