Inequitable access to nonpharmacologic pain treatment providers among cancer-free U.S. adults
- PMID: 38072313
- PMCID: PMC10872296
- DOI: 10.1016/j.ypmed.2023.107809
Inequitable access to nonpharmacologic pain treatment providers among cancer-free U.S. adults
Abstract
Objective: Using evidence-based nonpharmacologic pain treatments may prevent opioid overuse and associated adverse outcomes. There is limited data on the impact of access-promoting social determinants of health (SDoH: education, income, transportation) on use of nonpharmacologic pain treatments. Our objective was to examine the relationship between SDoH and use of nonpharmacologic pain treatment providers. Our goal was to understand policy-actionable factors contributing to inequity in pain treatment.
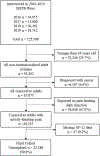
Methods: Based on Andersen's Health Utilization Model, this cross-sectional analysis of 2016-2019 Medical Expenditure Panel Survey data evaluated whether use of outpatient nonpharmacologic pain treatment providers is driven by enabling (i.e., advantageous socioeconomic resources) or need (i.e., perceived disability and diagnosed disease) factors. The study sample (unweighted n = 28,188) represented a weighted N = 81,912,730 noninstitutionalized, cancer-free, U.S. adults with pain interference. The primary outcome measured use of nonpharmacologic providers relative to exclusive prescription opioid use or no treatment (i.e., neither opioids nor nonpharmacologic). To quantify equitable access, we compared the variance-between access-promoting enabling factors versus medical need factors-that explained utilization.
Results: Compared to enabling factors, need factors explained twice the variance predicting pain treatment utilization. Still, the adjusted odds of using nonpharmacologic providers instead of opioids alone were 39% lower among respondents identifying as Black (95% Confidence Interval [CI], 0.49-0.76) and respondents residing in the U.S. South (95% CI, 0.51-0.74). Higher education (95% CI, 1.72-2.79) and income (95% CI, 1.68-2.42) both facilitated using nonpharmacologic providers instead of opioids.
Conclusions: These findings highlight the substantial influence access-promoting SDoH have on pain treatment utilization.
Keywords: Care access; Disparities; Medical expenditure panel survey; Opioids; Pain management; Rehabilitation.
Copyright © 2023 Elsevier Inc. All rights reserved.
Conflict of interest statement
Declaration of Competing Interest None declared.
Figures
Similar articles
-
Trends in the Use of Opioids vs Nonpharmacologic Treatments in Adults With Pain, 2011-2019.JAMA Netw Open. 2022 Nov 1;5(11):e2240612. doi: 10.1001/jamanetworkopen.2022.40612. JAMA Netw Open. 2022. PMID: 36342717 Free PMC article.
-
Health Disparities in Access to Nonpharmacologic Therapies in an Urban Community.J Altern Complement Med. 2019 Jan;25(1):48-60. doi: 10.1089/acm.2018.0217. Epub 2018 Sep 20. J Altern Complement Med. 2019. PMID: 30234363
-
Substitution of Nonpharmacologic Therapy With Opioid Prescribing for Pain During the COVID-19 Pandemic.JAMA Netw Open. 2021 Dec 1;4(12):e2138453. doi: 10.1001/jamanetworkopen.2021.38453. JAMA Netw Open. 2021. PMID: 34889946 Free PMC article.
-
Opioid use in the management of chronic pain.Med Clin North Am. 1999 May;83(3):761-86. doi: 10.1016/s0025-7125(05)70133-4. Med Clin North Am. 1999. PMID: 10386124 Review.
-
The burden of the nonmedical use of prescription opioid analgesics.Pain Med. 2009 Jul;10 Suppl 2:S89-100. doi: 10.1111/j.1526-4637.2009.00668.x. Pain Med. 2009. PMID: 19691688 Review.
Cited by
-
Distribution of opioid analgesics by community racial/ethnic and socioeconomic profiles, 2011-2021.Pain. 2025 Jan 21;166(7):1653-1661. doi: 10.1097/j.pain.0000000000003511. Pain. 2025. PMID: 39847449
-
Study Protocol for Pain Self-Management and Patient-Oriented Buprenorphine Dosing for Pain and Retention in Office-Based Opioid Treatment: A Hybrid Type 1, 2 × 2 Factorial Randomized Controlled Trial.Subst Use Addctn J. 2025 Jan;46(1):201-207. doi: 10.1177/29767342241261562. Epub 2024 Jun 22. Subst Use Addctn J. 2025. PMID: 38907678 Free PMC article.
References
-
- U. S. Healthy People Initiative. Healthy People 2020: An opportunity to address the societal determinants of health in the United States. Secretary’s Advisory Committee on Health Promotion and Disease Prevention; 2020.
-
- Centers for Disease Control and Prevention. Social determinants of health: know what affects health. Updated September 20, 2021. Accessed January 3, 2023. https://www.cdc.gov/socialdeterminants/index.htm
-
- Stimpson JP, Ju H, Raji MA, Eschbach K. Neighborhood deprivation and health risk behaviors in NHANES III. American journal of health behavior. 2007;31(2):215–222. - PubMed
-
- Borsky A, Mitchell E, Machlin S. Research Findings# 41: Use of clinical preventive services in the United States: estimates from the Medical Expenditure Panel Survey (MEPS), 2015. 2019;
MeSH terms
Substances
Grants and funding
LinkOut - more resources
Full Text Sources
Medical


