. 2023 Dec 10;12(1):104.
doi: 10.1186/s40164-023-00463-6.

ProNGF promotes brain metastasis through TrkA/EphA2 induced Src activation in triple negative breast cancer cells

Affiliations

ProNGF promotes brain metastasis through TrkA/EphA2 induced Src activation in triple negative breast cancer cells

Julien Cicero et al. Exp Hematol Oncol. .

Abstract

Background: Triple-Negative Breast Cancer is particularly aggressive, and its metastasis to the brain has a significant psychological impact on patients' quality of life, in addition to reducing survival. The development of brain metastases is particularly harmful in triple-negative breast cancer (TNBC). To date, the mechanisms that induce brain metastasis in TNBC are poorly understood.

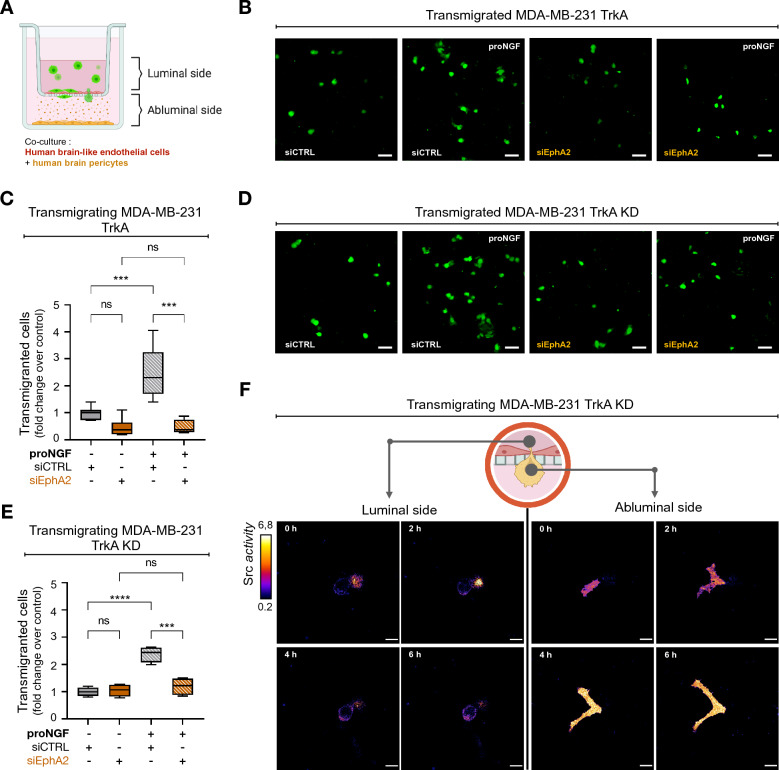
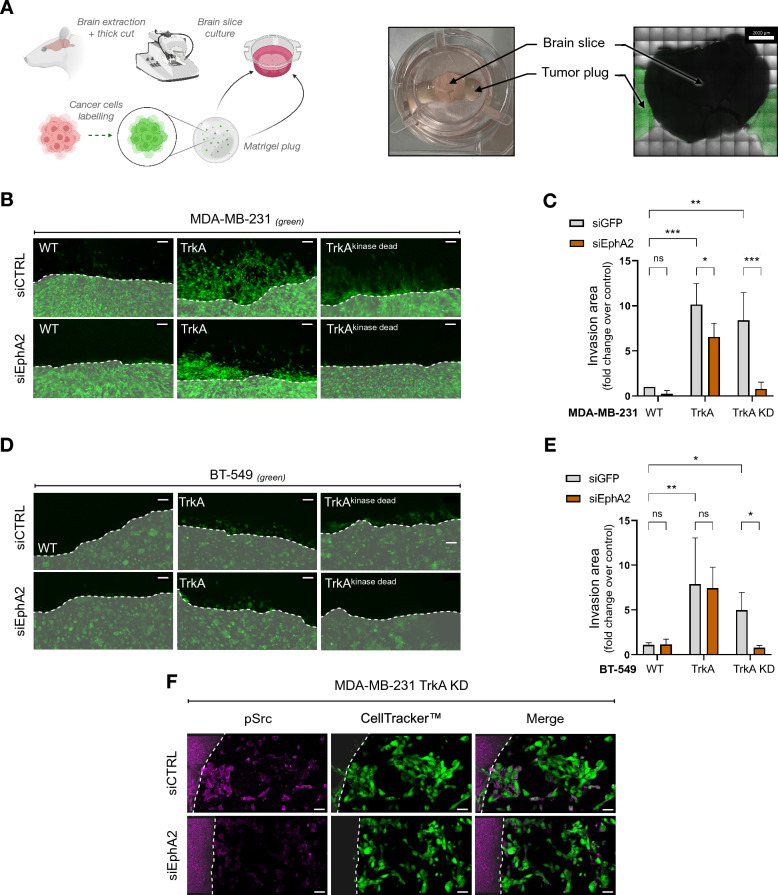
Methods: Using a human blood-brain barrier (BBB) in vitro model, an in vitro 3D organotypic extracellular matrix, an ex vivo mouse brain slices co-culture and in an in vivo xenograft experiment, key step of brain metastasis were recapitulated to study TNBC behaviors.

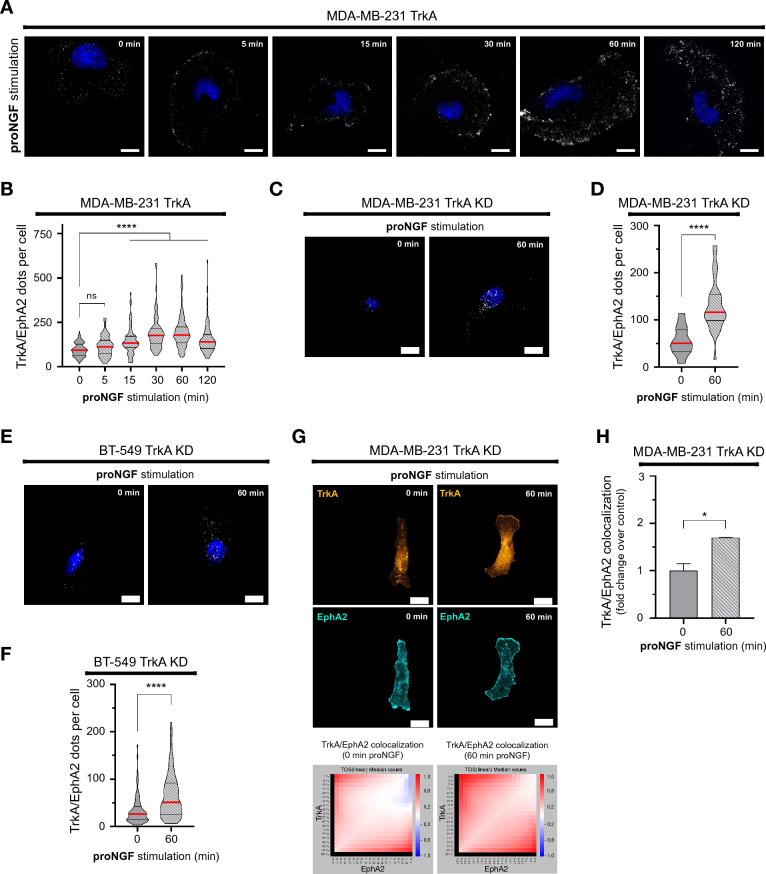
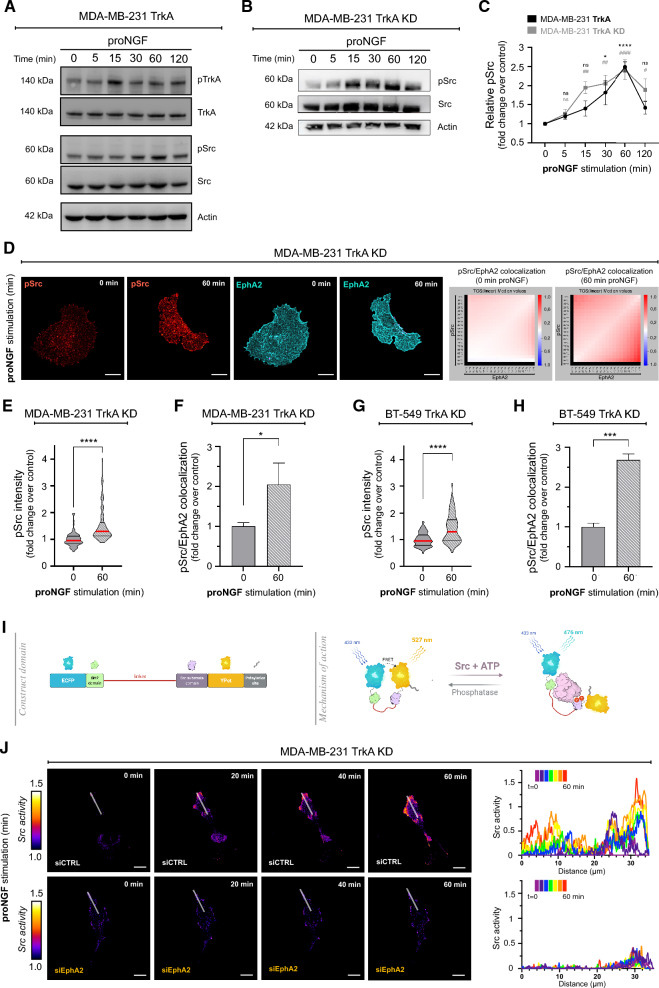
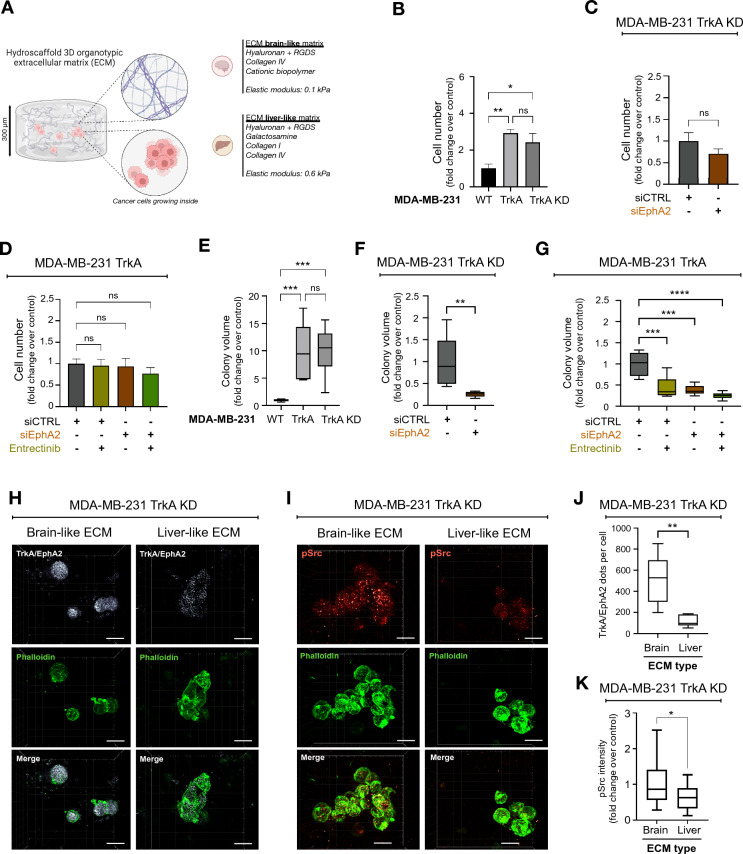
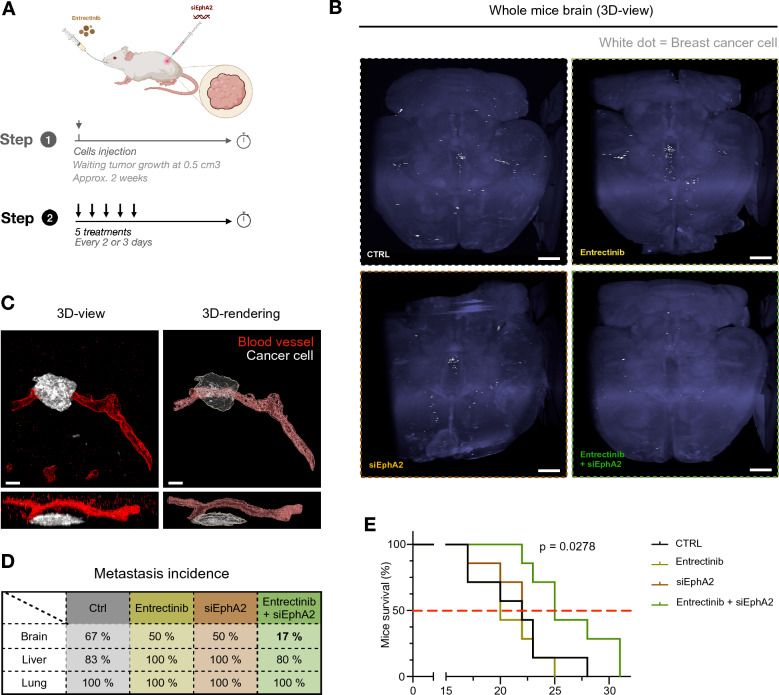
Results: In this study, we demonstrated for the first time the involvement of the precursor of Nerve Growth Factor (proNGF) in the development of brain metastasis. More importantly, our results showed that proNGF acts through TrkA independent of its phosphorylation to induce brain metastasis in TNBC. In addition, we found that proNGF induces BBB transmigration through the TrkA/EphA2 signaling complex. More importantly, our results showed that combinatorial inhibition of TrkA and EphA2 decreased TBNC brain metastasis in a preclinical model.

Conclusions: These disruptive findings provide new insights into the mechanisms underlying brain metastasis with proNGF as a driver of brain metastasis of TNBC and identify TrkA/EphA2 complex as a potential therapeutic target.

Keywords: Brain metastasis; Breast cancer; EphA2; Src; TrkA; proNGF.


Conflict of interest statement

The authors declare no competing interests.

Figures

Fig. 1
Fig. 1
proNGF increases TrkA/EphA2 complexes in TNBC. A and B Representative overlay (A) and quantification (B) of TrkA/EphA2 PLA signal following proNGF stimulation (5, 15, 30, 60 and 120 min) in MDA-MB-231-TrkA. CF Representative pictures of TrkA/EphA2 PLA signal following proNGF stimulation (60 min) in MDA-MB-231-TrkA-KD and BT-549 HA-TrkA KD (C & E) with respectively the associated quantification (D & F). G & H Representative confocal images of TrkA and EphA2 signal in MDA-MB-231-TrkA and TrkA/EphA2 colocalization matrix (G) with its quantification (H). Excluding experiment G and H which are performed in duplicate, data in A-F are representative of 3 independents experiments performed on 30 cells/condition each. Data in B, D and F are presented with violin plots demonstrating the median (red bold line), quartiles (dots lines), variability and density. Data in H are represented by column bar graph with SD. One-way ANOVA followed by Tukey’s test for B. Unpaired 2-tailed t test for D, F and H. *P ≤ 0.05, ****P ≤ 0.0001, ns (non-significant). For A, C and E, scale bar = 10 µm, and for G, scale bar = 15 µm
Fig. 2
Fig. 2
proNGF induces Src activation independently of TrkA phosphorylation in TNBC. AC Immunoblotting from MDA-MB-231-TrkA (A) or MDA-MB-231-TrkA-KD (B) following proNGF treatment (5, 15, 30,60 and 120 min) for TrkA, Src (and their phosphorylation form) and actin with associated relative quantification of Src phosphorylated regarding to its unphosphorylated form (C). D-H Representative confocal images from proNGF simulated (0 or 60 min) MDA-MB-231-TrkA-KD (D) of Src active form (Red) and EphA2 (Blue) staining with pSrc/EphA2 colocalization matrix and respective Src activity (E & F) and EphA2/pSrc colocalization quantification (G & H) for MDA-MB-231-TrkA-KD and BT-549 KD. I Scheme of FRET Src reporter from Ouyang et al. that is characterized by an ECFP/YPET pair, an SH2 domain, a Src substrate domain and a prenylation site. (J) Emission ratio images and profiles along the indicated white lines of the ECFP/YPet-based Src biosensor in response to proNGF stimulation with or without prior transfection of siEphA2 on MDA-MB-231-TrkA-KD. Excluding experiment B which is performed in duplicate, data in A to J are representative of 3 independents experiments. For D to H, they are performed on 30 cells/condition each, data in J are realized on approximately 7 cells/condition. Data in C are represented by connecting line graph with mean ± SEM. Data in E and G are presented with violin plots demonstrating the median (red bold line), quartiles (thin black line), variability and density. Data in F and H are represented by column bar graph with SD. Two-way ANOVA followed by Sidak’s test for C with the set of conditions was compared to the corresponding 0 min time. Unpaired 2-tailed t test for E to H. * and #P ≤ 0.05, ** and ##P ≤ 0.01, *** and ###P ≤ 0.001, **** and ####P ≤ 0.0001. For D and E, scale bare = 15 µm
Fig. 3
Fig. 3
proNGF enhances trans-BBB migration through Src activation independently of TrkA phosphorylation in TNBC. A Schematic representation of human BBB in vitro model, this one is characterized by a luminal compartment that allow culture of human BLEC on insert filtered (3 µm) and an abluminal compartment with plated human brain pericyte. Cancer cells are load with CellTracker™ before being incubated in the upper side. B-E Representative overlay (B & D) and associated quantification (C & E) of CellTracker™ stained MDA-MB-231-TrkA or CellTracker™ stained MDA-MB-231-TrkA-KD (green) on the lower compartment after a 16 h trans-BBB migration. (F) Emission ratio images of the ECFP/YPet-based Src biosensor during MDA-MB-231-TrkA-KD trans-BBB migration under abluminal proNGF stimulation. Data inB-E are representative of 3 independents experiments with all condition realized in duplicate. Data in C and E are represented by min to max interleaved box graph with median (black line). Two-way ANOVA followed by Tukey’s test for D and F. ***P ≤ 0.001, ****P ≤ 0.0001, ns (non-significant). For B and D scale bar = 100 µm, for D and F scale bare = 15 µm
Fig. 4
Fig. 4
TrkA/EphA2 increases brain parenchyma invasion of TNBC. A Experimental approaches of ex vivo brain slices culture with TNBC. After dissection, the mouse brain is thickly sliced and cultured with the TNBC on an air/liquid interface over 72 h. B-E Representative pictures (BD) and associated quantification C & E from the monitoring of CellTracker™ stained MDA-MB-231 WT/TrkA/TrkA KD or CellTracker™ stained BT-549 WT/TrkA/TrkA KD (green) during mouse brain slices invasion. F Overlay about Src activation (pink) in CellTracker™ stained MDA-MB-231-TrkA-KD (green) with or without prior siEphA2 transfection. Data in B-E are representative of 3 independents experiments with all condition realized in duplicate. Data in F were performed in duplicate for each condition. Data in C and E are presented as a column bar graph with SD. Two-way ANOVA followed by Tukey’s test for C and E. *P ≤ 0.05, **P ≤ 0.01, ns (non-significant). For B, D and F, the Matrigel® plug is highlighted by a whitish area delimited with dotted lines. For B and D scale bar = 100 µm, and F, scale bar = 30 µm
Fig. 5
Fig. 5
TrkA/EphA2 increases TNBC persistence in brain-like ECM. A Schematic representation of in vitro brain-like and liver-like 3D ECM (from BIOMIMESYS®) where MDA-MB-231 cells are maintained. B-G According to the TrkA overexpression status in MDA-MB-231, cell number (B & C) and colonies volumes (EG) are quantified after entrectinib and/or EphA2 targeting siRNA of 21 days culture in 3D organotypic ECM. (I and K) Representative pictures (H) and associated quantification (J) of TrkA/EphA2 PLA signal inside MDA-MB-231-TrkA-KD incubated in brain-like or liver-like ECM. I and K Representative confocal images (J) and associated quantification (L) of phosphorylated Src (active form) signal in MDA-MB-231-TrkA-KD incubated in brain-like or liver-like ECM. Data in B-G are representative of 2 independents experiments performed in triplicate. These data H to K are from one replicate experiment performed on approximately 30 cells for each condition C. Unpaired 2-tailed t test for B, C, E, F, J and K. Two-way ANOVA followed by Tukey’s test for D and G. *P ≤ 0.05, **P ≤ 0.01, ***P ≤ 0.001, ****P ≤ 0.0001, ns (non-significant). For H and J scale bar = 20 µm
Fig. 6
Fig. 6
Combinatorial treatment with TrkA- and EphA2- targeting inhibitor delays tumor growth and survival and block the brain metastasis. A After tumor relapse from MDA-MB-231 HA-TrkA were xenografted in SCID mice treated with Entrectinib and/or EphA2-targeting siRNA 5 times every 2–3 days. B Cleared brain from control xenografted mice was sliced and labeled for laminin (blood vessel, red) and human HLA (MDA-MB-231-TrkA, white). C 3D projection of solvent-cleared brain (blue, autofluorescence) dissected from xenografted SCID mice with MDA-MB-231-TrkA revealed by human HLA immunostaining (white). D Detection of metastatic MDA-MB-231-TrkA (by RT-PCR for the human microglobulin expression) in brain, liver and lung from xenografted SCID mice treated with Entrectinib and/or siEphA2. E Survival of mice xenografted with survival median (red dotted line). All data are derived from the same experimental approach detailed in A. For E, the experiment was performed with 7 mice/group. At the end of this experiment, 1 mouse/group was used for B and C, and 6 mice/group were used for D. Data in E are represented by a staircase graph with median (red dotted line). For E, Mantel-Cox Log-rank analysis was realized, P-value shows the comparison between CTRL and combinatorial treatment. For B, scale bar = 1 mm, and scale bar = 30 µm for C

References

    1. Brosnan EM, Anders CK. Understanding patterns of brain metastasis in breast cancer and designing rational therapeutic strategies. Ann Transl Med. 2018 doi: 10.21037/atm.2018.04.35. - DOI - PMC - PubMed
    1. Deluche E, Antoine A, Bachelot T, Lardy-Cleaud A, Dieras V, Brain E, Debled M, Jacot W, Mouret-Reynier MA, Goncalves A, Dalenc F, Patsouris A, Ferrero JM, Levy C, Lorgis V, Vanlemmens L, Lefeuvre-Plesse C, Mathoulin-Pelissier S, Petit T, Uwer L, Jouannaud C, Leheurteur M, Lacroix-Triki M, Courtinard C, Perol D, Robain M, Delaloge S. Contemporary outcomes of metastatic breast cancer among 22,000 women from the multicentre ESME cohort 2008–2016. Eur J Cancer. 2020 doi: 10.1016/j.ejca.2020.01.016. - DOI - PubMed
    1. Rostami R, Mittal S, Rostami P, Tavassoli F, Jabbari B. Brain metastasis in breast cancer: a comprehensive literature review. J Neurooncol. 2016 doi: 10.1007/s11060-016-2075-3. - DOI - PubMed
    1. Kang Y, Siegel PM, Shu W, Drobnjak M, Kakonen SM, Cordón-Cardo C, Guise TA, Massagué J. A multigenic program mediating breast cancer metastasis to bone. Cancer Cell. 2003 doi: 10.1016/s1535-6108(03)00132-6. - DOI - PubMed
    1. Van’t Veer LJ, Dai H, Van de Vijver MJ, He YD, Hart AA, Mao M, Peterse HL, Van der Kooy K, Marton MJ, Witteveen AT, Schreiber GJ, Kerkhoven RM, Roberts C, Linsley PS, Bernards R, Friend SH. Gene expression profiling predicts clinical outcome of breast cancer. Nature. 2002 doi: 10.1038/415530a. - DOI - PubMed

LinkOut - more resources