. 2023 Oct 13;6(1):100936.
doi: 10.1016/j.jhepr.2023.100936. eCollection 2024 Jan.

SARS-CoV-2 receptor ACE2 is upregulated by fatty acids in human MASH

Affiliations

SARS-CoV-2 receptor ACE2 is upregulated by fatty acids in human MASH

Luis Cano et al. JHEP Rep. .

Abstract

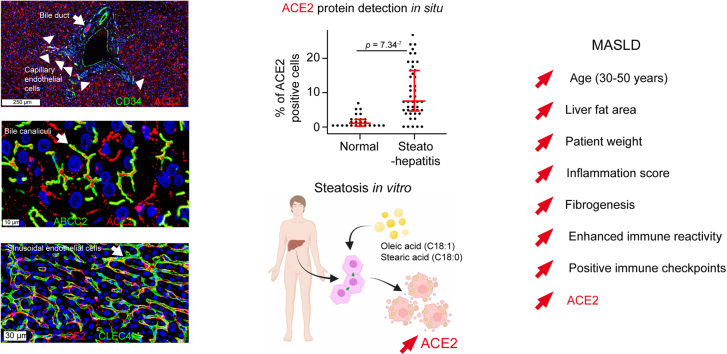
Background & aims: Metabolic dysfunction-associated steatotic liver disease (MASLD) results in steatosis, inflammation (steatohepatitis), and fibrosis. Patients with MASLD more likely develop liver injury in coronavirus disease 2019 (COVID-19), caused by the severe acute respiratory syndrome coronavirus 2 (SARS-CoV-2). As viral RNA has been identified in liver tissues, we studied expression levels and cellular sources of the viral receptor angiotensin-converting enzyme 2 (ACE2) and coreceptors in MASLD and fibroinflammatory liver diseases.

Methods: We built a transcriptomic MASLD meta-dataset (N = 243) to study SARS-CoV-2 receptor expression and verified results in 161 additional cases of fibroinflammatory liver diseases. We assessed the fibroinflammatory microenvironment by deconvoluting immune cell populations. We studied the cellular sources of ACE2 by multiplex immunohistochemistry followed by high-resolution confocal microscopy (N = 9 fatty livers; N = 7 controls), meta-analysis of two single-cell RNA sequencing datasets (N = 5 cirrhotic livers; N = 14 normal livers), and bulk transcriptomics from 745 primary cell samples. In vitro, we tested ACE2 mRNA expression in primary human hepatocytes treated with inflammatory cytokines, bacterial lipopolysaccharides, or long-chain fatty acids.

Results: We detected ACE2 at the apical and basal poles of hepatocyte chords, in CLEC4M+ liver sinusoidal endothelial cells, the lumen of ABCC2+ bile canaliculi, HepPar-1+-TMPRSS2+ hepatocytes, cholangiocytes, and CD34+ capillary vessels. ACE2 steeply increased between 30 and 50 years of age; was related to liver fat area, inflammation, high immune reactivity, and fibrogenesis; and was upregulated in steatohepatitis. Although ACE2 mRNA was unmodified in alcoholic or viral hepatitis, it was upregulated in fibroinflammatory livers from overweight patients. In vitro, treatment of primary human hepatocytes with inflammatory cytokines alone downregulated but long chain fatty acids upregulated ACE2 mRNA expression.

Conclusions: Lipid overload in fatty liver disease leads to an increased availability of ACE2 receptors.

Impact and implications: COVID-19 can be a deadly disease in vulnerable individuals. Patients with fatty liver disease are at a higher risk of experiencing severe COVID-19 and liver injury. Recent studies have indicated that one of the reasons for this vulnerability is the presence of a key cell surface protein called ACE2, which serves as the main SARS-CoV-2 virus receptor. We describe the cellular sources of ACE2 in the liver. In patients with fatty liver disease, ACE2 levels increase with age, liver fat content, fibroinflammatory changes, enhanced positive immune checkpoint levels, and innate immune reactivity. Moreover, we show that long chain fatty acids can induce ACE2 expression in primary human hepatocytes. Understanding the cellular sources of ACE2 in the liver and the factors that influence its availability is crucial. This knowledge will guide further research and help protect potentially vulnerable patients through timely vaccination boosters, dietary adjustments, and improved hygiene practices.

Keywords: CLEC4M; DC-SIGNR; DPP4; MAFLD; Metabolic syndrome; Metabolism; NAFLD; NASH; Oleic acid; SARS-CoV-2; Stearic acid; TMPRSS2.


Conflict of interest statement

The authors of this study declare that they do not have any conflict of interest. Please refer to the accompanying ICMJE disclosure forms for further details.

Figures

None
Graphical abstract
Fig. 1
Fig. 1
Increased expression of ACE2 in steatohepatitis. (A) ACE2-positive bile ducts (brown signal, arrowheads), enlarged PTs with inflammatory infiltrates, and incomplete fibrous septa outlining parenchymal nodules with variable levels of ACE2 staining (asterisk). (B) Steatohepatitis with predominantly ACE2-positive hepatocytes: ACE2-positive bile ducts (black arrowhead), macrovesicular steatosis with predominantly ACE2-positive hepatocytes (asterisk), and sparsely ACE2-positive sinusoidal cells (green arrowheads). (C and D) Macrovesicular steatosis with predominantly ACE2-positive staining in sinusoidal cells (green arrowheads) and bile ducts (black arrowheads). (E) PT with inflammatory infiltration and ductular reaction (black arrowheads). ACE2-positive cord-like structures resembling blood vessels (green arrowheads) are seen at the interface between the limiting plate and the parenchyma. Sinusoids are lined by ACE2-positive cells (red arrowheads). Digital slides were acquired in a microscope scanner using a 40× objective. (F) Percentage of ACE2-positive cells in normal liver controls (n = 5) and steatohepatitis (n = 9). From each patient, five ACE2-positive 1-mm2 hotspots were selected for image analysis. Each dot represents one hotspot; whisker bars show median plus first and third quartiles. The Mann–Whitney U test was used to assess statistical significance. Clinical data, and MASLD and MASH scores are shown in Table S1. ACE2, angiotensin-converting enzyme 2; PT, portal tract.
Fig. 2
Fig. 2
ACE2 in sinusoidal endothelial cells in (A–C) normal liver and (D–F) steatohepatitis. ACE2-positive signal (red) colocalises with the liver sinusoidal endothelial cell marker CLEC4M (also known as DC-SIGNR) (green) lining the sinusoidal endothelium. In normal liver, sparse ACE2-positive sinusoidal cell spots are seen at low power (white arrowheads). Bile ducts show strong ACE2 signal (white arrows). In steatohepatitis, a high density of ACE2-positive sinusoidal cells is observed. (G–I) Higher power view of ACE2 expression in the sinusoidal endothelium in steatohepatitis. Nuclei are seen in blue (DAPI). Digital slides were acquired using a 40× objective in a confocal scanner. The images show a Z-stack of four 500-nm focusing steps. ACE2, angiotensin-converting enzyme 2; CLEC4M, C-type lectin domain family 4 member M.
Fig. 3
Fig. 3
ACE2 in (A–C) CD34-positive capillary endothelial cells and (D–F) bile canaliculi. (A–C) Steatohepatitis. CD34-positive endothelial cells (green, arrowheads) within portal tracts and at the interface between the limiting plate and the parenchyma are ACE2-positive (red, arrowheads). (D–F) Bile canaliculi, identified with the specific marker ABCC2 (also known as MRP2) (green), contain ACE2 (red). Digital slides were acquired using a 40× objective in a confocal scanner. The image shows a Z-stack of four 500-nm focusing steps. ABCC2, ATP binding cassette subfamily C member 2; ACE2, angiotensin-converting enzyme 2; MRP2, multidrug resistance-associated protein 2.
Fig. 4
Fig. 4
ACE2 mRNA expression increases proportionally with age, fat content, inflammation, and fibrogenesis in 243 patients with fatty liver disease. Meta-dataset constructed from three independent datasets (GSE33814, GSE48452, and GSE83452). After quantile normalisation and batch effect suppression, it was composed 243 liver samples (27 normal controls, 27 obese, 33 steatoses, 144 MASHs, and 12 steatohepatitides) and 20,941 different RNA transcripts. (A) ACE2 is associated with the fibrogenesis markers COL1A1, COL3A1, and VCAN, and basement membrane remodelling markers COL4A1 and LAMC1. ANOVA followed by Tukey’s post hoc test was used (∗∗p <0.01, ∗∗∗p <0.001, ∗∗∗∗p <0.0001; asterisks compare pathological conditions with controls). For each gene, the numbers of available observations are indicated in Table S4. (B) ACE2 mRNA expression is associated with increasing age, liver biopsy fat area, and inflammation score in 72 patients from the GSE48452 dataset. (C and D) The fibrogenesis markers COL1A1, COL3A1, and VCAN are associated with increasing liver fat area (C) and inflammation (D). ACE2, angiotensin-converting enzyme 2; MASH, metabolic dysfunction-associated steatohepatitis.
Fig. 5
Fig. 5
Enhanced immune reactivity in steatohepatitis: antigen presentation, CD4 T-cell activation, and checkpoint modulation. (A) Immune cell subsets in 44 human liver samples from the GSE33814 dataset (13 controls, 19 steatoses, and 12 steatohepatitides) are classified into four immunogenicity functional families: MHC, effector cells, suppressor cells, and checkpoints. Enhancement and suppression of immune reactivity are indicated by+ and , respectively. Parameters’ full names and gene symbols are indicated in Table S5. Steatohepatitis shows enhancement of MHC (HLA-F, HLA-DPA1, HLA-B, HLA-A, and TAP2) and two positive immunomodulators (CD27 and ICOS), with moderate activation of CD4 T cells and downregulation of the checkpoint inhibitor TIGIT. Statistical significances are shown in Table S6. (B) Fatty liver disease samples from the GSE33814 dataset show increased expression of molecular markers for neutrophils, macrophages, dendritic cells, NK cells, and B and T cells. Decreased expression of KLRF1 indicates NK cell activation. ANOVA was followed by Tukey’s post hoc test to assess the statistical significance of the difference between control and steatosis or steatohepatitis (∗p <0.05, ∗∗p <0.01, ∗∗∗p <0.001, ∗∗∗∗p <0.0001). MHC, major histocompatibility complex; NK, natural killer.
Fig. 6
Fig. 6
ACE2 mRNA expression is upregulated in chronic fibroinflammatory liver diseases resulting from alcohol abuse or viral hepatitis in a context of patient overweight. (A) ACE2 in 41 non-tumour livers from TCGA dataset according to the grading of inflammatory activity and fibrosis, as assessed by METAVIR scoring. Inflammation scores: low (0–1) and high (2–3). Fibrosis scores: low (0–1–2) and high (3–4). BMI was available for 30/41 patients; 60% of patients (18/30) had a BMI >23 (overweight). The indicated markers of fibrogenesis correlate with ACE2 expression. Case scoring is shown in Table S8. Statistical significance of the differences between low and high were assessed using the Mann–Whitney U test. (B) Discriminant function analysis shows the percent of variance in ACE2 mRNA levels explained by fibrosis (METAVIR F), inflammation (METAVIR A), and BMI in 41 patients. Smaller values of Wilk’s lambda indicate greater discriminatory ability of the function. Inclusion of BMI increases the discriminatory ability of the model. (C) ACE2 mRNA levels are correlated with the markers of hepatocyte metabolism OTC and GLS2 in 30 patients with steatohepatitis. ACE2, angiotensin-converting enzyme 2; MASLD, metabolic dysfunction-associated steatotic liver disease; TCGA, The Cancer Genome Atlas.
Fig. 7
Fig. 7
ACE2 expression is induced by fatty acids in primary human hepatocytes in vitro. (A) Multiple discriminant analysis showing the proportion of variance in the MASLD meta-dataset explained by ACE2 and the markers of inflammation IL-1B, IL-6, and TNF. The curve slopes show that ACE2 accounts for the highest variance in steatohepatitis. Vertical bars indicate 95% CIs. (B) Multiple discriminant analysis showing the percent of variance in the MASLD meta-dataset explained by ACE2 and the markers of steatosis APOA4 and PLIN2. Vertical bars indicate 95% confidence intervals. (C) Schematic outline of in vitro induction of steatosis with fatty acids in primary human hepatocytes. Oleic acid alone is used to induce steatosis, whereas oleic and stearic acid together are used to model MASH-like metabolic effects. Cartoon constructed using BioRender (https://biorender.com/). (D) Representative images of primary human hepatocytes treated with 150 μM oleic acid (C18:1) or oleic plus stearic acids (C18:1 + C18:0; 150 μM each) for 1 week and labelled with the lipid stain Bodipy 493/503 (green) and the nuclear stain Hoechst (blue). The Bodipy/Hoechst ratio indicates fatty acid accumulation in hepatocytes. Asterisks indicate statistical differences with control (∗∗∗p <0.001, ∗∗∗∗p <0.0001). (E) Primary human hepatocytes from three patients were treated with 150 μM oleic acid (C18:1) or oleic plus stearic acids (C18:1 + C18:0; 150 μM each) for 1 week. Hepatocytes were seeded and treated in duplicate wells. RNA from each well was analysed in duplicate by real-time RT-PCR using the 2–ΔΔCt method. Bars show means ± SD from three patients. Statistical intergroup differences were assessed using KW ANOVA as indicated, followed by Dunn’s post hoc multiple comparison test between control and fatty acid-treated wells. High PLIN2, a protein that coats lipid droplets, confirms the presence of steatosis. ACE2, angiotensin-converting enzyme 2; KW, Kruskal–Wallis; MASLD, metabolic dysfunction-associated steatotic liver disease; MASH, metabolic dysfunction-associated steatohepatitis; PLIN2, perilipin 2; TCGA, The Cancer Genome Atlas.

References

    1. Eslam M., Sanyal A.J., George J. MAFLD: a consensus-driven proposed nomenclature for metabolic associated fatty liver disease. Gastroenterology. 2020;158:1999–2014.e1991. - PubMed
    1. Eslam M., Newsome P.N., Sarin S.K., et al. A new definition for metabolic dysfunction-associated fatty liver disease: an international expert consensus statement. J Hepatol. 2020;73:202–209. - PubMed
    1. Rinella M.E., Lazarus J.V., Ratziu V., et al. A multi-society Delphi consensus statement on new fatty liver disease nomenclature. J Hepatol. 2023 in press. - PubMed
    1. Huang R., Zhu L., Wang J., et al. Clinical features of COVID-19 patients with non-alcoholic fatty liver disease. Hepatol Commun. 2020;4:1758–1768. - PMC - PubMed
    1. Ghoneim S., Butt M.U., Hamid O., et al. The incidence of COVID-19 in patients with metabolic syndrome and non-alcoholic steatohepatitis: a population-based study. Metabol Open. 2020;8 - PMC - PubMed