. 2023 Nov 21:13:1186858.
doi: 10.3389/fonc.2023.1186858. eCollection 2023.

Construction of a prognostic 6-gene signature for breast cancer based on multi-omics and single-cell data

Affiliations

Construction of a prognostic 6-gene signature for breast cancer based on multi-omics and single-cell data

Zeyu Xing et al. Front Oncol. .

Abstract

Background: Breast cancer (BC) is one of the females' most common malignant tumors there are large individual differences in its prognosis. We intended to uncover novel useful genetic biomarkers and a risk signature for BC to aid determining clinical strategies.

Methods: A combined significance (p combined) was calculated for each gene by Fisher's method based on the RNA-seq, CNV, and DNA methylation data from TCGA-BRCA. Genes with a p combined< 0.01 were subjected to univariate cox and Lasso regression, whereby an RS signature was established. The predicted performance of the RS signature would be assessed in GSE7390 and GSE20685, and emphatically analyzed in triple-negative breast cancer (TNBC) patients, while the expression of immune checkpoints and drug sensitivity were also examined. GSE176078, a single-cell dataset, was used to validate the differences in cellular composition in tumors between TNBC patients with different RS.

Results: The RS signature consisted of C15orf52, C1orf228, CEL, FUZ, PAK6, and SIRPG showed good performance. It could distinguish the prognosis of patients well, even stratified by disease stages or subtypes and also showed a stronger predictive ability than traditional clinical indicators. The down-regulated expressions of many immune checkpoints, while the decreased sensitivity of many antitumor drugs was observed in TNBC patients with higher RS. The overall cells and lymphocytes composition differed between patients with different RS, which could facilitate a more personalized treatment.

Conclusion: The six genes RS signature established based on multi-omics data exhibited well performance in predicting the prognosis of BC patients, regardless of disease stages or subtypes. Contributing to a more personalized treatment, our signature might benefit the outcome of BC patients.

Keywords: biomarker; breast cancer; multi-omics; prognosis; risk score; triple-negative breast cancer.


Conflict of interest statement

YH and ZM were employees by Beijing ChosenMed Clinical Laboratory. The remaining authors declare that the research was conducted in the absence of any commercial or financial relationships that could be construed as a potential conflict of interest.

Figures

Figure 1
Figure 1
Workflow of this study.
Figure 2
Figure 2
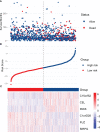
Distribution of RS, survival status, and the expression of six hub genes in the training set. (A) The scatter plot shows the distribution of patients’ survival status in the high-risk and low-risk subgroups. (B) The distribution of RS in the patients of the training set. (C) The heatmap shows the expression of the six hub genes in high-risk and low-risk patients.
Figure 3
Figure 3
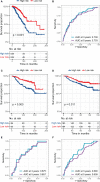
The predictive performance of the six genes RS signature. (A, B) K-M analysis and survival curve show significant differences in the survival between high-risk and low-risk subgroups, and ROC curve shows the prognostic value of RS for predicting the 3- and 5-years cut-off OS in the training set (TCGA dataset). (C, D) K-M analyses and survival curves show significant differences in the survival between high-risk and low-risk subgroups GSE7390 (C) and GSE20685 (D). (E, F) ROC curves show the prognostic value of RS for predicting the 3- and 5-years cut-off OS in GSE7390 (E) and GSE20685 (F).
Figure 4
Figure 4
The comparison of RS with other clinical indicators in predicting the prognosis of BC patients. (A, B) The ROCs show that the RS has a larger AUC than other clinical indicators, whether in predicting the 3 years cut-off OS (A) or 5 years cut-off OS (B). (C, D) The DCAs show that the RS has a larger AUDCs than other clinical indicators, whether at 3 years (C) or 5 years (D), indicating the value of RS in clinical decision making. (E) Nomogram shows the performance of age, T, N, M, and RS in predicting the prognosis of BC patients in the multivariate cox regression analysis.
Figure 5
Figure 5
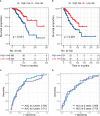
The predictive performance of the six genes RS signature in different stages of patients from the training set. (A, B) K-M analyses and survival curves show significant differences in survival between high-risk and low-risk subgroups, whether in patients at stages I and II (A) or III and IV (B). (C, D) ROC curves show the prognostic value of RS for predicting the 3- and 5-years cut-off OS, whether in patients at stage I and II (C) or III and IV (D).
Figure 6
Figure 6
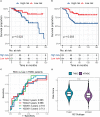
The predictive performance of the six genes RS signature in TNBC patients from the training set or GSE103091 and the distribution of RS in TNBC and NTNBC patients in the training set. (A, B) KM analyses and survival curves show significant differences in the survival between high-risk and low-risk subgroups, whether in patients from the training set (A) or the GSE103091 (B). (C) ROC curves show the prognostic value of RS for predicting the 3- and 5-years cut-off OS, whether in patients from the training set or the GSE103091. (D) The Violin plot shows that the TNBC patients had a higher RS than NTNBC patients. (****p ≤ 0.0001).
Figure 7
Figure 7
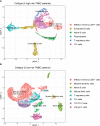
Composition of lymphocytes in nine TNBC patients and their RS subgroups. (A) Composition of lymphocytes in nine TNBC patients. (B) Composition of lymphocytes in patients with high RS. Some subpopulations of T cells in these patients had low numbers. (C) Composition of lymphocytes in patients with low RS. An abundance of multiple subpopulations of T cells was found in these patients.
Figure 8
Figure 8
Composition of lymphocytes in patients with different RS when analyzed separately. (A) Composition of lymphocytes in patients with high RS. There was a high percentage of B cells among lymphocytes. (B) Composition of lymphocytes in patients with low RS. There was an absolute predominance of T cells among lymphocytes.
Figure 9
Figure 9
Drug sensitivity of TNBC patients in the training set (TCGA) and GSE103091. (A) The distribution of IC50 of BI2536, Camptothecin, Epirubicin, and Vinnorelbine in TNBC patients from the training set. (B) The distribution of IC50 of BI2536, Camptothecin, Epirubicin, and Vinnorelbine in TNBC patients from GSE103091. (*p ≤ 0.05, **p ≤ 0.01, ***p ≤ 0.001, ****p ≤ 0.0001).

References

    1. Harbeck N, Gnant M. Breast cancer. Lancet (2017) 389(10074):1134–50. doi: 10.1016/S0140-6736(16)31891-8 - DOI - PubMed
    1. Sung H, Ferlay J, Siegel RL, Laversanne M, Soerjomataram I, Jemal A, et al. . Global cancer statistics 2020: GLOBOCAN estimates of incidence and mortality worldwide for 36 cancers in 185 countries. CA Cancer J Clin (2021) 71(3):209–49. doi: 10.3322/caac.21660 - DOI - PubMed
    1. Fan L, Strasser-Weippl K, Li JJ, St Louis J, Finkelstein DM, Yu KD, et al. . Breast cancer in China. Lancet Oncol (2014) 15(7):e279–89. doi: 10.1016/S1470-2045(13)70567-9 - DOI - PubMed
    1. Yin L, Duan JJ, Bian XW, Yu SC. Triple-negative breast cancer molecular subtyping and treatment progress. Breast Cancer Res (2020) 22(1):61. doi: 10.1186/s13058-020-01296-5 - DOI - PMC - PubMed
    1. Huang S, Chaudhary K, Garmire LX. More is better: recent progress in multi-omics data integration methods. Front Genet (2017) 8:84. doi: 10.3389/fgene.2017.00084 - DOI - PMC - PubMed

LinkOut - more resources