. 2023 Nov 23:14:1268944.
doi: 10.3389/fmicb.2023.1268944. eCollection 2023.

Mitochondrial genome diversity across the subphylum Saccharomycotina

Affiliations

Mitochondrial genome diversity across the subphylum Saccharomycotina

John F Wolters et al. Front Microbiol. .

Abstract

Introduction: Eukaryotic life depends on the functional elements encoded by both the nuclear genome and organellar genomes, such as those contained within the mitochondria. The content, size, and structure of the mitochondrial genome varies across organisms with potentially large implications for phenotypic variance and resulting evolutionary trajectories. Among yeasts in the subphylum Saccharomycotina, extensive differences have been observed in various species relative to the model yeast Saccharomyces cerevisiae, but mitochondrial genome sampling across many groups has been scarce, even as hundreds of nuclear genomes have become available.

Methods: By extracting mitochondrial assemblies from existing short-read genome sequence datasets, we have greatly expanded both the number of available genomes and the coverage across sparsely sampled clades.

Results: Comparison of 353 yeast mitochondrial genomes revealed that, while size and GC content were fairly consistent across species, those in the genera Metschnikowia and Saccharomyces trended larger, while several species in the order Saccharomycetales, which includes S. cerevisiae, exhibited lower GC content. Extreme examples for both size and GC content were scattered throughout the subphylum. All mitochondrial genomes shared a core set of protein-coding genes for Complexes III, IV, and V, but they varied in the presence or absence of mitochondrially-encoded canonical Complex I genes. We traced the loss of Complex I genes to a major event in the ancestor of the orders Saccharomycetales and Saccharomycodales, but we also observed several independent losses in the orders Phaffomycetales, Pichiales, and Dipodascales. In contrast to prior hypotheses based on smaller-scale datasets, comparison of evolutionary rates in protein-coding genes showed no bias towards elevated rates among aerobically fermenting (Crabtree/Warburg-positive) yeasts. Mitochondrial introns were widely distributed, but they were highly enriched in some groups. The majority of mitochondrial introns were poorly conserved within groups, but several were shared within groups, between groups, and even across taxonomic orders, which is consistent with horizontal gene transfer, likely involving homing endonucleases acting as selfish elements.

Discussion: As the number of available fungal nuclear genomes continues to expand, the methods described here to retrieve mitochondrial genome sequences from these datasets will prove invaluable to ensuring that studies of fungal mitochondrial genomes keep pace with their nuclear counterparts.

Keywords: diversity; evolution; mitochondria; selection; yeast.


Conflict of interest statement

AR is a scientific consultant for LifeMine Therapeutics, Inc. The remaining authors declare that the research was conducted in the absence of any commercial or financial relationships that could be construed as a potential conflict of interest. The author(s) declared that they were an editorial board member of Frontiers, at the time of submission. This had no impact on the peer review process and the final decision.

Figures

Figure 1
Figure 1
Mitochondrial contig profile. The coverage and length profile of contigs from 196 assemblies newly sequenced in (Shen et al., 2018) that were flagged as putative mitochondrial contigs versus all other contigs is displayed (log10 scaling). The most useful mitochondrial contigs generally have a profile of elevated coverage with sizes between 10 and 100 kb, a combination rarely found in other contigs, although strict diagnostic cutoffs are not evident. Many poor-quality putative mitochondrial contigs were found in nuclear genome assemblies, but these were not present in mitochondrially-focused reassemblies.
Figure 2
Figure 2
Mitochondrial genome counts by taxonomic order. The count of genomes for both newly added and existing genomes from public repositories are displayed according to taxonomic order (classifications recently described by Groenewald et al., 2023). For nearly all orders, a majority of genomes are new [barring Saccharomycetales (35 new versus 35 existing) and Serinales (53 new versus 58 existing)].
Figure 3
Figure 3
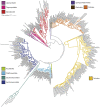
Mitochondrial phylogeny of 353 budding yeasts. A phylogenetic tree was built from the protein sequences of the core protein-coding genes shared by all 353 budding yeast species analyzed (COX1, COX2, COX3, ATP6, ATP8, ATP9, and COB). Branches are colored based on taxonomic order.
Figure 4
Figure 4
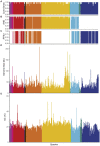
Genome characteristics. Genome characteristics are displayed and colored according to taxonomic order and placed based on position in the phylogenetic tree (left to right from Lipomycetales to Saccharomycetales, see Figure 3). The proportion of genes found in each genome are shown for: (A) core genes (COX1, COX2, COX3, ATP6, ATP8, ATP9, and COB), (B) Complex I genes (NAD1-NAD6, and NAD4L), and (C) the RPS3 gene encoding a ribosomal protein. Genome sizes (D) and GC content (E) are indicated; both maintain a fairly limited range across the subphylum with a handful of extremes present across multiple taxonomic orders.
Figure 5
Figure 5
Mean ω of core genes. The ratio of non-synonymous to synonymous substitution rates for each of the core protein-coding genes was calculated for groups across the phylogeny (+ indicates that additional closely related species that are not currently classified in that genus were included, see Supplementary Table 1). The box and whisker plots show the distribution of ω among genes within each group (boxes centered at median encompassing the interquartile range, whiskers up to 1.5 times the interquartile range, and outlier genes shown as individual datapoints). Two extreme outlier genes were omitted from the graph: ATP8 for Saccharomyces (0.355) and COB for Kurtzmaniella (0.250). Groups with aerobic fermenters, such as Saccharomyces, Kazachstania, and Nakaseomyces, do not exhibit significantly elevated ratios relative to the rest of the subphylum.
Figure 6
Figure 6
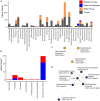
Intron diversity. (A) Introns were classified based on pairwise BLAST hits as unique to that species, present in multiple species of the group, shared within and between groups, or only between groups. The counts of introns in each category within each group are displayed. (B) The counts of introns in each taxonomic order that were shared or found only between groups are displayed. Orders not listed had no introns in these categories. (C) Introns were clustered based on shared BLAST hits, and the single cluster containing hits shared across multiple genes is displayed. Nodes are colored based on taxonomic order as in Figure 2 (all Serinales). (D) A cluster of introns is displayed that spans the orders Saccharomycetales and Saccharomycodales, including Saccharomyces spp., Lachancea kluyveri, and Hanseniaspora vineae. Nodes are colored based on taxonomic order as in Figure 3.

Update of

Similar articles

Cited by

References

    1. Adams K. L., Palmer J. D. (2003). Evolution of mitochondrial gene content: gene loss and transfer to the nucleus. Mol. Phylogenet. Evol. 29, 380–395. doi: 10.1016/S1055-7903(03)00194-5, PMID: - DOI - PubMed
    1. Antipov D., Hartwick N., Shen M., Raiko M., Lapidus A., Pevzner P. A. (2016). PlasmidSPAdes: assembling plasmids from whole genome sequencing data. Bioinformatics 32, 3380–3387. doi: 10.1093/bioinformatics/btw493 - DOI - PubMed
    1. Barreto F. S., Watson E. T., Lima T. G., Willett C. S., Edmands S., Li W., et al. . (2018). Genomic signatures of mitonuclear coevolution across populations of Tigriopus californicus. Nat. Ecol. Evol. 2, 1250–1257. doi: 10.1038/s41559-018-0588-1, PMID: - DOI - PubMed
    1. Bergsten J. (2005). A review of long-branch attraction. Cladistics 21, 163–193. doi: 10.1111/j.1096-0031.2005.00059.x, PMID: - DOI - PubMed
    1. Biot-Pelletier D., Bettinazzi S., Gagnon-Arsenault I., Dubé A. K., Bédard C., Nguyen T. H. M., et al. . (2023). Evolutionary trajectories are contingent on mitonuclear interactions. Mol. Biol. Evol. 40, 1–16. doi: 10.1093/molbev/msad061, PMID: - DOI - PMC - PubMed