. 2023 Dec 6;5(6):fcad282.
doi: 10.1093/braincomms/fcad282. eCollection 2023.

Subthalamic nucleus shows opposite functional connectivity pattern in Huntington's and Parkinson's disease

Affiliations

Subthalamic nucleus shows opposite functional connectivity pattern in Huntington's and Parkinson's disease

Stefania Evangelisti et al. Brain Commun. .

Abstract

Huntington's and Parkinson's disease are two movement disorders representing mainly opposite states of the basal ganglia inhibitory function. Despite being an integral part of the cortico-subcortico-cortical circuitry, the subthalamic nucleus function has been studied at the level of detail required to isolate its signal only through invasive studies in Huntington's and Parkinson's disease. Here, we tested whether the subthalamic nucleus exhibited opposite functional signatures in early Huntington's and Parkinson's disease. We included both movement disorders in the same whole-brain imaging study, and leveraged ultra-high-field 7T MRI to achieve the very fine resolution needed to investigate the smallest of the basal ganglia nuclei. Eleven of the 12 Huntington's disease carriers were recruited at a premanifest stage, while 16 of the 18 Parkinson's disease patients only exhibited unilateral motor symptoms (15 were at Stage I of Hoehn and Yahr off medication). Our group comparison interaction analyses, including 24 healthy controls, revealed a differential effect of Huntington's and Parkinson's disease on the functional connectivity at rest of the subthalamic nucleus within the sensorimotor network, i.e. an opposite effect compared with their respective age-matched healthy control groups. This differential impact in the subthalamic nucleus included an area precisely corresponding to the deep brain stimulation 'sweet spot'-the area with maximum overall efficacy-in Parkinson's disease. Importantly, the severity of deviation away from controls' resting-state values in the subthalamic nucleus was associated with the severity of motor and cognitive symptoms in both diseases, despite functional connectivity going in opposite directions in each disorder. We also observed an altered, opposite impact of Huntington's and Parkinson's disease on functional connectivity within the sensorimotor cortex, once again with relevant associations with clinical symptoms. The high resolution offered by the 7T scanner has thus made it possible to explore the complex interplay between the disease effects and their contribution on the subthalamic nucleus, and sensorimotor cortex. Taken altogether, these findings reveal for the first time non-invasively in humans a differential, clinically meaningful impact of the pathophysiological process of these two movement disorders on the overall sensorimotor functional connection of the subthalamic nucleus and sensorimotor cortex.

Keywords: Huntington’s; Parkinson’s; differential effect; functional connectivity; subthalamic nucleus.


Conflict of interest statement

The authors report no competing interests.

Figures

Graphical Abstract
Graphical Abstract
Figure 1
Figure 1
Average functional connectivity in the sensorimotor network. (A) The sensorimotor template map resulting from group-ICA is shown in red-yellow (P < 0.05). (B–E) The corresponding sensorimotor t-value map for each individual group average (Student’s t > 2.3) are shown: healthy control group matched to the HD group (HCHD) in green (B), healthy control group matched to the PD group (HCPD) group in green (C), Huntington’s disease (HD) carriers in pink (D) and Parkinson’s disease (PD) participants in blue (E). Radiological orientation (left is right).
Figure 2
Figure 2
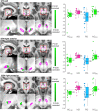
Within the entire sensorimotor functional network (shown in Fig. 1), Huntington’s disease (HD) and Parkinson’s disease (PD) demonstrate opposite functional connectivity in the subthalamic nucleus (STN). Left panel, three distinct clusters of significant (corrected using false discovery rate) group comparison results (in green) were found within the STN (in pink): the left STN, and the anterior and posterior regions of the right STN, the latter at the border with the substantia nigra pars reticulata (higher functional connectivity in HD compared with its corresponding matched healthy control group HCHD, lower functional connectivity in PD compared with its matched control group HCPD), based on multiple regressions and Student’s t-tests. For visualisation purposes clusters are shown at P < 0.05. Right panel, box plots based on functional connectivity values (parameter estimates) extracted from the significant STN clusters shown on the left (a.u.). Radiological orientation.
Figure 3
Figure 3
Within the entire sensorimotor functional network (shown in Fig. 1), Huntington’s disease (HD) and Parkinson’s disease (PD) demonstrate opposite functional connectivity in the sensorimotor cortex. Significant ANOVA group comparison results (in red) whereby HD and PD showed opposite differences (lower functional connectivity in HD compared with its corresponding matched healthy control group HCHD, higher functional connectivity in PD compared with its matched control group HCPD) from their respective control groups were found in the sensorimotor cortex region of interest. Left panel, significant (P < 0.05, corrected using threshold-free cluster enhancement) functional connectivity sensorimotor cortical results, based on multiple regressions and Student’s t-tests. Right panel, the corresponding box plots (parameter estimates, a.u.). Radiological orientation.
Figure 4
Figure 4
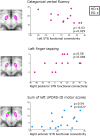
Examples of correlation plots between significant functional connectivity values in each subthalamic nucleus (STN) cluster and clinical measures. In pink, two top associations within the Huntington’s disease (HD) group: between left STN functional connectivity and categorical verbal fluency, and between right posterior STN functional connectivity and left hand finger tapping. In blue, one top association within the Parkinson’s disease (PD) group: between STN right anterior functional connectivity and the sum of all the left-lateralised motor scores in the unified Parkinson’s disease rating scale UPDRS-III, based on ρ (rho) values from Table 2 (Spearman’s rank correlation coefficient).

References

    1. Alexander GE, Crutcher MD. Functional architecture of basal ganglia circuits: Neural substrates of parallel processing. Trends Neurosci. 1990;13(7):266–271. - PubMed
    1. DeLong MR. Primate models of movement disorders of basal ganglia origin. Trends Neurosci. 1990;13(7):281–285. - PubMed
    1. Nambu A. Seven problems on the basal ganglia. Curr Opin Neurobiol. 2008;18(6):595–604. - PubMed
    1. Miocinovic S, de Hemptinne C, Chen W, et al. . Cortical potentials evoked by subthalamic stimulation demonstrate a short latency hyperdirect pathway in humans. J Neurosci. 2018;38(43):9129–9141. - PMC - PubMed
    1. Kravitz DJ, Saleem KS, Baker CI, Mishkin M. A new neural framework for visuospatial processing. Research support, N.I.H., intramural review. Nat Rev Neurosci. 2011;12(4):217–230. - PMC - PubMed

LinkOut - more resources