[Preprint]. 2023 Dec 2:2023.11.30.569508.
doi: 10.1101/2023.11.30.569508.

CTCF-mediated 3D chromatin predetermines the gene expression program in the male germline

Affiliations

CTCF-mediated 3D chromatin predetermines the gene expression program in the male germline

Yuka Kitamura et al. bioRxiv. .

Update in

Abstract

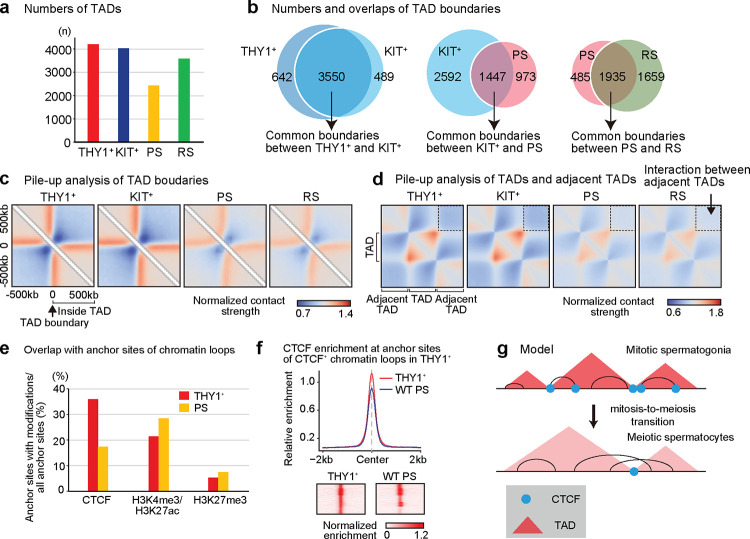
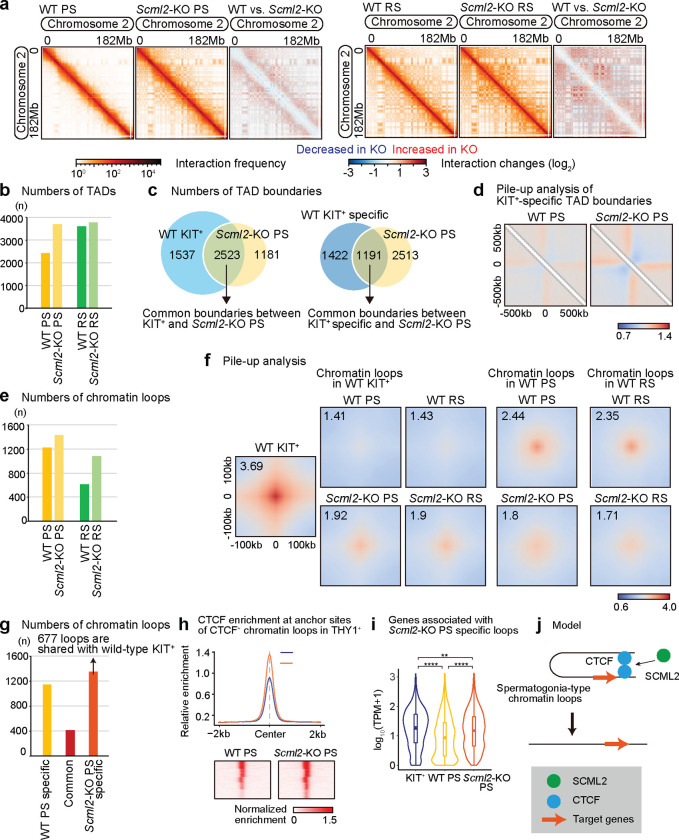
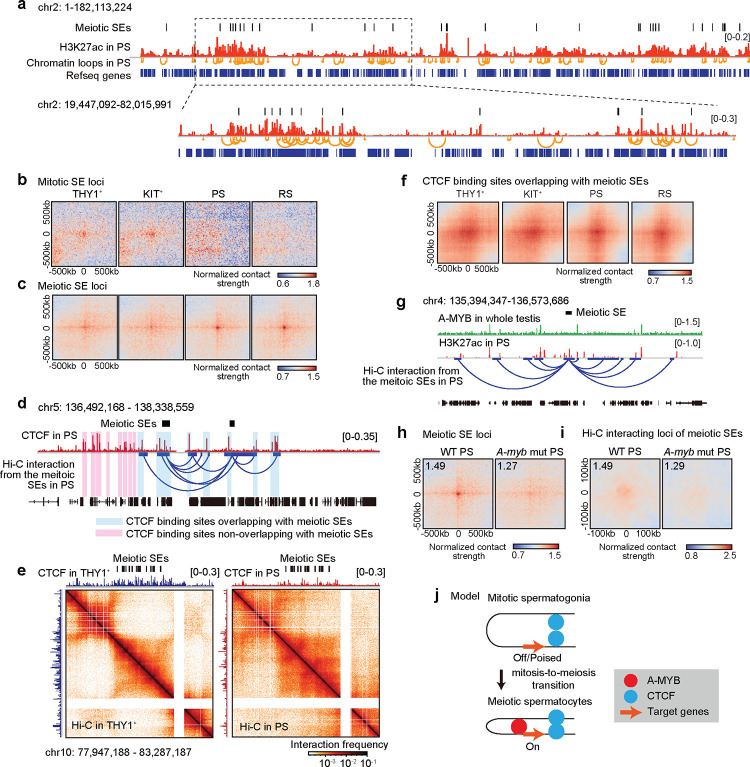
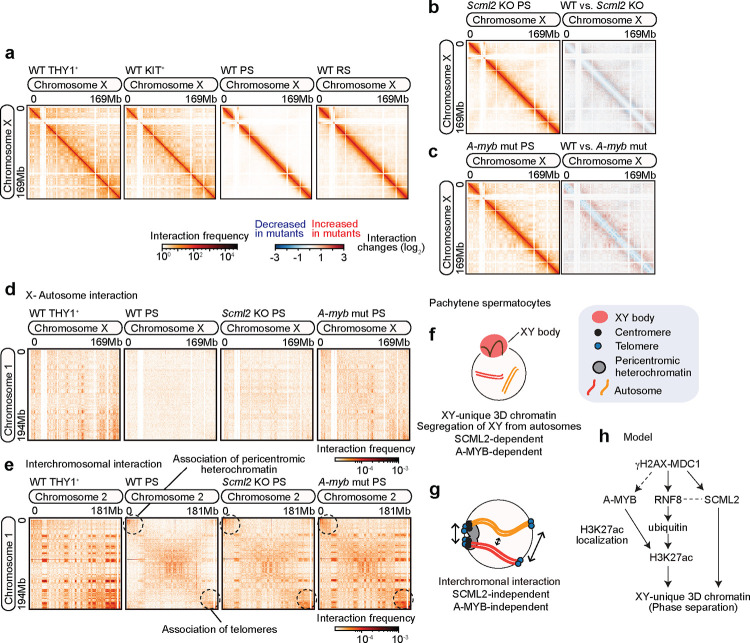
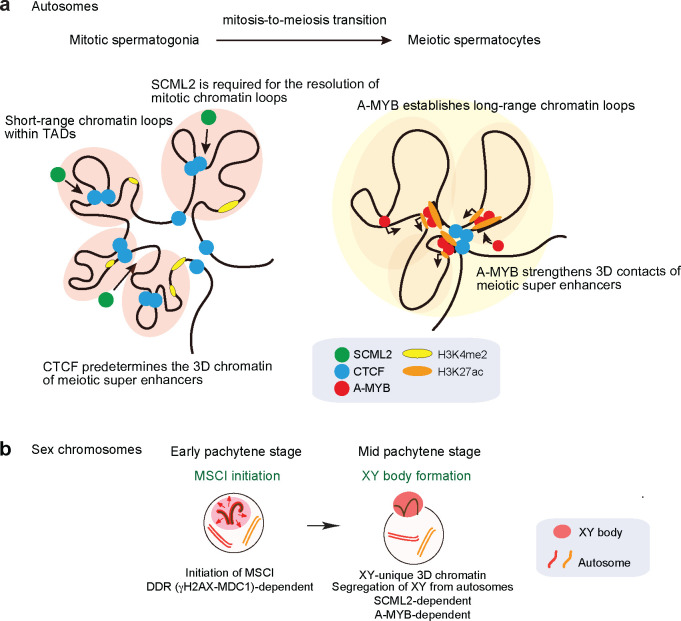
Spermatogenesis is a unidirectional differentiation process that generates haploid sperm, but how the gene expression program that directs this process is established is largely unknown. Here we determine the high-resolution 3D chromatin architecture of male germ cells during spermatogenesis and show that CTCF-mediated 3D chromatin predetermines the gene expression program required for spermatogenesis. In undifferentiated spermatogonia, CTCF-mediated chromatin contacts on autosomes pre-establish meiosis-specific super-enhancers (SE). These meiotic SE recruit the master transcription factor A-MYB in meiotic spermatocytes, which strengthens their 3D contacts and instructs a burst of meiotic gene expression. We also find that at the mitosis-to-meiosis transition, the germline-specific Polycomb protein SCML2 resolves chromatin loops that are specific to mitotic spermatogonia. Moreover, SCML2 and A-MYB establish the unique 3D chromatin organization of sex chromosomes during meiotic sex chromosome inactivation. We propose that CTCF-mediated 3D chromatin organization enforces epigenetic priming that directs unidirectional differentiation, thereby determining the cellular identity of the male germline.


Conflict of interest statement

Competing interest statement The authors declare no competing interests.

Figures

Figure 1.
Figure 1.. 3D chromatin reprogramming and inter-TAD chromatin loop formation in meiosis.
a, Schematic of the stages of mouse spermatogenesis analyzed in this study. THY1+: undifferentiated spermatogonia; KIT+: differentiating spermatogonia; PS: pachytene spermatocytes; RS: round spermatids. b, Hi-C maps showing normalized Hi-C interaction frequencies (100kb bins, chromosome 7) in THY1+, KIT+, PS, and RS. 10kb bins normalized Hi-C matrices were used for the zoom-in. Black circles in the Hi-C map indicate chromatin loops. c, Hi-C interaction frequency probabilities P stratified by genomic distance s for each cell type shown (100kb bins). All autosomes were analyzed. d, Hi-C interaction heat maps (25kb bins, chromosome 5, 16, 865, 001–30, 215, 000bp) in THY1+ and PS. Chromatin loops are indicated by black circles, red lines in THY1+, and blue lines in PS. e, Numbers of chromatin loops (n) detected from each Hi-C data set (merged results for each using 5kb, 10kb, and 25kb bin data). f, Numbers of unique chromatin loops comparing each pairwise developmental stage. g, Chromatin loop length (Mb) from each Hi-C data set (merged results for each using 5kb, 10kb, and 25kb bin data). The number of loops used in the analysis was equal to the number shown in e (THY1+: n=3,562, KIT+: n=3,336, PS: n=1,223, RS: n=609). The box indicates the 25th, median and 75th percentiles, and the dot in the box indicates mean. Statistical analysis is based on Bonferroni correction. **** indicates p < 2e−16. h, Chromatin loop pile-up in each cell type with 100kb padding. Color represents normalized contact strength in the log scale. The normalized contact strength values in the central pixel are shown on the top left.
Figure 2.
Figure 2.. TAD and chromatin loop reorganization during spermatogenesis.
a, Numbers of TADs (n) detected from each Hi-C data set (25kb bins). b, Venn diagram showing numbers and overlaps of TAD boundaries in each developmental stage. c, Local pile-up analysis of TAD boundaries in each cell type. 10kb bins Hi-C data with 500 kb padding around the central pixel. Color represents normalized contact strength in the log scale. d, Local rescaled pile-ups of TADs from 10kb bin Hi-C data in each cell type. The dotted regions represent interactions between adjacent TADs. e, Ratio of accumulation of CTCF, H3K4me3/H3K27ac, or H3K27me3 at the anchor sites of chromatin loops in THY1+ and PS. f, CTCF enrichment at anchor sites of CTCF-dependent chromatin loops in THY1+ (detected in panel e, 2,532 sites). Heat maps for each locus are shown at the bottom. g, Model showing TAD and chromatin loop reorganization at the mitosis-to-meiosis transition.
Figure 3.
Figure 3.. SCML2 is required for the resolution of spermatogonia-type 3D chromatin.
a, Heat maps showing normalized Hi-C interaction frequencies (100kb bins, chromosome 2) in wildtype (WT) PS, cml2-KO PS (left), and WT RS and Scml2-KO RS (right). Red and blue Hi-C maps represent a log2 ratio comparison of Hi-C interaction frequencies between WT and Scml2-KO. b, Numbers of TADs (n) detected from each Hi-C data set (25kb bins) in WT PS, Scml2-KO PS, WT RS, and Scml2-KO RS. c, Venn diagram showing the overlap between all KIT+ TAD boundaries and Scml2-KO PS TAD boundaries (left), and the verlap between KIT+-specific TAD boundaries and Scml2-KO PS TAD boundaries (right). KIT+-specific boundaries are efined by excluding TAD boundaries detected in WT PS. d, Local pile-up analysis of KIT+ specific TAD boundaries in WT PS and Scml2-KO PS. e, Numbers of chromatin loops (n) detected in each Hi-C data set (merged results for each using 5kb, 10kb, and 25kb bin ata) in WT PS, Scml2-KO PS, WT RS, and Scml2-KO RS. f, Chromatin loop pile-up analysis in each cell type with 100kb padding. The normalized contact strength in the central pixel s displayed on the top left. g, Numbers of specific and common chromatin loops between WT PS and Scml2-KO PS. 677 Scml2-KO PS-specific loops verlapped with loops detected in KIT+. Overlapping loops were detected by Juicer. h, CTCF enrichment in WT PS and Scml2-KO PS at the anchor site of CTCF-chromatin loops in THY1+ spermatogonia. I, Violin plots of RNA-seq reads converted to log10 (TPM+1) value for genes associated with Scml2-KO PS specific loops in KIT+, WT PS and Scml2-KO PS. 1,243 genes were identified by extracting genes present in the anchor site of Scml2-KO PS-specific loops. The box indicates the 25th, median and 75th percentiles, and the dot in the box indicates mean. Statistical nalysis is based on Bonferroni correction. ****: p < 2e−16, **: p < 0.005. j, Model of resolution of spermatogonia-type 3D chromatin by SCML2.
Figure 4.
Figure 4.. A-MYB is required for the formation of meiotic-type 3D chromatin.
a, Heat maps showing normalized Hi-C interaction frequencies (100kb bins, chromosome 7) in WT PS, A-myb mutant PS left). Red and blue Hi-C maps represent a log2 ratio comparison of Hi-C interaction frequencies between wild-type and A-myb mutant PS. b, Number of TADs (n) detected from each Hi-C data set (25kb bins) in WT PS and A-myb mutant PS. c, Venn diagram showing the overlap between all KIT+ TAD boundaries and A-myb mutant PS TAD boundaries (left), and he overlap between KIT+-specific TAD boundaries and A-myb mutant PS TAD boundaries (right). KIT+-specific boundaries are defined by excluding boundaries detected in WT PS. d, Local pile-up analysis of KIT+-specific TAD boundaries in WT PS and A-myb mutant PS. e, Number of chromatin loops (n) detected in each Hi-C data set (merged results for each using 5kb, 10kb, and 25kb bin data) n WT PS and A-myb mutant PS. Yellow area in the graph of A-myb mutant PS indicate that the same loops are detected in WT PS (357 loops). f, Chromatin loop pile-up analysis in each cell type with 100kb padding. The normalized contact strength in the central pixel s displayed on the top left. g, ChIP-seq data for A-MYB using whole testis at the regions adjacent to TSS of 849 genes that overlap with anchor sites of chromatin loops in PS. h, Venn diagram showing the intersection of genes located at anchor sites of chromatin loops in PS (blue) and all A-MYB bound genes (green). The overlap is statistically significant (p=8.5×10−59) compared to the proportion of all A-MYB bound genes to all RefSeq genes based on the hypergeometric test. i, Model of the establishment of meiotic-type chromatin loops by A-MYB.
Figure 5.
Figure 5.. Meiotic super-enhancers are poised with 3D chromatin.
a, Track view showing meiotic SEs, H3K27ac, and chromatin loops in PS on the entire chromosome 2 (top). Enlargement of he boxed area is shown below. b, Pile-up analysis of averaged intersections of mitotic SEs with 500kb paddles. c, Pile-up analysis of averaged intersections of meiotic SEs with 500kb paddles. d, Track view showing CTCF distribution and Hi-C interactions of the meiotic SEs in PS on a region of chromosome 5. Pink ighlights indicate CTCF binding sites that do not overlap with meiotic SEs; blue highlights indicate CTCF binding sites that verlap with meiotic SEs and their loops. e, CTCF binding and Hi-C maps of THY1+ spermatogonia and PS around meiotic SEs (25kb bins, chr10: 7,947,188–83,287,187). f Pile-up analysis showing average interactions of CTCF binding sites overlapping with meiotic SEs. The pile-up analysis in HY1+, KIT+, PS, and RS is based on the Hi-C data from each developmental stage and the genomic coordinates of the CTCF binding sites that overlapped with meiotic SEs or their interacting genomic regions. g, Track view showing the distributions of A-MYB binding and H3K27ac around meiotic SEs. Hi-C interaction from the meiotic SEs is also shown. h, Pile-up analysis showing average interactions of meiotic SEs with 500kb paddles in WT PS and A-myb mutant PS. The ormalized contact strength in the central pixel is displayed on the top left. i Pile-up analysis showing average interactions of loci that interacted with meiotic SEs based on Hi-C data with 100kb addles in WT PS and A-myb mutant PS. j Model of the predetermination of 3D chromatin at meiotic SE loci via CTCF in mitotic spermatogonia. A-MYB strengthns these 3D contacts in meiotic spermatocytes.
Figure 6.
Figure 6.. SCML2 and A-MYB establish unique 3D chromatin of the meiotic sex chromosomes
a, Hi-C maps of the X chromosome showing normalized Hi-C interaction frequencies (100kb bins) in WT THY1+, KIT+, PS, and RS. b, Heat maps showing normalized Hi-C interaction frequencies (100kb bins, chromosome X) in Scml2-KO PS (left). Red and blue Hi-C maps represent a log2 ratio comparison of Hi-C interaction frequencies between wild-type and Scml2-KO PS right). c, Heat maps showing normalized Hi-C interaction frequencies (100kb bins, chromosome X) in A-myb mutant PS (left). Red and blue Hi-C maps represent a log2 ratio comparison of Hi-C interaction frequencies between wild-type and A-myb mutant PS (right). d, Heat maps showing normalized Hi-C interchromosomal interactions (250-kb bins, chromosomes 1 and X) for WT THY1+, WT PS, Scml2-KO PS and A-myb mutant PS. e, Heat maps showing normalized Hi-C interchromosomal interactions (250-kb bins, chromosomes 1 and 2) for WT THY1+, WT PS, Scml2-KO PS and A-myb mutant PS. f, Model for the establishment of a unique 3D chromatin in the XY body and segregation of XY from autosomes in PS. g, Model of interchromosomal interactions in pachytene spermatocytes. h, Schematic of the molecular pathway that establishes a XY-unique 3D chromatin in pachytene spermatocytes.
Figure 7.
Figure 7.. Models of 3D chromatin dynamics and gene regulation on autosomes and sex chromosomes during spermatogenesis.
a, Model showing the changes in chromosome interactions from mitotic spermatogonia to meiotic spermatocytes on autosomes. b, Model of 3D chromatin dynamic on the sex chromosomes. At the onset of MSCI at the early-pachytene stage, DDR initiated MSCI and, subsequently, SCML2 and A-MYB establish unique 3D chromatin of the sex chromosomes and segregate the sex chromosomes from autosomes at the mid-pachytene stage.

References

    1. Kadauke S. & Blobel G.A. Chromatin loops in gene regulation. Biochim Biophys Acta 1789, 17–25 (2009). - PMC - PubMed
    1. Holwerda S. & de Laat W. Chromatin loops, gene positioning, and gene expression. Front Genet 3, 217 (2012). - PMC - PubMed
    1. Zheng H. & Xie W. The role of 3D genome organization in development and cell differentiation. Nat Rev Mol Cell Biol 20, 535–550 (2019). - PubMed
    1. Misteli T. The Self-Organizing Genome: Principles of Genome Architecture and Function. Cell 183, 28–45 (2020). - PMC - PubMed
    1. Lieberman-Aiden E. et al. Comprehensive mapping of long-range interactions reveals folding principles of the human genome. Science 326, 289–93 (2009). - PMC - PubMed

Publication types