[Preprint]. 2024 Aug 30:2023.11.27.568910.
doi: 10.1101/2023.11.27.568910.

Translation elongation as a rate limiting step of protein production

Affiliations

Translation elongation as a rate limiting step of protein production

Elijah F Lyons et al. bioRxiv. .

Abstract

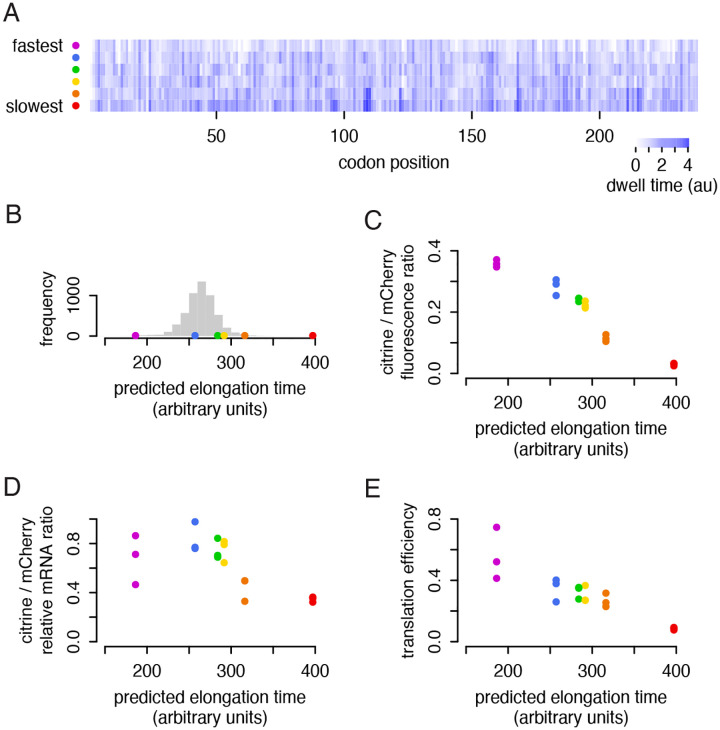
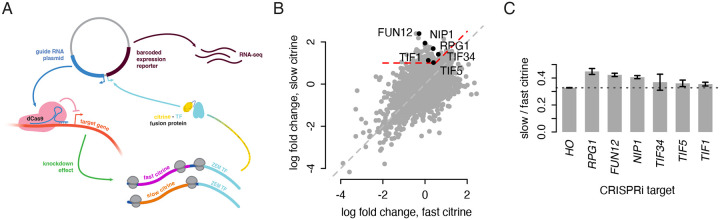
The impact of synonymous codon choice on protein output has important implications for understanding endogenous gene expression and design of synthetic mRNAs. Synonymous codons are decoded at different speeds, but simple models predict that this should not drive protein output. Instead, translation initiation should be the rate limiting step for production of protein per mRNA, with little impact of codon choice. Previously, we used a neural network model to design a series of synonymous fluorescent reporters and showed that their protein output in yeast spanned a seven-fold range corresponding to their predicted translation elongation speed. Here, we show that this effect is not due primarily to the established impact of slow elongation on mRNA stability, but rather, that slow elongation further decreases the number of proteins made per mRNA. We combine simulations and careful experiments on fluorescent reporters to show that translation is limited on non-optimally encoded transcripts. Using a genome-wide CRISPRi screen, we find that impairing translation initiation attenuates the impact of slow elongation, showing a dynamic balance between rate limiting steps of protein production. Our results show that codon choice can directly limit protein production across the full range of endogenous variability in codon usage.


Conflict of interest statement

Declaration of interests N.T.I. is a shareholder of Velia Therapeutics and a shareholder and member of the scientific advisory board of Tevard Biosciences. L.F.L. holds a patent on the iXnos mRNA design method used here.

Figures

Figure 1:
Figure 1:. Non-optimal reporters produce less protein per transcript, beyond the effect of mRNA decay.
a) Six synonymous citrine reporters depicted with their predicted ribosome dwell times at each position. Reporter sequences were designed in our previous work (Tunney et al, 2018), using a neural network model that predicts the time the ribosome spends on each position of a coding sequence as a function of the identity of the codon being decoded in the ribosomal A site and the adjacent codons in the P and E sites and neighboring sequence. The reporters were designed to span the range of total decoding times from fastest to slowest possible. b) The distribution of total predicted decoding times of endogenous yeast genes, normalized by length, is shown in gray, with the total elongation times of the six citrine reporters shown by color. c) Flow cytometry measurements of citrine fluorescence normalized to mCherry fluorescence for each synonymous reporter. Median fluorescence ratio for ~20,000 yeast is shown for three isolates of each reporter; error bars per sample are too small to plot. d) mRNA abundance of each synonymous citrine reporter normalized to mCherry mRNA abundance, determined by RT-qPCR, for three isolates of each reporter. e) Translation efficiency of each synonymous reporter, calculated as the normalized fluorescence divided by normalized mRNA abundance.
Figure 2:
Figure 2:. Measured translation output does not match predictions of a simple simulation.
a) Simulated protein output from the TASEP model, shown as the ratio of slow reporter to fast reporter protein output, does not approach the observed ratio of protein output (dark gray dashed line) across a range of realistic initiation rates. Also shown is the protein output expected based only on mRNA differences (light gray dashed line). b) Schematic representation of expected ribosome density on fast (magenta) and slow (orange) synonymous reporter transcripts if no additional regulation beyond mRNA decay occurs to limit translation of the slow reporter. c) Distribution of ribosome counts on reporter mRNAs as determined by sucrose gradient fractionation of polysomes and RNA sequencing. To accurately compare reporter abundances in each fraction, a constant mass of human RNA was spiked into each fraction before RNA isolation. Abundance of each reporter in each fraction of the gradient is presented as a percentage of the total mRNA for that reporter. All six reporter strains were co-cultured to allow measurement from a single gradient; two replicates were performed with distinct isolates of the reporter strains. Polysome trace is depicted as 254 nm absorbance, gray. d) Alternative model explaining observed ribosome density on fast (magenta) and slow (orange) synonymous reporter transcripts.
Figure 3:
Figure 3:. Lack of evidence for incomplete translation on non-optimal sequences.
a) Flow cytometry measurements of fluorescence from fast and slow citrine reporters, as in figure 1B, in strains with deletions of genes implicated in ribosome associated quality control and related mechanisms. b) Schematic of dual fluorescence E2A constructs composed of an mCherry coding sequence with no stop codon, an E2A skipping sequence, and either the slow or fast citrine sequence. Yeast backgrounds also contain emiRFP for normalization. c) Flow cytometry measurements of citrine and mCherry fluorescence from fast and slow E2A constructs, each normalized to iRFP, as well as the ratio of citrine to mCherry. Citrine and mCherry measurements were each scaled to the average citrine or mCherry fluorescence, respectively, of the fast citrine reporter. The bar height shows the average of three isolates.
Figure 4:
Figure 4:. Passive start codon occlusion does not explain lower output of non-optimal sequences.
a) Schematic of an initiation interference event; an upstream ribosome cannot initiate because the start codon is occluded by a downstream ribosome. b) Flow cytometry measurements of fluorescence from 5′-standardized and original synonymous citrine reporters, as in figure 1B. The first 20 codons of each reporter were standardized to the original yeCitrine sequence. c) Flow cytometry measurements of fluorescence from chimeric, fast, and slow synonymous reporters, as in figure 1B, from three isolates of each chimera and one of each original reporter. The reporters comprise the first half of the slow citrine sequence and the second half of the fast citrine sequence and vice versa.
Figure 5:
Figure 5:. A CRISPRi screen identifies initiation factors as modulators of non-optimal codon translation.
a) The modified CiBER-seq assay. Each Cas9 guide RNA cassette is linked to a transcribed reporter with a unique barcode sequence on the same plasmid. Expression of this barcoded reporter is driven by the synthetic transcription factor ZIF286 (ZEM-TF) fused downstream of either the fast or slow synonymous citrine sequence. The RNA-to-DNA ratio for each barcode, determined by deep sequencing, corresponds to reporter expression driven by the citrine-ZEM fusion. A change in translation of the citrine sequence due to CRISPRi knockdown of a relevant gene will result in changes in citrine-ZEM abundance and expression of the barcode linked to that guide RNA. b) Log2 fold change (LFC) of barcode counts after guide induction for fast citrine (x-axis) and slow citrine (y-axis) fusion backgrounds, for each linked guide. Red dashed line indicates the region containing guides with linked barcodes that showed LFC > 1 in the slow citrine fusion background and (LFCslow - LFCfast) > 0.5. Labels indicate guides that correspond to the term ‘cytoplasmic translation initiation,’ the only overrepresented term in a Gene Ontology analysis of all guides in the region of interest. c) Ratio of normalized fluorescence of the slow citrine reporter to normalized fluorescence of the fast citrine reporter in isogenic CRISPRi backgrounds. Dashed line indicates the value of this ratio for the HO guide background, which is used as a control. Fluorescence was determined by flow cytometry; bar height corresponds to the average of three isolates of the citrine reporter in each guide background and error bars depict standard error of the mean.
Figure 6:
Figure 6:. The impact of non-optimal codons on protein output depends on initiation rate.
a) Synonymous citrine reporters were combined with 5′ UTRs with and without stem-loop structures, creating 18 reporter combinations. b) Flow cytometry measurements of fluorescence from the reporters. Points represent the median yellow:red ratio of ~20,000 cells. Lines represent the average of three replicates. c) Protein output from the fastest reporter was used to compute an initiation score for each UTR variant as its output relative to the variant with no stem-loop. Fluorescence output of the six citrine coding variants, calculated as in (b), is plotted as a function of this initiation score. Lines represent the average of three replicates. d) Fluorescence output of the 18 reporter variants, represented by a color gradient, as a function of initiation score and predicted elongation time. Value represents the average of three replicates. Gray dots show the genes analyzed in (e). e) A set of ~1000 endogenous yeast genes were plotted by the average elongation time of each endogenous CDS, as predicted by our iXnos method, and by the output driven by each endogenous UTR when fused to a YFP reporter (Akirtava et al, 2024). Points were colored by the translation efficiency (proteins per mRNA per time) calculated from measurements of protein abundance, protein turnover, and mRNA abundance (Lahtvee et al, 2017).

References

    1. Akirtava Christina, May Gemma, and McManus C. Joel. 2024. “Deciphering the cis-regulatory landscape of natural yeast Transcript Leaders.” bioRxiv. doi: 10.1101/2024.07.03.601937 - DOI - PubMed
    1. Arava Yoav, Wang Yulei, Storey John D., Liu Chih Long, Brown Patrick O., and Herschlag Daniel. 2003. “Genome-Wide Analysis of mRNA Translation Profiles in Saccharomyces Cerevisiae.” Proceedings of the National Academy of Sciences 100 (7): 3889–94. - PMC - PubMed
    1. Bae Haneui, and Coller Jeff. 2022. “Codon Optimality-Mediated mRNA Degradation: Linking Translational Elongation to mRNA Stability.” Molecular Cell 82 (8): 1467–76. - PMC - PubMed
    1. Barrington Chloe L., Galindo Gabriel, Koch Amanda L., Larkin-Gero Emma, Morrison Evan J., Tisa Samantha, Stasevich Timothy J., and Rissland Olivia S.. 2023. “Synonymous Codon Usage Regulates Translation Initiation.” Cell Reports 42 (12): 113413. - PMC - PubMed
    1. Bazzini Ariel A., Del Viso Florencia, Moreno-Mateos Miguel A., Johnstone Timothy G., Vejnar Charles E., Qin Yidan, Yao Jun, Khokha Mustafa K., and Giraldez Antonio J.. 2016. “Codon Identity Regulates mRNA Stability and Translation Efficiency during the Maternal-to-Zygotic Transition.” The EMBO Journal 35 (19): 2087–2103. - PMC - PubMed

References (Methods)

    1. Ares Manuel. 2012. “Isolation of Total RNA from Yeast Cell Cultures.” Cold Spring Harbor Protocols 2012 (10): 1082–86. - PubMed
    1. Gietz R. Daniel, and Woods Robin A.. 2002. “Transformation of Yeast by Lithium Acetate/single-Stranded Carrier DNA/polyethylene Glycol Method.” Methods in Enzymology 350: 87–96. - PubMed
    1. Gillespie Daniel T. 1976. “A General Method for Numerically Simulating the Stochastic Time Evolution of Coupled Chemical Reactions.” Journal of Computational Physics 22 (4): 403–34.
    1. McGeachy Anna M., Meacham Zuriah A., and Ingolia Nicholas T.. 2019. “An Accessible Continuous-Culture Turbidostat for Pooled Analysis of Complex Libraries.” ACS Synthetic Biology 8 (4): 844–56. - PubMed
    1. Myint Leslie, Avramopoulos Dimitrios G., Goff Loyal A., and Hansen Kasper D.. 2019. “Linear Models Enable Powerful Differential Activity Analysis in Massively Parallel Reporter Assays.” BMC Genomics 20 (1): 209. - PMC - PubMed

Publication types