[Preprint]. 2023 Nov 30:2023.10.23.563591.
doi: 10.1101/2023.10.23.563591.

Unlocking the Role of sMyBP-C: A Key Player in Skeletal Muscle Development and Growth

Affiliations

Unlocking the Role of sMyBP-C: A Key Player in Skeletal Muscle Development and Growth

Taejeong Song et al. bioRxiv. .

Abstract

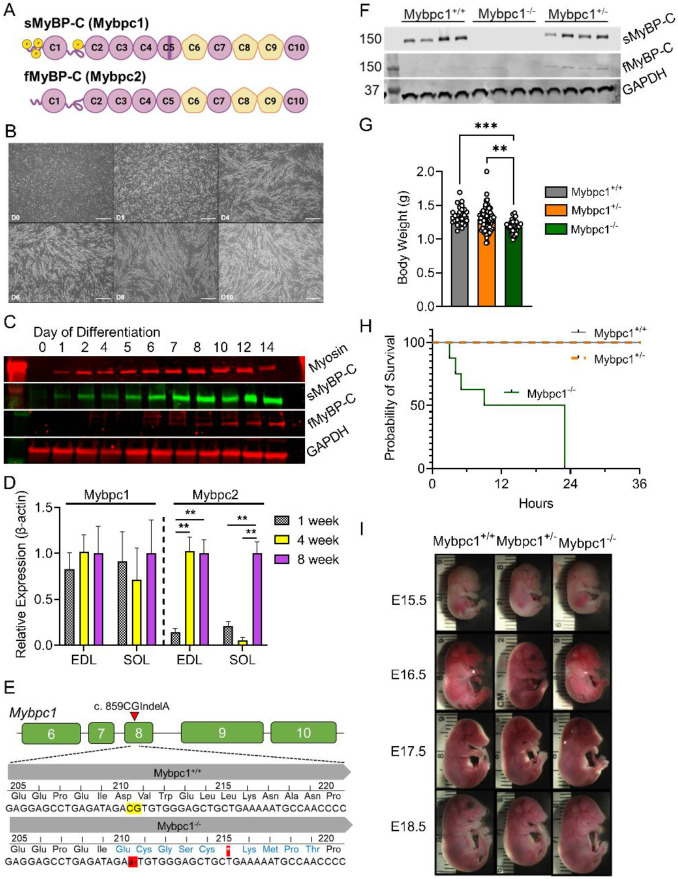
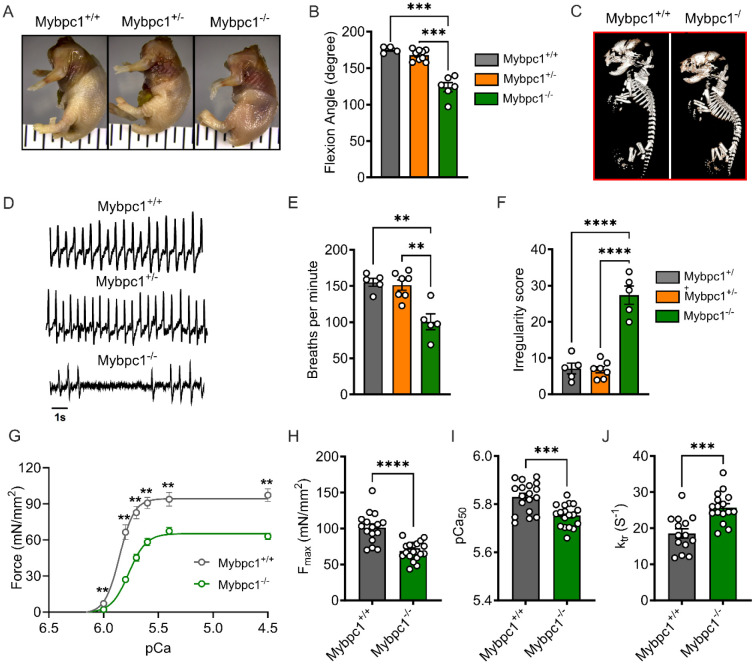
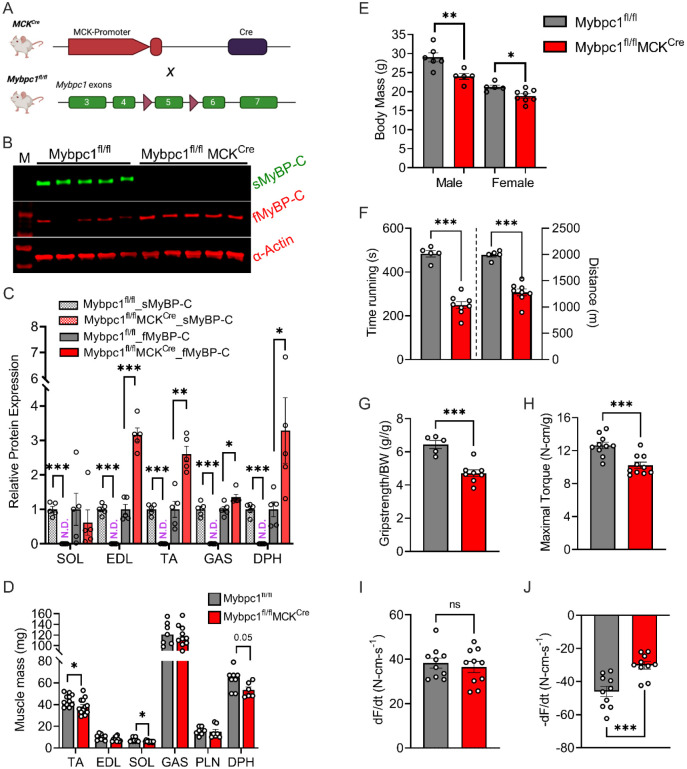
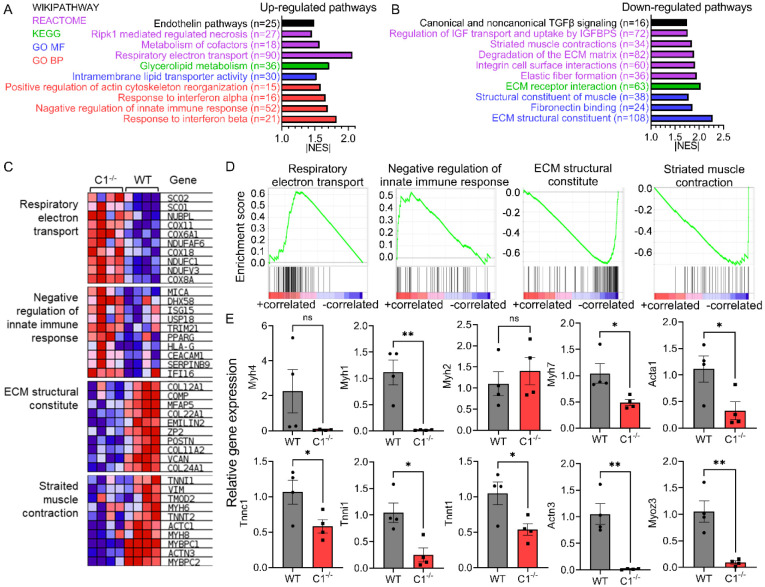
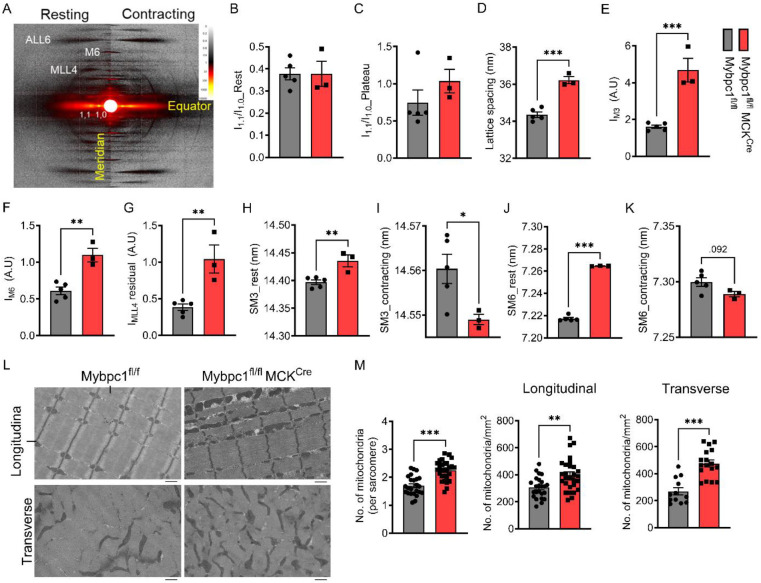
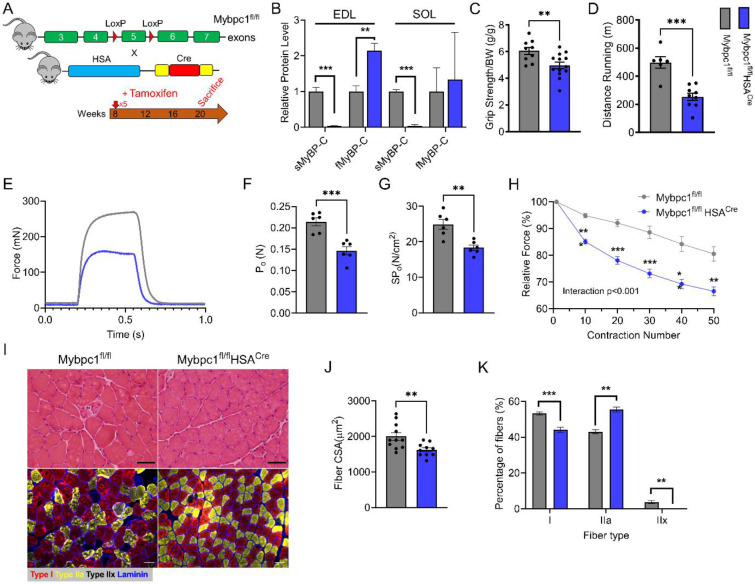
Skeletal muscle is the largest organ in the body, responsible for gross movement and metabolic regulation. Recently, variants in the MYBPC1 gene have been implicated in a variety of developmental muscle diseases, such as distal arthrogryposis. How MYBPC1 variants cause disease is not well understood. Here, through a collection of novel gene-edited mouse models, we define a critical role for slow myosin binding protein-C (sMyBP-C), encoded by MYBPC1, across muscle development, growth, and maintenance during prenatal, perinatal, postnatal and adult stages. Specifically, Mybpc1 knockout mice exhibited early postnatal lethality and impaired skeletal muscle formation and structure, skeletal deformity, and respiratory failure. Moreover, a conditional knockout of Mybpc1 in perinatal, postnatal and adult stages demonstrates impaired postnatal muscle growth and function secondary to disrupted actomyosin interaction and sarcomere structural integrity. These findings confirm the essential role of sMyBP-C in skeletal muscle and reveal specific functions in both prenatal embryonic musculoskeletal development and postnatal muscle growth and function.


Conflict of interest statement

Conflict of Interest: S.S provides consulting and collaborative research studies to the Leducq Foundation (CURE-PLAN), Red Saree Inc., Greater Cincinnati Tamil Sangam, Affinia Therapeutics Inc., Cosmogene Skincare Private Limited, Amgen and AstraZeneca, but such work is unrelated to the content of this article. J.R.P. provides consulting to Kate Therapeutics, but such work is unrelated to the content of this article.

Figures

Figure 1.
Figure 1.. Essential early constitutive sMyBP-C expression for neonatal mouse survival.
A) Domain structure of two skeletal MyBP-C isoforms, slow and fast MyBP-C encoded in Mybpc1 and Mybpc2 genes, respectively. B) Time course images of differentiating C2C12. Scale bar=500um. C) Early sMyBP-C expression but late expression of fMyBP-C protein in differentiating C2C12 myocytes. D) Expression profile of Mybpc1 and Mybpc2 genes in mouse fast (EDL) and slow (soleus) twitch muscles at 1, 4 and 8 weeks old (n=3 per group). E) Schematic illustration of a mouse model with sequence comparison of Mybpc1+/+ and Mybpc1−/− F) sMyBP-C and fMyBP-C protein expression in diaphragm muscles (n=4 per group). G) Average body weight measured immediately after birth. H) Survival curve of Mybpc1+/+, Mybpc1+/− and Mybpc1−/− newborn mice over first 36 hours of life (n=8-15 per group). I) Similar body development of Mybpc1+/+, Mybpc1+/− and Mybpc1−/− at various embryonic stages. **p<0.01 and ***p<0.001. Statistical analyses by one way ANOVA and log rank Mantel-Cox test for (H).
Figure 2.
Figure 2.. Congenital contractures, respiratory distress and functional deficit after early sMyBP-C deletion.
A) Wholemount analysis of wild-type (Mybpc1+/+), Mybpc1gKO+/− (Mybpc1+/−) and Mybpc1gKO−/− (Mybpc1−/−) newborn mice and B) contracture of the forelimb (n=4-9 per group). C) X-Ray scan of fixed neonatal pups demonstrating kyphosis in Mybpc1−/− pups. D) Representative plethysmography traces for Mybpc1+/+, Mybpc1+/− and Mybpc1−/− neonatal pups. E) Average number of breaths and F) calculated breath irregularity scores in Mybpc1+/+, Mybpc1+/− and Mybpc1−/− pups. G) Skinned diaphragm fiber force-pCa curves with H) maximum force production, I) calcium sensitivity in skinned diaphragm muscle fibers and J) Rate of tension re-development at pCa4.5. **p<0.01, ***p<0.001, p<0.0001. Statistical analyses for (B), (E) and (F) by one way ANOVA and t-test for (G to J).
Figure 3.
Figure 3.. Atrophied muscle and disrupted gene expressions in Mybpc1 global knockout mice.
A) Cross-sections of diaphragms stained with wheat germ agglutinin and DAPI. Scale bar=50um. B) Quantification of myofiber size (from panel A). C) RNAseq analysis of total number of differentially expressed genes and associated pathways in Mybpc1−/− diaphragm. Gene Ontology terms related to significantly upregulated (D) and downregulated (F) genes in Mybpc1/− diaphragms. Select gene expression related to muscle atrophy (E) and muscle structure (G). ***p<0.001. Statistical analysis by one way ANOVA. Cutoff set for DEGs is logFC>1.5 and p<0.001.
Figure 4.
Figure 4.. Postnatal deletion of sMyBP-C impairs muscle growth and in vivo muscle function at 3~4 months old.
A) Schematic illustration of skeletal muscle-specific Mybpc1fl/fl/MCKCre conditional knockout model. B) Representative Western blot of slow and fast MyBP-C protein expressions in EDL and C) quantification of the two skeletal MyBP-C protein’s expression in slow and fast twitch muscles. D) Muscle mass and E) body weight of 12-week-old mice. Mybpc1 is required for normal function (n=5-10/group). F) Treadmill running test demonstrating time and distance to exhaustion. G) Grip strength test. In vivo plantarflexion function test showing H) maximal isometric torque production, I) rate of contraction and J) rate of relaxation. *p<0.05, **p<0.01, ***p<0.001. t-test was used for statistical analyses.
Figure 5.
Figure 5.. sMyBP-C knockdown after birth reduced contractile functions of slow twitch soleus muscle.
A) Representative ex vivo peak isometric tetanic force generation graph. B) Peak twitch force, C) peak tetanic force, and D) specific force generation. E) Half relaxation time, F) rate of activation, and G) rate of relaxation during the peak isometric contraction. H) Force-frequency graph depicted from force generation at electrical frequency at 12.5~200Hz. I) Fatigue resistance profile after 50 repeated isometric contraction at 150Hz. J) In vitro isometric force generation of skinned SOL fiber from pCa 7.0 to 4.5. K) Normalized force at different calcium concentration. L) Peak isometric force at pCa4.5, M) calcium sensitivity of contraction and N) force re-development rate. *p<0.05, **p<0.01, ***p<0.001, ****p<0.0001 after t-test.
Figure 6.
Figure 6.. Postnatal sMyBP-C deletion causes muscle atrophy, fiber type switch and disruption of muscle integrity.
A) Cross-sectioned soleus samples immunostained with antibodies against myosin heavy chain I (green), myosin heavy chain IIa (magenta), myosin heavy chain IIb (cyan) and laminin (grey). Scale bar=100um. B) Fiber CSA and C) fiber type distribution in soleus muscles. D) Average cross-sectional area of each fiber type and E) numbers of fibers per 1000um2. F) Single soleus fiber stained with DAPI. The edge of the fiber is highlighted by dotted lines. Scale bar=50um. Number of myonuclei normalized by G) fiber length and H) volume. I) Averaged fiber dimeter. *p<0.05, **p<0.01, ***p<0.001 after t-test.
Figure 7.
Figure 7.. Differential gene expression and molecular pathways in postnatal Mybpc1cKO by RNAseq analysis.
Ten up (A) or down (B) regulated pathways identified by GSEA in Mybpc1fl/fl/MCKCre (C1−/−) soleus muscle. C-D) Heatmap and enrichment score graph of key increased or decreased genes of mitochondria respiration, immune response, ECM structure, and muscle contraction. E) qPCR results of key sarcomere genes. DEGs were selected with criteria of logFC>1.5 and FDR<0.05. *p<0.05, **p<0.01. Statistical analyses by t-test for (E).
Figure 8.
Figure 8.. Disrupted sarcomere regulation and structural integrity in soleus muscle after postnatal sMyBP-C deletion.
A) Representative small angle X-ray diffraction images in resting and activating conditions. Equator I1.1/1.0 ratio before (B) or during (C) peak isometric tetanic contraction. D) Average lattice spacing between thick and thin filaments. The relative intensity of M3 (E), M6 (F), and residual MLL4 (G) during the peak contraction normalized by its resting values. SM3 and SM6 distances at rest and contracting conditions (H-K). L) Longitudinal and cross-sectioned electron microscopy images of Mybpc1fl/fl and Mybpc1fl/fl/MCKCre soleus muscle. Scale bar=1um. M) Number of mitochondria were counted and normalized by sarcomere (Left) and area (longitudinal, Middle and transverse, Right). *p<0.05, **p<0.01, ***p<0.001. Averaged value of two groups were compared by t-test.
Figure 9.
Figure 9.. sMyBP-C knockdown at adult stage also compromises muscle function and structure.
A) Schematic diagram of skeletal muscle specific adult conditional Mybpc1fl/flHSACre knockout model. B) Knockdown of sMyBP-C protein expression in EDL and soleus muscles. Grip strength (C) and running capacity (D) were significantly reduced in the KO. Reduced ex vivo soleus muscle function; peak isometric tetanic force (E-F), specific force (G), and fatigue resistance (H) in Mybpc1fl/fl/HSACre. I) Cross-sectioned soleus samples were stained with H&E (Top) and MHC isoform antibodies (Bottom). Scale bar=50um. Fiber CSA was significantly reduced, and fiber types were switched from type 2X and 1 to type 2A after Mybpc1KO at two months (J-K). **p<0.01, ***p<0.001.t-test was used for statistical analyses.

References

    1. Pollmann K. et al. , Compound Mutation in Cardiac Sarcomere Proteins Is Associated with Increased Risk for Major Arrhythmic Events in Pediatric Onset Hypertrophic Cardiomyopathy. J Clin Med 10, (2021). - PMC - PubMed
    1. Luther P. K. et al. , Understanding the organisation and role of myosin binding protein C in normal striated muscle by comparison with MyBP-C knockout cardiac muscle. J Mol Biol 384, 60–72 (2008). - PMC - PubMed
    1. Gautel M., Furst D. O., Cocco A., Schiaffino S., Isoform transitions of the myosin binding protein C family in developing human and mouse muscles: lack of isoform transcomplementation in cardiac muscle. Circ Res 82, 124–129 (1998). - PubMed
    1. Barefield D. et al. , Haploinsufficiency of MYBPC3 exacerbates the development of hypertrophic cardiomyopathy in heterozygous mice. J. Mol. Cell. Cardiol. 79, 234–243 (2015). - PMC - PubMed
    1. Sadayappan S. et al. , Cardiac myosin-binding protein-C phosphorylation and cardiac function. Circ. Res. 97, 1156–1163 (2005). - PMC - PubMed

Publication types