[Preprint]. 2024 Jan 17:2023.11.29.569287.
doi: 10.1101/2023.11.29.569287.

CRISPR-Cas12a exhibits metal-dependent specificity switching

Affiliations

CRISPR-Cas12a exhibits metal-dependent specificity switching

Giang T Nguyen et al. bioRxiv. .

Update in

Abstract

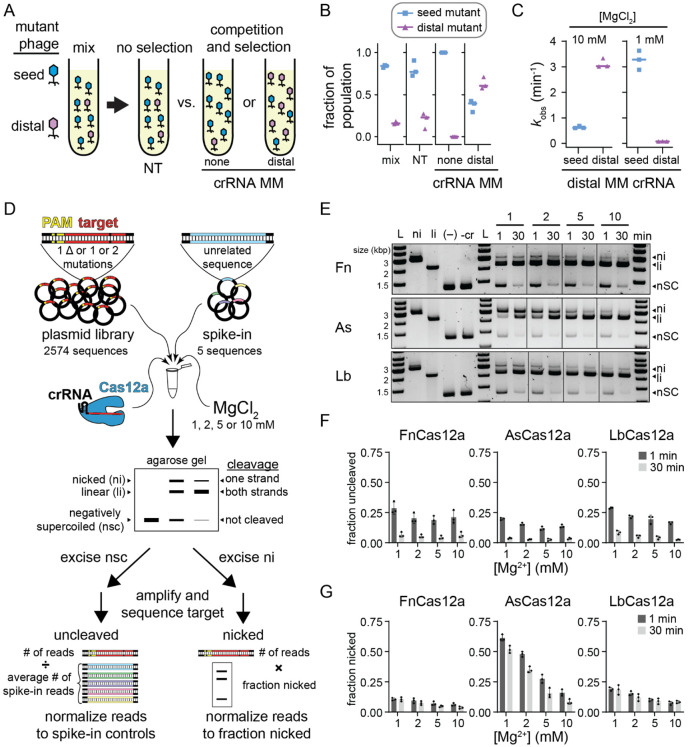
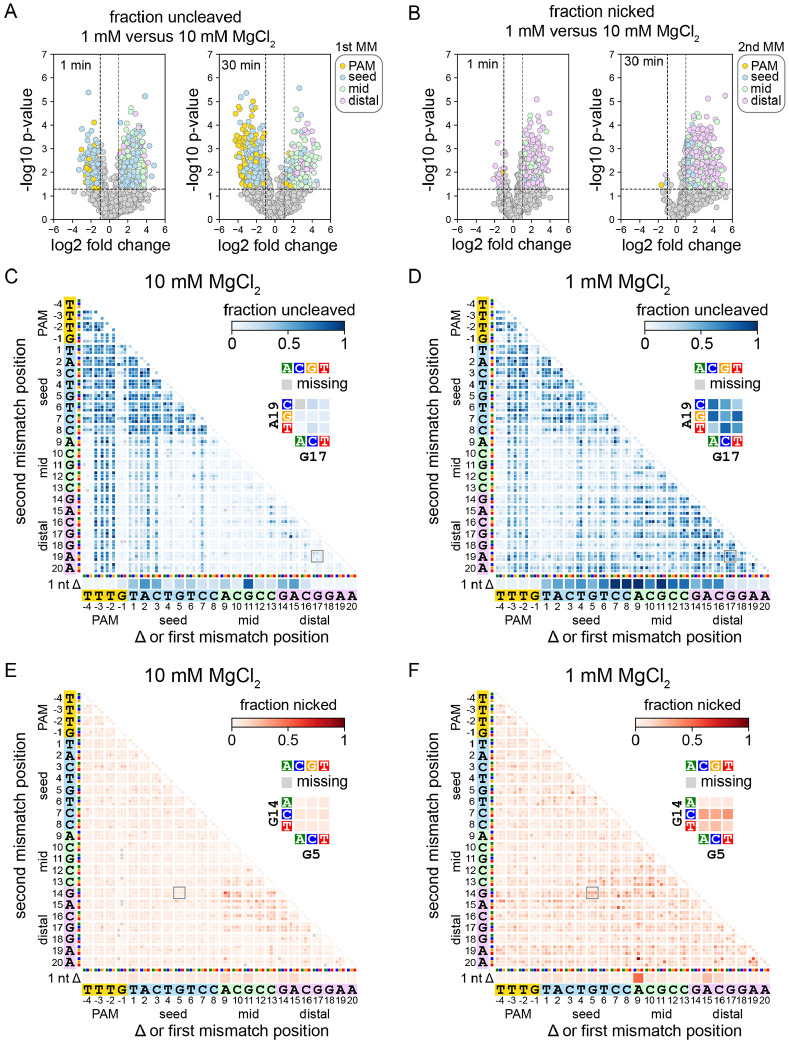
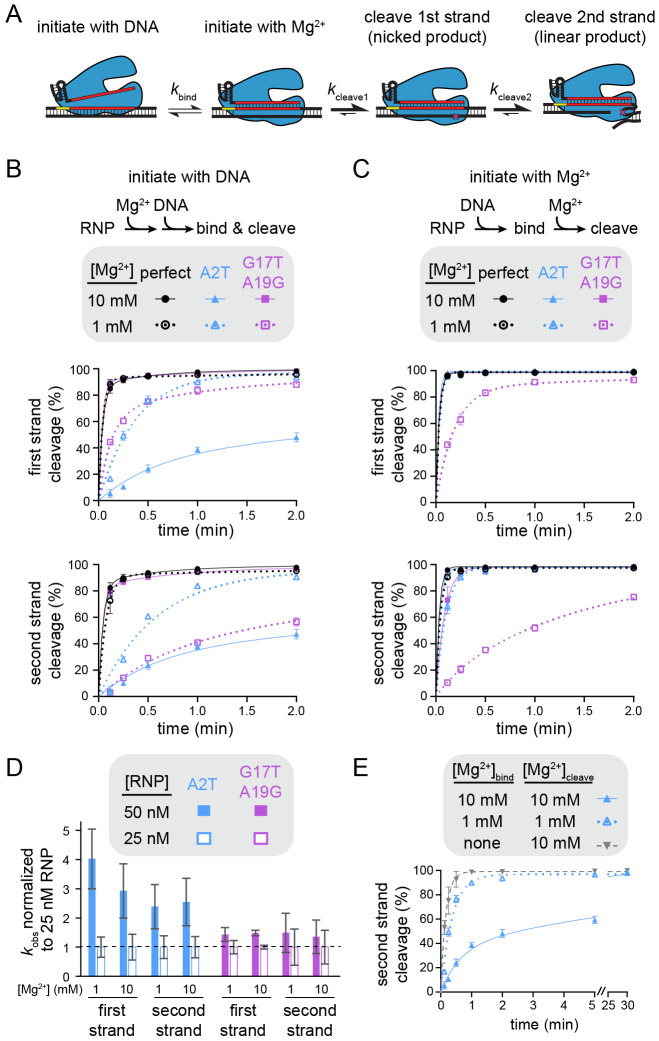
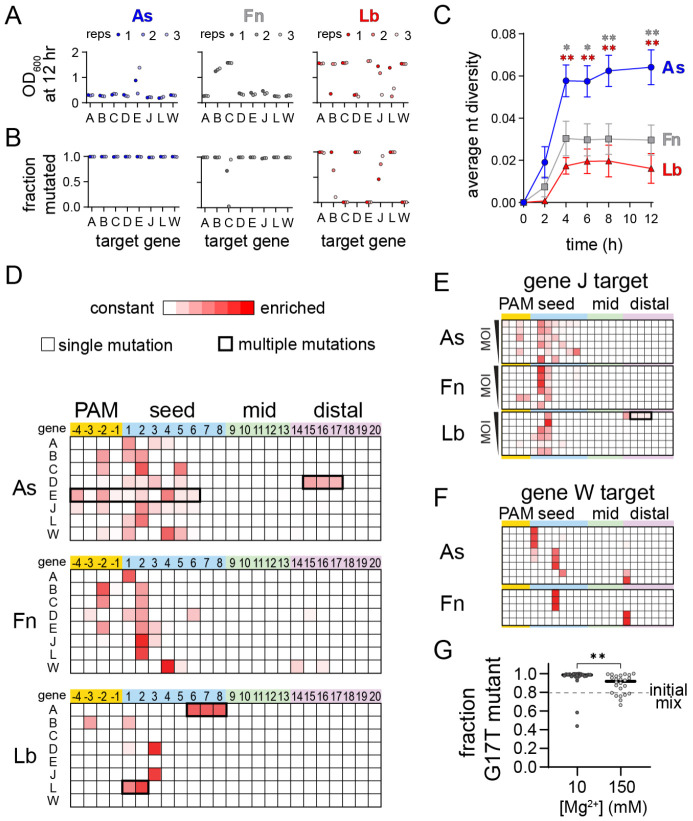
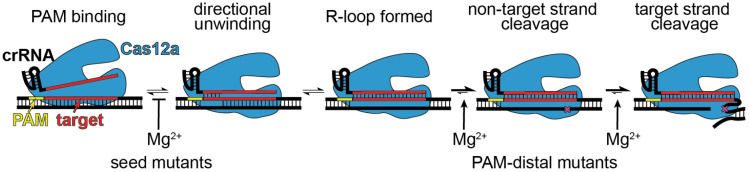
Cas12a is the immune effector of type V-A CRISPR-Cas systems and has been co-opted for genome editing and other biotechnology tools. The specificity of Cas12a has been the subject of extensive investigation both in vitro and in genome editing experiments. However, in vitro studies have often been performed at high magnesium ion concentrations that are inconsistent with the free Mg2+ concentrations that would be present in cells. By profiling the specificity of Cas12a orthologs at a range of Mg2+ concentrations, we find that Cas12a switches its specificity depending on metal ion concentration. Lowering Mg2+ concentration decreases cleavage defects caused by seed mismatches, while increasing the defects caused by PAM-distal mismatches. We show that Cas12a can bind seed mutant targets more rapidly at low Mg2+ concentrations, resulting in faster cleavage. In contrast, PAM-distal mismatches cause substantial defects in cleavage following formation of the Cas12a-target complex at low Mg2+ concentrations. We observe differences in Cas12a specificity switching between three orthologs that results in variations in the routes of phage escape from Cas12a-mediated immunity. Overall, our results reveal the importance of physiological metal ion conditions on the specificity of Cas effectors that are used in different cellular environments.


Figures

Figure 1:
Figure 1:. Mg2+-dependent Cas12a specificity profiling using plasmid library cleavage (Related to Figure S1 and S2)
A) Schematic of phage challenge assay. An initial mix of 80% seed mutant and 20% distal mutant phage were challenged with Cas12a bearing a non-targeting crRNA (no selection), a crRNA matching the original target sequence, or a crRNA containing a mutation at position 15. The two targeting crRNAs result in selection of phage mutants that are more deleterious to Cas12a cleavage. B) Fraction of A2T seed mutant (blue squares) or G17T PAM-distal mutant (purple triangles) in the initial mix, upon challenge by Cas12a bearing a non-targeting crRNA (NT), a crRNA containing no mutations (none), or a crRNA containing mismatch at position 15 (distal). Individual data points from three replicates are shown, and lines represent median values. C) Observed rate constants for cleavage of the A2T or G17T mutant targets with FnCas12a bearing a crRNA containing a mismatch at position 15 in the presence of 10 mM or 1 mM MgCl2. Individual data points from three replicates are shown, and lines represent median values. D) Schematic of the plasmid library cleavage assay. Libraries contained all target sequences with single nucleotide deletions or one or two mutations across the PAM and target sequence. Five unrelated sequences were spiked into the sample for normalization. This library was subject to cleavage by Cas12a at four Mg2+ concentrations. The cleavage reactions were separated by agarose gel electrophoresis. Negatively supercoiled and nicked bands were excised from the gel, PCR amplified, sequenced, and analyzed as described in Methods. E) Gene L plasmid library cleavage at four Mg2+ concentrations for FnCas12a (Fn), AsCas12a (As), and LbCas12a (Lb). ni = nicked, li = linear, nSC = negatively supercoiled. (−) lane contains no protein, -cr contains protein but no crRNA. Both controls contained 10 mM MgCl2 and were incubated at 37 °C for 30 min. Gel is representative of three replicates. F-G) Quantification of fraction uncleaved (F) or nicked (G) for the gene L library. The average of three replicates is plotted, with individual data points shown as dots and error bars representing standard deviation.
Figure 2:
Figure 2:. Specificity is altered in both the seed and the PAM-distal region at lower Mg2+ concentration (related to Figure S3 and Supplementary Data 1)
A-B) Volcano plots comparing sequences present in uncleaved (A) or nicked (B) fractions following cleavage of the gene L library at 1 or 10 mM MgCl2 by FnCas12a for 1 or 30 min. Data points in (A) are colored by the location of the first mutation in the sequence. Data points in (B) are colored by the location of the second mutation in the sequence. P values compare up to three replicates using an unpaired two-tailed t test C-D) Heatmaps showing the abundance of mutant sequences from the gene L plasmid library in the uncleaved (negatively supercoiled) fraction following 1 min cleavage by FnCas12a in the presence of 10 mM (C) or 1 mM (D) MgCl2. E-F) Heatmaps showing the abundance of mutant sequences from the gene L plasmid library in the nicked fraction following 1 min cleavage by FnCas12a in the presence of 10 mM (E) or 1 mM (F) MgCl2. Sequences with a single nucleotide deletion are shown at the bottom of each heatmap. Sequences with one mutation are shown along the diagonal of the 2D heatmaps. Sequences with mutations at two positions are depicted as 3x3 arrays where each box represents one combination of mutations at the two positions. For each heatmap, one 3x3 array is shown in close-up. Missing sequences are depicted in the heatmap with a gray box.
Figure 3:
Figure 3:. Metal-dependent specificity switching for three Cas12a orthologs (Related to Figure S4)
A-B) Cleavage is linearly related to Mg2+ concentration. The abundance of gene L A2T A15G (A) or G17T A19G (B) in the uncleaved (negatively supercoiled, blue boxes) or nicked (red triangles) fraction is plotted versus Mg2+ concentration and each curve is fit to a linear regression. These values were used to determine the fraction of DNA that was cleaved on both strands to produce linear, fully cleaved DNA (see Methods), which is plotted on the right and fit to a linear regression. The average of three replicates is plotted, with error bars representing standard deviation. C) Heatmap as in Figure 2 plotting slopes for fully cleaved DNA versus Mg2+ as determined in panels (A-B). The heatmap is for the gene L target plasmid library following 1 min cleavage by FnCas12a. Missing sequences are represented by white boxes. D) Slope heatmaps of the gene L target plasmid library following 1 min cleavage by AsCas12a or LbCas12a. E) Slope heatmaps of the gene L target plasmid library following 30 min cleavage by all three orthologs.
Figure 4:
Figure 4:. Mechanism of specificity switching varies for seed and PAM-distal mutants (Related to Figure S5)
A) Schematic representing different potential rate-limiting steps during Cas12a catalysis. The rates of binding or each cleavage step is represented with a different forward rate constant. B) Cleavage of gene L targets by FnCas12a in which cleavage was initiated by mixing Cas12a RNP with DNA. The gene L target containing a perfect match (black), an A2T seed mutation (blue), or a G17T A19G PAM-distal double mutant (purple) were cleaved by FnCas12a in the presence of 10 mM Mg2+ (solid shapes and lines) or 1 mM Mg2+ (open shapes and dotted lines). The rate of cleavage of the first strand and the second strand are plotted separately (see Methods). The average of three replicates is shown and error bars represent standard deviation. C) Cleavage of gene L targets by FnCas12a in which RNP and DNA were incubated in the absence of Mg2+ prior to initiation of cleavage through the addition of Mg2+, as in (B). D) Normalized rate constants derived from cleavage of gene L A2T mutant (blue) or G17T A19G mutant (purple) at 50 nM (solid bars) or 25 nM (white outlined bars) FnCas12a RNP concentrations. For each condition, the average rate constant values (n = 3 or 4) at each concentration were normalized to the 25 nM rate constant value and standard deviation was propagated for division. E) Cleavage of the A2T gene L mutant target by FnCas12a in the presence of 10 mM Mg2+ (solid triangle and lines, blue), 1 mM Mg2+ (open triangle and dotted lines, blue), or no Mg2+ (upside down triangle and dashed line, gray) during RNP-DNA binding. The average of three replicates is shown and error bars represent standard deviation.
Figure 5:
Figure 5:. Cas12a orthologs have varied escape outcomes (Related to Figure S6)
A) Optical density at 600 nm of phage-infected cultures of E. coli expressing the indicated Cas12a ortholog and a crRNA targeting the indicated gene following 12 h. Low values indicate full lysis, while values >1 indicate culture survival. The full growth curves are shown in Fig. S5A. B) Fraction of phage population for each culture in (A) in which at least one mutation was present in the PAM or targeted region of the phage genome. C) Average nucleotide diversity over time of all phage populations from cultures in which mutant phages emerged (see Methods). The error bars represent standard error of the mean of the average nucleotide diversity for between 5 to 8 target sequences. * P ≤ 0.05, ** P ≤ 0.01 as determined by an unpaired two-tailed t test comparing scores for AsCas12a and FnCas12a (gray, upper asterisks) or AsCas12a and LbCas12a (red, lower asterisks). D) Locations of mutations present in phage populations isolated from three infected E. coli cultures expressing the indicated Cas12a ortholog and a crRNA targeting the indicated λvir gene following 12 h of infection at an MOI of 0.8. Heatmaps plot Z-score values (scale of 0 to 7.5) for the presence of mutations in phage populations from infected cultures versus an uninfected control. Shades of red indicate the degree of enrichment of mutations at each position of the target. Most mutations were single nucleotide variants (thinner line around box), although multiple mutations arose in some cultures (thicker line around box). E) Locations of mutations present in phage populations isolated from infected E. coli cultures expressing the indicated Cas12a ortholog targeting gene J following 8 h of infection. The cultures were infected with phage at an MOI of 1, 0.5, 0.15, 0.08, 0.04, or 0.02 from top to bottom. Z-score are plotted as in (D). F) Locations of mutations present in phage populations isolated from infected E. coli cultures expressing the indicated Cas12a ortholog targeting gene W following 8 h of infection an MOI of 0.08. Only replicates in which the cultures underwent lysis are shown (out of 12 total). Z-score are plotted as in (D). G) Outcomes of competition assays between a seed and PAM-distal mutant phage in cultures grown in media supplemented with 10 mM or 150 mM MgSO4. The initial mix contained an 80:20 distribution of the G17T and A2T mutants. The fraction of the phage population containing the single G17T point mutation following lysis of the culture is plotted for 24 replicates. The approximate P value is 0.002 based on a nonparametric unpaired Kolmogorov-Smirnov test.
Figure 6:
Figure 6:. Model for Cas12a Mg2+-dependent steps with differential effects depending on mutant location.
Mg2+ is inhibitory of target unwinding and binding when a seed mutation is present in the target. Mg2+-dependent conformational changes that occur prior to each cleavage step are likely impaired in the presence of PAM-distal mutations.

References

    1. Aronesty E. (2011). ea-utils : Command-line tools for processing biological sequencing data.
    1. Aronesty E. (2013). Comparison of Sequencing Utility Programs. Open Bioinforma. J. 7, 1–8.
    1. Baba T., Ara T., Hasegawa M., Takai Y., Okumura Y., Baba M., Datsenko K.A., Tomita M., Wanner B.L., and Mori H. (2006). Construction of Escherichia coli K-12 in-frame, single-gene knockout mutants: The Keio collection. Mol. Syst. Biol. 2, 2006.0008. - PMC - PubMed
    1. Cameron P., Fuller C.K., Donohoue P.D., Jones B.N., Thompson M.S., Carter M.M., Gradia S., Vidal B., Garner E., Slorach E.M., et al. (2017). Mapping the genomic landscape of CRISPR–Cas9 cleavage. Nat. Methods 14, 600–606. - PubMed
    1. Chen J.S., Ma E., Harrington L.B., Da Costa M., Tian X., Palefsky J.M., and Doudna J.A. (2018). CRISPR-Cas12a target binding unleashes indiscriminate single-stranded DNase activity. Science 360, 436–439. - PMC - PubMed

Publication types

LinkOut - more resources