[Preprint]. 2023 Nov 22:2023.11.22.567930.
doi: 10.1101/2023.11.22.567930.

Durable immunity to SARS-CoV-2 in both lower and upper airways achieved with a gorilla adenovirus (GRAd) S-2P vaccine in non-human primates

Affiliations

Durable immunity to SARS-CoV-2 in both lower and upper airways achieved with a gorilla adenovirus (GRAd) S-2P vaccine in non-human primates

Juan I Moliva et al. bioRxiv. .

Abstract

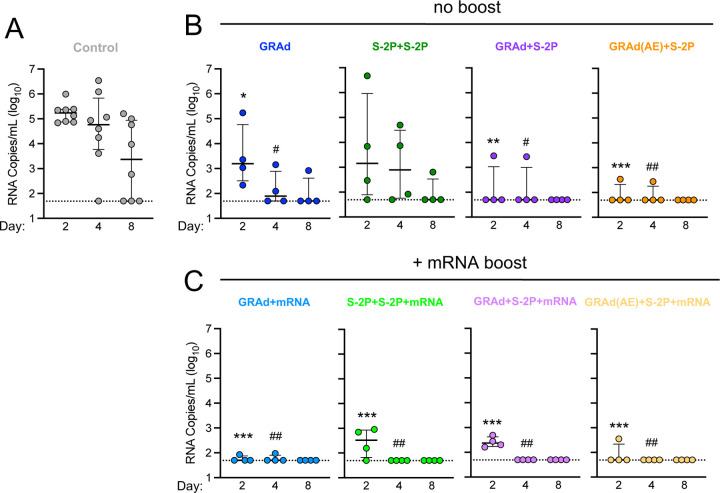
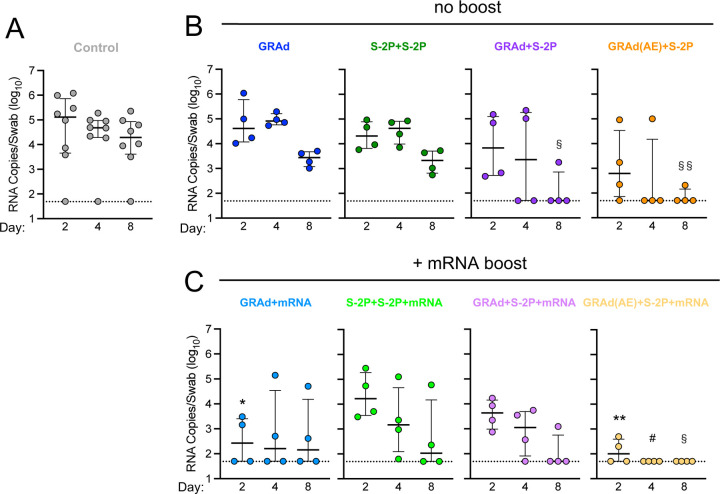
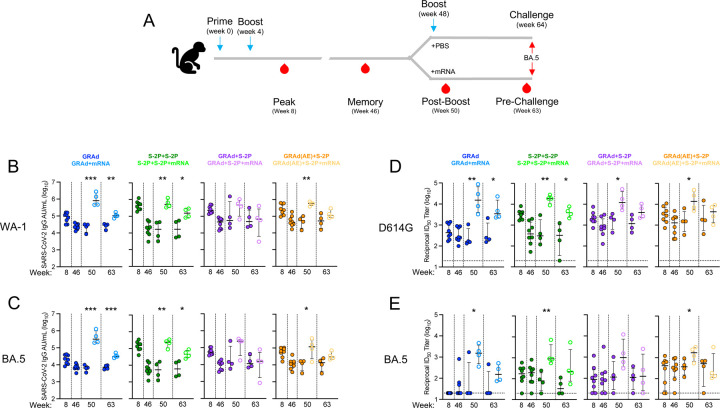
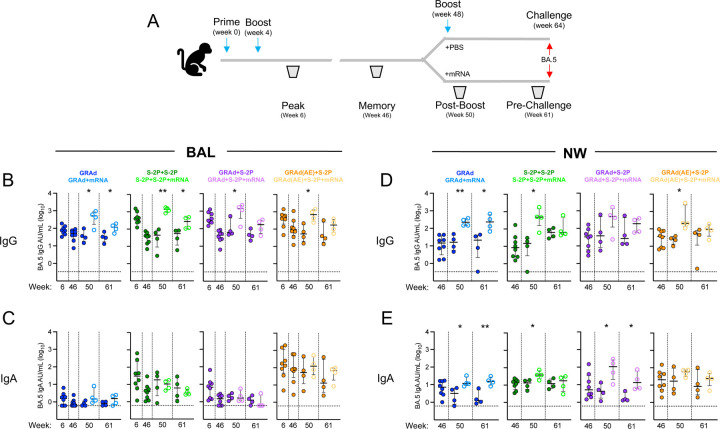
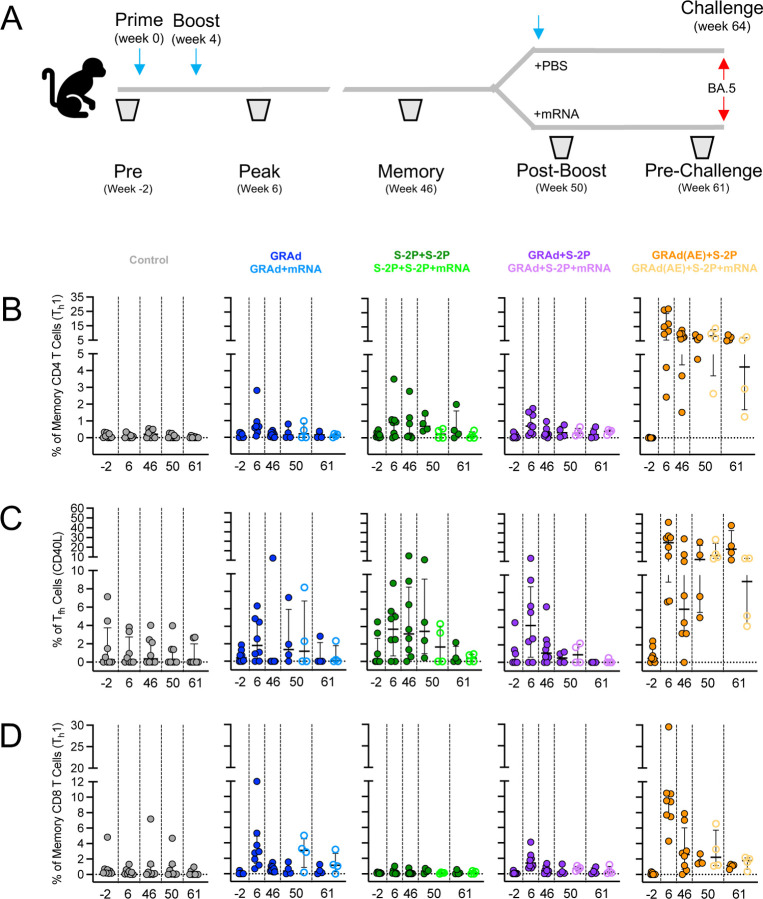
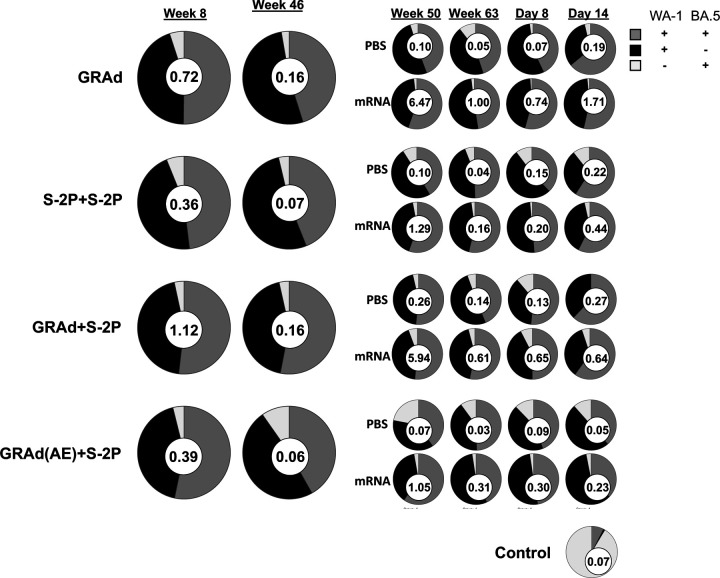
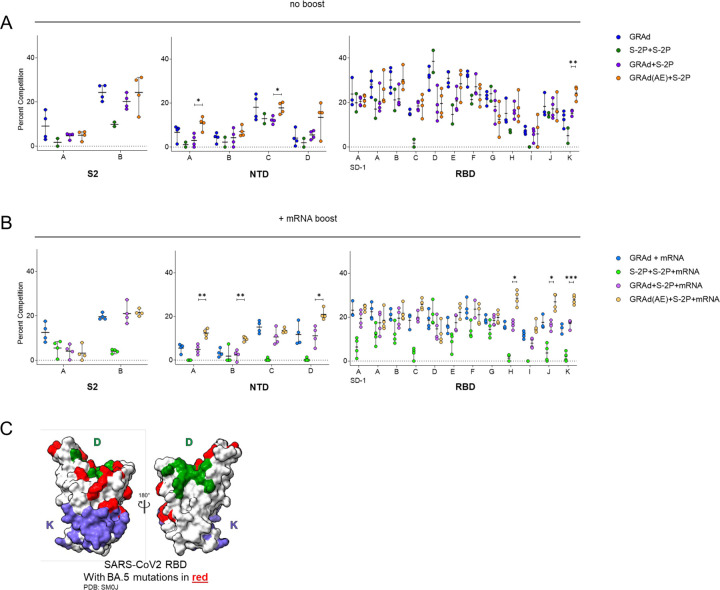
SARS-CoV-2 continues to pose a global threat, and current vaccines, while effective against severe illness, fall short in preventing transmission. To address this challenge, there's a need for vaccines that induce mucosal immunity and can rapidly control the virus. In this study, we demonstrate that a single immunization with a novel gorilla adenovirus-based vaccine (GRAd) carrying the pre-fusion stabilized Spike protein (S-2P) in non-human primates provided protective immunity for over one year against the BA.5 variant of SARS-CoV-2. A prime-boost regimen using GRAd followed by adjuvanted S-2P (GRAd+S-2P) accelerated viral clearance in both the lower and upper airways. GRAd delivered via aerosol (GRAd(AE)+S-2P) modestly improved protection compared to its matched intramuscular regimen, but showed dramatically superior boosting by mRNA and, importantly, total virus clearance in the upper airway by day 4 post infection. GrAd vaccination regimens elicited robust and durable systemic and mucosal antibody responses to multiple SARS-CoV-2 variants, but only GRAd(AE)+S-2P generated long-lasting T cell responses in the lung. This research underscores the flexibility of the GRAd vaccine platform to provide durable immunity against SARS-CoV-2 in both the lower and upper airways.

Keywords: B cells; BA.5; COVID-19; GRAd; Omicron; SARS-CoV-2; T cells; antibody; immune memory; mRNA vaccine; viral-vector.


Conflict of interest statement

Declaration of interests M.R., N.J.S., and D.C.D. are inventors on U.S. Patent Application No. 63/147,419 entitled “Antibodies Targeting the Spike Protein of Coronaviruses”. L.P., A.V.R., D.V., A.C., A.D., M.G.L., and H.A. are employees of Bioqual, Inc. A.L., A.V., S.Co., A.F., A.R., and S.Ca. are employees of ReiThera Srl. S.Co. and A.F. are shareholders of Keires AG. A.V., S.Co. and A.R. are named inventors of the Patent Application No. 20183515.4 entitled “Gorilla Adenovirus Nucleic Acid- and Amino Acid-Sequences, Vectors Containing Same, and Uses Thereof”. The other authors declare no competing interests.

Figures

Figure 1.
Figure 1.. GRAd confers durable protection against BA.5 in the lower airway
(A–C) BAL was collected at days 2, 4 and 8 following challenge with 8 × 10⁵ PFU BA.5. (A) BA.5 sgRNA_N copy numbers per mL of BAL in control NHP. (B) BA.5 sgRNA_N copy numbers per mL of BAL in GRAd, S-2P+S-2P, GRAd+S-2P and GRAd(AE)-S-2P NHP. (C) BA.5 sgRNA_N copy numbers per mL of BAL in GRAd, S-2P+S-2P, GRAd+S-2P and GRAd(AE)-S-2P NHP boosted with mRNA at week 48. Circles (A–C) indicate individual NHP. Error bars represent interquartile range with the median denoted by a horizontal line. Assay limit of detection indicated by a dotted horizontal line. Statistical analysis shown for corresponding timepoints between control and test group (e.g., ‘*’ symbols denote comparisons at day 2, ‘#’ symbols denote comparison at day 4). *,# p <0.05, **,## p <0.01, *** p <0.001. Eight control NHP and 4 immunized NHP per cohort. See also Figure S1 for experimental schema, Figure S2 for BA.5 titration in NHP, Figure S3 for viral load and Figure S4 for lung pathology.
Figure 2.
Figure 2.. Aerosol delivery of GRAd rapidly protects against BA.5 in the upper airway
(A-C) NS was collected at days 2, 4 and 8 following challenge with 8 × 10⁵ PFU BA.5. (A) BA.5 sgRNA_N copy numbers per swab in control NHP. (B) BA.5 sgRNA_N copy numbers per swab in GRAd, S-2P+S-2P, GRAd+S-2P and GRAd(AE)-S-2P NHP. (C) BA.5 sgRNA_N copy numbers per swab in GRAd, S-2P+S-2P, GRAd+S-2P and GRAd(AE)-S-2P NHP boosted with mRNA at week 48. Circles (A–C) indicate individual NHP. Error bars represent interquartile range with the median denoted by a horizontal line. Assay limit of detection indicated by a dotted horizontal line. Statistical analysis shown for corresponding timepoints between control and test group (e.g., ‘*’ symbols denote comparison at day 2, ‘#’ symbols denote comparison at day 4, ‘§’ symbols denote comparison at day 8). *,#,§ p <0.05, **,§§ p <0.01. Eight control NHP and 4 immunized NHP per cohort. See also Figure S1 for experimental schema, Figure S2 for BA.5 titration in NHP and Figure S3 for viral load.
Figure 3.
Figure 3.. GRAd immunization strategies generate durable antibody responses to SARS-CoV-2 variants that can be boosted with mRNA.
(A) Sera were collected at week 8, 46, 50 and 63. (B and C) IgG-binding titers to (B) ancestral WA-1 S and (C) BA.5 S expressed in AU/mL. (D and E) Neutralizing titers to (D) ancestral D614G lentiviral pseudovirus and (E) BA.5 lentiviral pseudovirus expressed as the reciprocal ID50. Circles (B–D) represent individual NHP. Error bars represent the interquartile range with the median denoted by a horizontal black line. Assay limit of detection indicated by a horizontal dotted line which may fall below the depicted range. Vertical dashed lines are for visualization purposes only. Eight immunized NHP, split into 2 cohorts of 4 NHP post mRNA boost. Statistical analysis shown for corresponding timepoints between mRNA boosted and non-boosted cohorts. * p <0.05, ** p <0.01, *** p <0.001. Eight immunized NHP at week 8 and 46, 4 immunized NHP at week 50 and 63. See also Figure S1 for experimental schema, Figure S5 for neutralization responses to D614G at week 2 and 4, Figure S6 for binding and neutralizing responses to BA.1 before and following challenge, and Figure S7 for binding and neutralizing responses to WA-1/D614G and BA.5 following challenge.
Figure 4.
Figure 4.. GRAd immunization strategies generate durable IgG and IgA responses to BA.5 in the lower and upper airway mucosa.
(A) BAL (B and C) was collected at week 6, 46, 50 and 61 and NW (D and E) was collected at week 46, 50, and 61. (A and B) IgG (B) and IgA (C) antibody binding titers to BA.5 expressed in AU/mL in BAL. (C and D) IgG (D) and IgA (E) antibody binding titers to BA.5 expressed in AU/mL in NW. Circles (B–E) represent individual NHP. Error bars represent the interquartile range with the median denoted by a horizontal black line. Assay limit of detection indicated by a horizontal dotted line. Vertical dashed lines are for visualization purposes only. Eight vaccinated NHP, split into 2 cohorts of 4 NHP post mRNA boost. Statistical analysis shown for corresponding timepoints between mRNA boosted and non-boosted cohorts. * p <0.05, ** p <0.01. Eight immunized NHP at week 6 and 46, 4 immunized NHP at week 50 and 61. See also Figure S1 for experimental schema, Figure S8 for WA-1 and BA.1 IgG and IgA BAL and NW binding titers prior to challenge, Figure S9 for IgG and IgA binding titers in BAL following challenge and Figure S10 for IgG and IgA binding titers in NW following challenge.
Figure 5:
Figure 5:. AE GRAd generates potent year-long S-specific T cell responses in the lung.
(A) BAL cells were collected at week −2, 6, 46, 50 and 61. (B–D) Cells were stimulated with SARS-CoV-2 S1 and S2 peptide pools (WA-1) and then measured by intracellular cytokine staining. (A) Percentage of memory CD4+ T cells with Th1 markers (IL-2, TNF, or IFNγ) following stimulation. (B) Percentage of Tfh cells that express CD40L. (C) Percentage of CD8 T cells expressing IL-2, TNF, or IFNγ. Circles in (B–D) indicate individual NHP. Error bars represent the interquartile range with the median denoted by a horizontal black line. Dotted lines set at 0%. Reported percentages may be negative due to background subtraction and may extend below the range of the y-axis. Eight vaccinated NHP, split into 2 cohorts of 4 NHP post mRNA boost. Eight control NHP, 8 immunized NHP at week 6 and 46, 4 immunized NHP at week 50 and 61. See also Figure S1 for experimental schema, Figure S11 for T cell gating strategy, Figure S12 for Th2 and Tfh (IL-21) responses in BAL prior to and following challenges, Figure S13 for CD4+ Th1, Tfh (CD40L) and CD8+ T cell responses following challenge and Figure S14 for T cell responses in blood.
Figure 6:
Figure 6:. Cross-reactive S-specific memory B cells are generated following immunization.
Pie charts indicate the frequency (numbered circle at the center) and proportion of total S-2P-binding memory B cells that are dual specific for WA-1 and BA.5 (dark gray), specific for WA-1 (black), or specific for BA.5 (light gray) for all NHP in each group and timepoint in the blood at week 8, 46, 50 and 63 post-immunization, and days 8 and 14 post-challenge. Seven or eight NHP per group at week 8 and 46, 3–4 NHP per group at week 50 and 63, and day 8, 1–2 NHP at day 14. See also Figure S1 for experimental schema, Figure S15 for B cell gating strategy and Figure S16 for WA-1 and BQ.1.1 cross-reactive B cell responses in blood.
Figure 7:
Figure 7:. Priming with IM or AE GRAd alters serum antibody epitope profile in presence or absence of mRNA boost
(A and B) Relative serum reactivity was measured as percent of total measured serum antibody S-2P binding competed by single monoclonal antibodies (mAbs) targeting S2, NTD, and RBD epitopes on WA-1 S-2P. Relative serum reactivity was evaluated in NHPs receiving no additional boost at week 63 (panel A) or mRNA boost (panel B). Circles in (A and B) indicate individual NHP. Error bars represent the range with the median denoted by a horizontal black line. Eight vaccinated NHP, split into 2 cohorts of 4 NHP post mRNA boost. Statistical analysis shown for percentage of competition of binding to indicated epitopes at week 63 between “GRAd(AE)+S2P” and “GRAd+S2P” groups. * p <0.05, ** p <0.01, *** p <0.001. (C) Footprints of site D (A19–46.1) and Site K (CR3022) defining mAbs indicate areas of binding on SARS-CoV-2 RBD with BA.5 mutations highlighted in red. See also Figure S1 for experimental schema.

Similar articles

Cited by

References

    1. COVID-19 Dashboard by the Center for Systems Science and Engineering at John Hopkins University. https://coronavirus.jhu.edu/map.html. - PMC - PubMed
    1. Barouch D.H. (2022). Covid-19 Vaccines - Immunity, Variants, Boosters. N Engl J Med 387, 1011–1020. 10.1056/NEJMra2206573. - DOI - PMC - PubMed
    1. Offit P.A. (2023). Bivalent Covid-19 Vaccines - A Cautionary Tale. N Engl J Med 388, 481–483. 10.1056/NEJMp2215780. - DOI - PubMed
    1. Baden L.R., El Sahly H.M., Essink B., Kotloff K., Frey S., Novak R., Diemert D., Spector S.A., Rouphael N., Creech C.B., et al. (2021). Efficacy and Safety of the mRNA-1273 SARS-CoV-2 Vaccine. N Engl J Med 384, 403–416. 10.1056/NEJMoa2035389. - DOI - PMC - PubMed
    1. Bergwerk M., Gonen T., Lustig Y., Amit S., Lipsitch M., Cohen C., Mandelboim M., Levin E.G., Rubin C., Indenbaum V., et al. (2021). Covid-19 Breakthrough Infections in Vaccinated Health Care Workers. N Engl J Med 385, 1474–1484. 10.1056/NEJMoa2109072. - DOI - PMC - PubMed

Publication types