[Preprint]. 2023 Dec 1:2023.11.30.569494.
doi: 10.1101/2023.11.30.569494.

Simultaneous CRISPR screening and spatial transcriptomics reveals intracellular, intercellular, and functional transcriptional circuits

Affiliations

Simultaneous CRISPR screening and spatial transcriptomics reveals intracellular, intercellular, and functional transcriptional circuits

Loϊc Binan et al. bioRxiv. .

Update in

Abstract

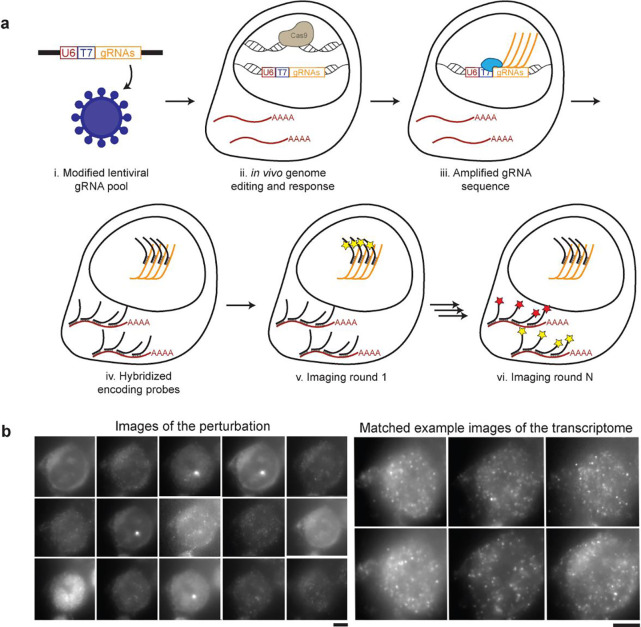
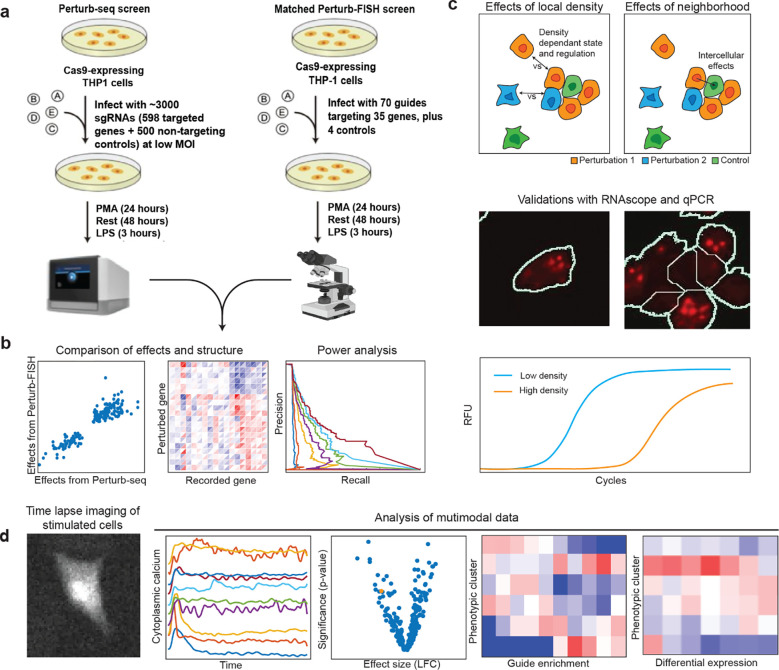
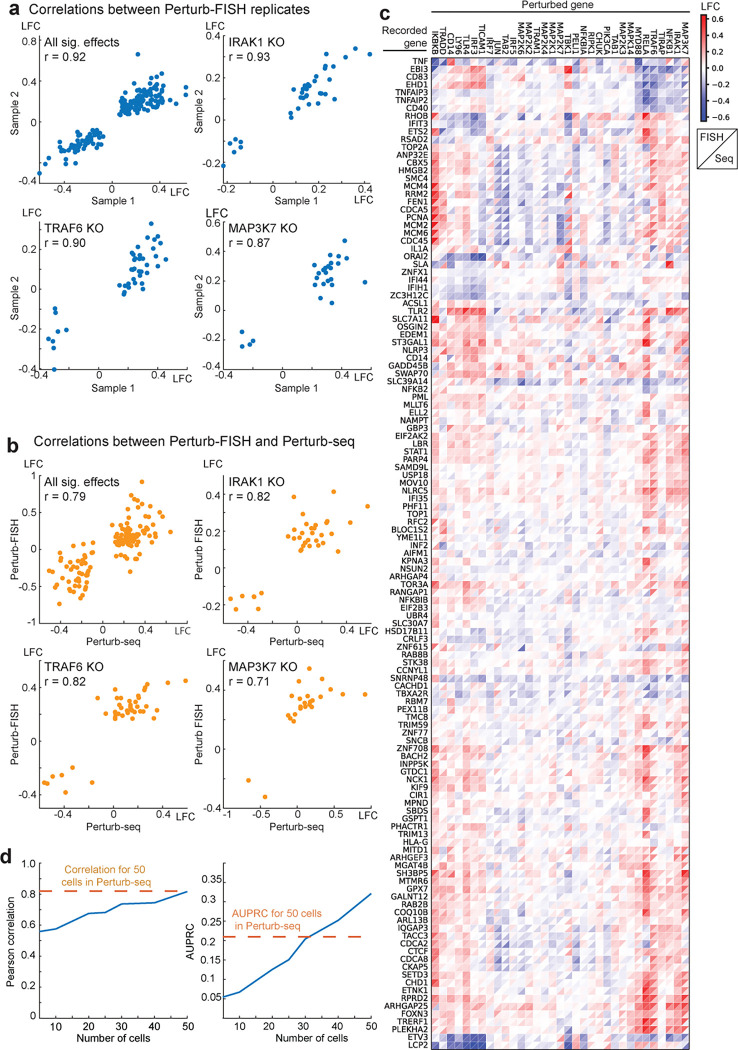
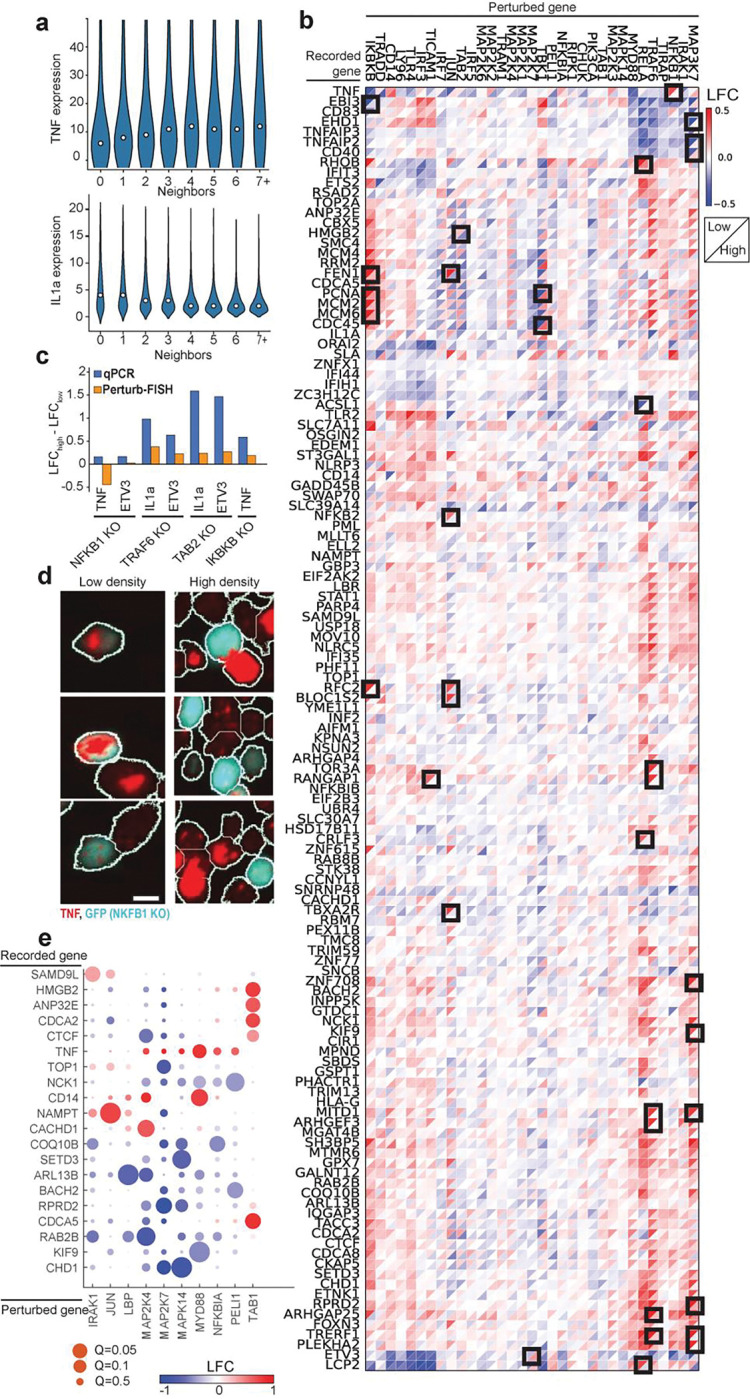
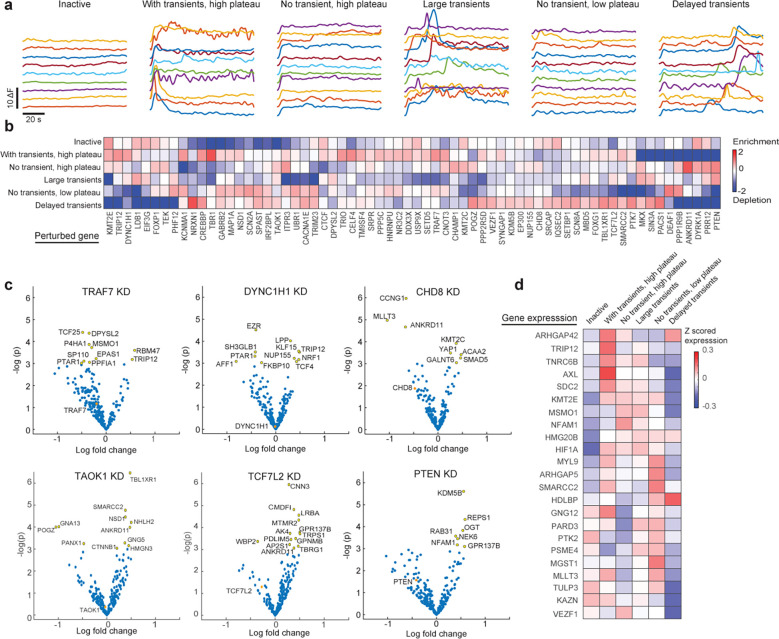
Pooled optical screens have enabled the study of cellular interactions, morphology, or dynamics at massive scale, but have not yet leveraged the power of highly-plexed single-cell resolved transcriptomic readouts to inform molecular pathways. Here, we present Perturb-FISH, which bridges these approaches by combining imaging spatial transcriptomics with parallel optical detection of in situ amplified guide RNAs. We show that Perturb-FISH recovers intracellular effects that are consistent with Perturb-seq results in a screen of lipopolysaccharide response in cultured monocytes, and uncover new intercellular and density-dependent regulation of the innate immune response. We further pair Perturb-FISH with a functional readout in a screen of autism spectrum disorder risk genes, showing common calcium activity phenotypes in induced pluripotent stem cell derived astrocytes and their associated genetic interactions and dysregulated molecular pathways. Perturb-FISH is thus a generally applicable method for studying the genetic and molecular associations of spatial and functional biology at single-cell resolution.


Conflict of interest statement

Conflicts of interest LB, BC, SLF are inventors on a patent application relating to work described in the manuscript which has been filed by the Broad Institute. The authors declare no other conflict of interest.

Figures

Figure 1.
Figure 1.. Perturb-FISH allows recording both gRNAs and transcriptome in cells in their spatial context.
A) Perturb-FISH workflow. i) Guides are packaged into lentiviral particles using a modified version of Lentiguide-puro that contains a T7 promoter between the end of the U6 promoter and the beginning of the guide. ii) The lentivirus is used to insert the guide sequence in the genome of the cell, resulting in genome editing. iii) T7 polymerase locally generates many copies of the gRNA in fixed cells. iv) DNA encoding probes anneal on both the target mRNA and the amplified gRNA. v) Fluorescent readouts anneal on the encoding probes, and are imaged. The fluorophores are cleaved, and this step is repeated. vi) After sequentially imaging the gRNAs, rounds of hybridization/imaging/cleavage continue to image the transcriptome in the same cells. B) Representative images of Perturb-FISH: Amplified gRNA generate a bright spot in the nuclei of cells, and the identity of gRNAs is encoded in the sequence of images in which they fluoresce (left). The transcriptome is read out the same way with MERFISH (right). T7 transcription yields higher signal amplification than the tiling of an mRNA with 30 probes, as visible by the larger size of the spots they generate. Scale bar = 10μm.
Figure 2.
Figure 2.. Overview of experimental design and analysis.
A) Overview of matched Perturb-seq and Perturb-FISH screens for genetic regulators of LPS response in THP1-cells. B) We compare perturbation effect sizes from the two screens to evaluate Perturb-FISH in terms of consistency, recapitulation of global regulatory structure, and power (Fig 3). C) We first characterize the effects of local cell density on perturbations effects, then we recover effects from perturbed cells onto their unperturbed control neighbors. We validate these results using both qPCR and RNAscope (Fig 4). D) We demonstrate the use of Perturb-FISH in conjunction with live imaging characterization of calcium phenotypes, in a screen of ASD risk genes (Fig 5).
Figure 3.
Figure 3.. Perturb-FISH robustness and power analysis.
A) Scatterplots of significant effect sizes (q<0.1) determined in Perturb-FISH sample 1 (x-axis) and the same effect sizes as determined in sample 2 (y-axis). Effects represent log-fold changes (LFC; natural log base) in expression relative to control cells. Individual plots depict significant effects across all perturbations or for individual perturbations MAP3K7, IRAK1 and TRAF6. B) Scatterplots of significant effect sizes (q<0.1) determined in Perturb-seq (x-axis) and combined analysis of both Perturb-FISH replicates (y-axis). Effects represent log-fold changes (LFC; natural log base) in expression relative to control cells. Individual plots depict significant effects across all perturbations or for individual perturbations MAP3K7, IRAK1 and TRAF6. C) Heatmap of LFC effect sizes (colorbar) found in Perturb-FISH (upper left triangle of each square) and the same effects in Perturb-Seq results (lower right triangle). Rows and columns are clustered based on UPGMA clustering of Perturb-FISH data. D) Held out validation accuracy (y-axis; Pearson correlation, left; AUPRC, right) of effects learned in downsampled Perturb-FISH data using increasing numbers of cells (x-axis). Orange line shows approximate correlation (left) or AUPRC (right) obtained with 50 cells in Perturb-seq, estimated using previously published data.
Figure 4.
Figure 4.. Perturb-FISH analysis of density-dependent and intercellular effects.
A) Violin plots show the expression level (y-axis) of TNF (top) and IL1a (bottom) in cells with different numbers of neighbors (x-axis). B) Heatmap of LFC effect sizes (colorbar) found by Perturb-FISH in cells with 2 or fewer neighbors (upper left triangle of each square) or 3 or more neighbors (lower right triangle). Effects represent log-fold changes (LFC; natural log base) in expression relative to control cells at matching density. Black squares highlight effects that are significant (q<0.1) in at least one density, and different by at least 0.4 between densities. C) Comparison of the density dependency of the effects of perturbing NFkB1, TRAF6, TAB2 or IKBKB on TNF, ETV3 or Il1a expression. Bars show the difference between effects at high density and effects at low density, when effects are measured with Perturb-FISH (in orange), or with a qPCR (blue). Effects are expressed as log-fold changes (LFC; natural log base). D) RNAscope images showing TNF transcripts (red) in NFkB1 KO cells (blue) and unperturbed cells (black) at both low density (left) and high density (right). E) Heatmap of LFC effect sizes (colorbar) of gene knock outs (x-axis) on the expression of genes (y-axis) in neighboring unperturbed cells. Effects are expressed as log-fold changes (LFC; natural log base). Circle size shows significance, with q values from 0.05 to 0.5.s
Figure 5.
Figure 5.. Perturb-FISH analysis of the role of ASD risk genes in generating different calcium activity phenotypes in astrocytes.
A) Traces showing the variation in cytoplasmic calcium (y-axis) concentration in example cells (line) across time (x-axis), following ATP stimulation. Variation in calcium concentration shown as difference in fluorescence. Cells are 6 groups using k-means clustering on features extracted from the traces: inactive cells, cells with transients and a high plateau, cells without transients but with a high plateau, cells with large transients, cells without transients and with a low plateau, and finally cells with delayed transients. B) Heatmap showing the enrichment (scale bar) of perturbations in 6 clusters of calcium activity, measured as the ratio between detected and expected frequency, and shown as log fold change in natural log base. C) Volcano plots showing LFC effect sizes (x-axis) versus significance (y-axis) for 6 example perturbations. Yellow indicate significantly affected genes (p<0.05), orange indicates the effect of the perturbation on its target gene. D) Heatmap showing genes with differential expression (x-axis) and their z-scored expression (scale bar) in 6 clusters of calcium activity.

References

    1. Chen S., Sanjana N.E., Zheng K., Shalem O., Lee K., Shi X., Scott D.A., Song J., Pan J.Q., Weissleder R., et al. (2015). Genome-wide CRISPR screen in a mouse model of tumor growth and metastasis. Cell 160, 1246–1260. 10.1016/j.cell.2015.02.038. - DOI - PMC - PubMed
    1. Kerek E.M., Cromwell C.R., and Hubbard B.P. (2021). Identification of Drug Resistance Genes Using a Pooled Lentiviral CRISPR/Cas9 Screening Approach. Methods Mol Biol 2381, 227–242. 10.1007/978-1-0716-1740-3_13. - DOI - PubMed
    1. Li B., Clohisey S.M., Chia B.S., Wang B., Cui A., Eisenhaure T., Schweitzer L.D., Hoover P., Parkinson N.J., Nachshon A., et al. (2020). Genome-wide CRISPR screen identifies host dependency factors for influenza A virus infection. Nat Commun 11, 164. 10.1038/s41467-019-13965-x. - DOI - PMC - PubMed
    1. Dixit A., Parnas O., Li B., Chen J., Fulco C.P., Jerby-Arnon L., Marjanovic N.D., Dionne D., Burks T., Raychowdhury R., et al. (2016). Perturb-Seq: Dissecting Molecular Circuits with Scalable Single-Cell RNA Profiling of Pooled Genetic Screens. Cell 167, 1853–1866 e1817. 10.1016/j.cell.2016.11.038. - DOI - PMC - PubMed
    1. Datlinger P., Rendeiro A.F., Schmidl C., Krausgruber T., Traxler P., Klughammer J., Schuster L.C., Kuchler A., Alpar D., and Bock C. (2017). Pooled CRISPR screening with single-cell transcriptome readout. Nat Methods 14, 297–301. 10.1038/nmeth.4177. - DOI - PMC - PubMed

References (Methods section)

    1. Satterstrom F.K., Kosmicki J.A., Wang J., Breen M.S., De Rubeis S., An J.Y., Peng M., Collins R., Grove J., Klei L., et al. (2020). Large-Scale Exome Sequencing Study Implicates Both Developmental and Functional Changes in the Neurobiology of Autism. Cell 180, 568–584 e523. 10.1016/j.cell.2019.12.036. - DOI - PMC - PubMed
    1. Gandal M.J., Haney J.R., Parikshak N.N., Leppa V., Ramaswami G., Hartl C., Schork A.J., Appadurai V., Buil A., Werge T.M., et al. (2018). Shared molecular neuropathology across major psychiatric disorders parallels polygenic overlap. Science 359, 693–697. 10.1126/science.aad6469. - DOI - PMC - PubMed
    1. Velmeshev D., Schirmer L., Jung D., Haeussler M., Perez Y., Mayer S., Bhaduri A., Goyal N., Rowitch D.H., and Kriegstein A.R. (2019). Single-cell genomics identifies cell type-specific molecular changes in autism. Science 364, 685–689. 10.1126/science.aav8130. - DOI - PMC - PubMed
    1. Hill A.J., McFaline-Figueroa J.L., Starita L.M., Gasperini M.J., Matreyek K.A., Packer J., Jackson D., Shendure J., and Trapnell C. (2018). On the design of CRISPR-based single-cell molecular screens. Nat Methods 15, 271–274. 10.1038/nmeth.4604. - DOI - PMC - PubMed
    1. Doench J.G., Fusi N., Sullender M., Hegde M., Vaimberg E.W., Donovan K.F., Smith I., Tothova Z., Wilen C., Orchard R., et al. (2016). Optimized sgRNA design to maximize activity and minimize off-target effects of CRISPR-Cas9. Nat Biotechnol 34, 184–191. 10.1038/nbt.3437. - DOI - PMC - PubMed

Publication types