[Preprint]. 2023 Dec 1:2023.11.29.568904.
doi: 10.1101/2023.11.29.568904.

AMP-activated protein kinase is necessary for Treg cell functional adaptation to microenvironmental stress

Affiliations

AMP-activated protein kinase is necessary for Treg cell functional adaptation to microenvironmental stress

Manuel A Torres Acosta et al. bioRxiv. .

Update in

Abstract

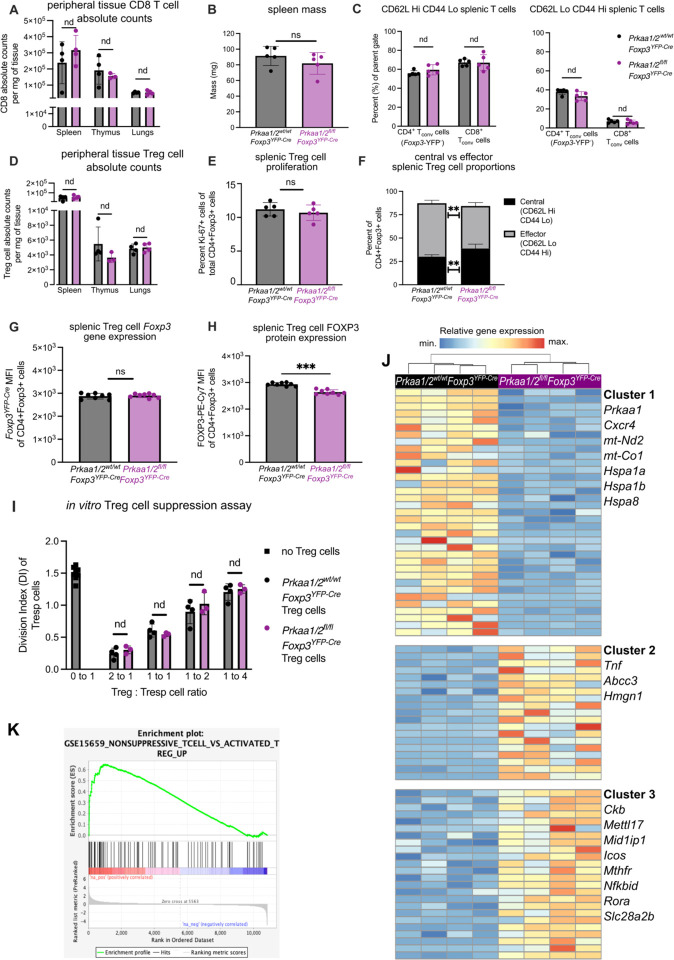
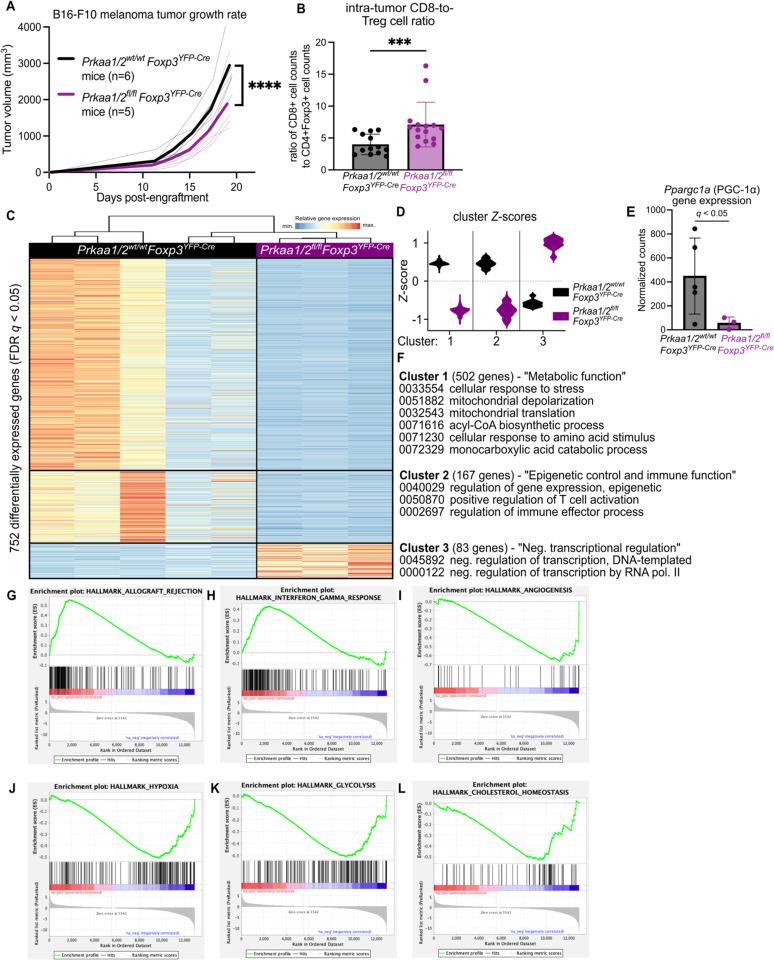
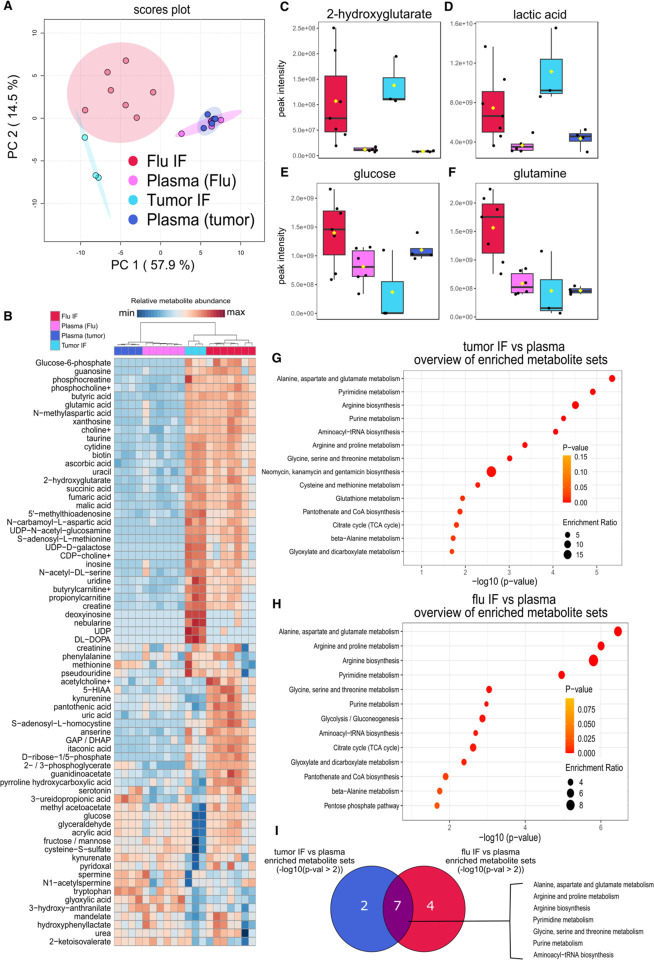
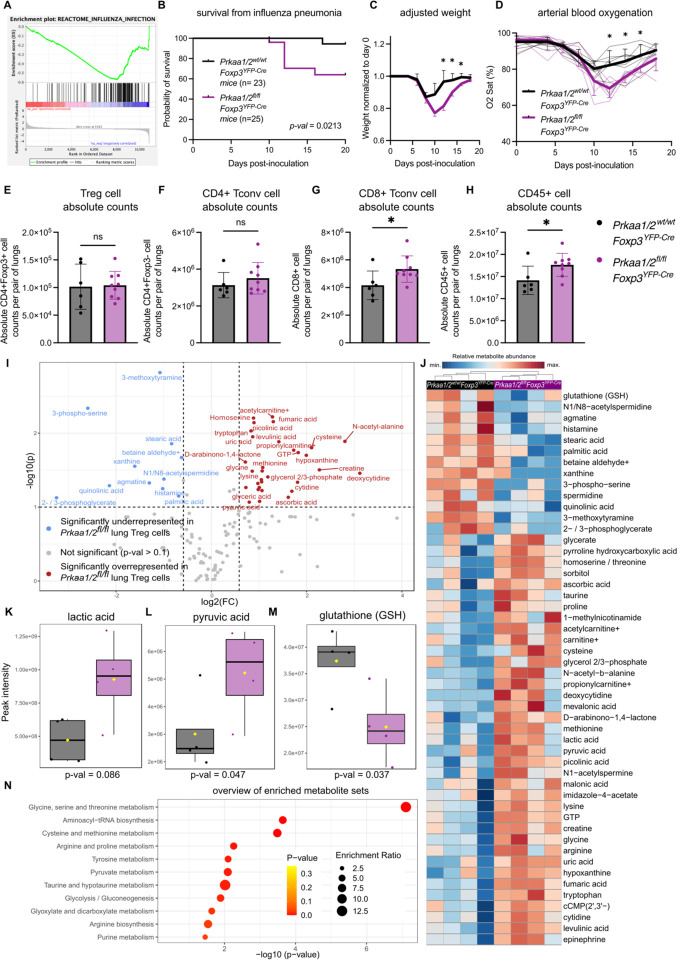
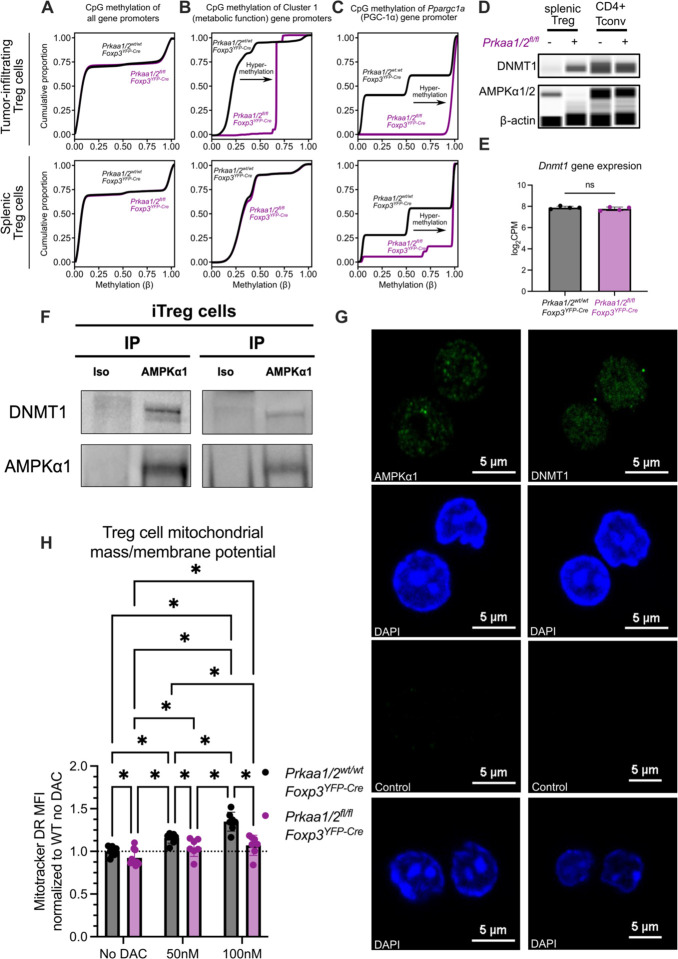
CD4+FOXP3+ regulatory T (Treg) cells maintain self-tolerance, suppress the immune response to cancer, and protect against tissue injury in the lung and other organs. Treg cells require mitochondrial metabolism to exert their function, but how Treg cells adapt their metabolic programs to sustain and optimize their function during an immune response occurring in a metabolically stressed microenvironment remains unclear. Here, we tested whether Treg cells require the energy homeostasis-maintaining enzyme AMP-activated protein kinase (AMPK) to adapt to metabolically aberrant microenvironments caused by malignancy or lung injury, finding that AMPK is dispensable for Treg cell immune-homeostatic function but is necessary for full Treg cell function in B16 melanoma tumors and during acute lung injury caused by influenza virus pneumonia. AMPK-deficient Treg cells had lower mitochondrial mass and exhibited an impaired ability to maximize aerobic respiration. Mechanistically, we found that AMPK regulates DNA methyltransferase 1 to promote transcriptional programs associated with mitochondrial function in the tumor microenvironment. In the lung during viral pneumonia, we found that AMPK sustains metabolic homeostasis and mitochondrial activity. Induction of DNA hypomethylation was sufficient to rescue mitochondrial mass in AMPK-deficient Treg cells, linking DNA methylation with AMPK function and mitochondrial metabolism. These results define AMPK as a determinant of Treg cell adaptation to metabolic stress and offer potential therapeutic targets in cancer and tissue injury.


Conflict of interest statement

Competing Interest Statement: NM is currently an employee and owns stock in Vertex Pharmaceuticals. BDS holds United States Patent No. US 10,905,706 B2, Compositions and Methods to Accelerate Resolution of Acute Lung Inflammation, and serves on the Scientific Advisory Board of Zoe Biosciences. The other authors have no competing interests to declare.

Figures

Figure 1.
Figure 1.. AMPKα1 and AMPKα2 are dispensable for Treg cell-mediated immune self-tolerance and Treg cell suppressive function at homeostasis.
(A) CD8+ conventional T (Tconv) cell absolute counts per milligram (mg) of Prkaa1/2wt/wtFoxp3YFP-Cre (control) and Prkaa1/2fl/flFoxp3YFP-Cre mouse spleen (n=4 control, n=4 Prkaa1/2fl/flFoxp3YFP-Cre), thymus (n=4 control, n=3 Prkaa1/2fl/flFoxp3YFP-Cre), and lung (n=4 control, n=4 Prkaa1/2fl/flFoxp3YFP-Cre). (B) Spleen mass of 8–12-week-old control (n=5) and Prkaa1/2fl/flFoxp3YFP-Cre (n=5) mice. (C) Frequency of naive (CD62LHiCD44Lo) and effector (CD62LoCD44Hi) splenic CD8+ and CD4+ Tconv cells out of total CD8+ and CD4+ cells, respectively (n=5 control, n=5 Prkaa1/2fl/flFoxp3YFP-Cre). (D) CD4+Foxp3+ cell absolute counts per mg of control and Prkaa1/2fl/flFoxp3YFP-Cre mouse spleen (n=4 control, n=4 Prkaa1/2fl/flFoxp3YFP-Cre), thymus (n=4 control, n=3 Prkaa1/2fl/flFoxp3YFP-Cre), and lung (n=4 control, n=4 Prkaa1/2fl/flFoxp3YFP-Cre). (E) Frequency of Ki-67+CD4+Foxp3+ cells out of total CD4+Foxp3+ splenocytes (n=5 control, n=5 Prkaa1/2fl/flFoxp3YFP-Cre). (F) Frequency of central (CD62LHiCD44Lo) and effector (CD62LoCD44Hi) CD4+Foxp3+cells out of total CD4+Foxp3+ splenocytes (n=5 control, n=5 Prkaa1/2fl/flFoxp3YFP-Cre). (GH) Foxp3−YFP (G) and FOXP3−PE-Cy7 (H) mean fluorescence intensity (MFI) of CD4+Foxp3+ splenocytes (n=8 control, n=8 Prkaa1/2fl/flFoxp3YFP-Cre). (I) Division index of CD4+Foxp3− splenic responder T (Tresp) cells co-cultured for 72 hours with varying ratios of CD4+Foxp3+ splenocytes (n=4 control, n=3 Prkaa1/2fl/flFoxp3YFP-Cre). (J) K-means clustering of 87 significant differentially expressed genes (FDR q-value < 0.05) identified between CD4+Foxp3+ cells sorted from spleens of control (n=4) and Prkaa1/2fl/flFoxp3YFP-Cre (n=4) mice with k=3 and scaled as Z-scores across rows. (K) Enrichment plot of the GSE15659_NONSUPPRESSIVE_TCELL_VS_ ACTIVATED_TREG_UP geneset (consists of genes down-regulated in comparison of resting Treg versus non-suppressive T cells) generated through gene set enrichment analysis (GSEA) preranked testing of the expressed genes of Prkaa1/2fl/flFoxp3YFP-Cre and control splenic Treg cells identified by RNA-sequencing. ** p or q < 0.01; *** p or q < 0.001; nd, no discovery, ns, not significant according to Mann-Whitney U test (B, E, G, H) with two-stage linear step-up procedure of Benjamini, Krieger, and Yekutieli with Q = 5% (A, C, D, F, I). Summary plots show all data points with mean and SD.
Figure 2.
Figure 2.. AMPKα1/α2 loss is sufficient to impair Treg cell suppressive function in the tumor microenvironment.
(A) Growth of B16 melanoma tumors in Prkaa1/2wt/wtFoxp3YFP-Cre (control, n=6) and Prkaa1/2fl/flFoxp3YFP-Cre (n=5) mice. (B) Ratio of live CD8+ cell counts to live CD4+Foxp3+ cell counts in single cell suspensions of B16 melanoma tumors harvested from the flanks of control (n=13) and Prkaa1/2fl/flFoxp3YFP-Cre (n=15) mice at day 15 post-engraftment. (C) K-means clustering of 752 significant differentially expressed genes (FDR q-value < 0.05) identified between CD4+Foxp3+ cells sorted from B16 melanoma tumors of control (n=5) and Prkaa1/2fl/flFoxp3YFP-Cre (n=3) mice with k=3 and scaled as Z-scores across rows. (D) Average z-scores for the three clusters shown in (C). (E) Normalized counts of Ppargc1a reads measured by RNA-sequencing (n=5 control, n=3 Prkaa1/2fl/flFoxp3YFP-Cre). (F) Selection of top gene ontology (GO) processes derived from Clusters 1, 2, and 3 (all with FDR q < 0.05). (GL) Enrichment plots (p < 0.05, FDR < 0.25) of the HALLMARK_ALLOGRAFT_REJECTION gene set (G), HALLMARK_INTERFERON_GAMMA_ RESPONSE gene set (H), HALLMARK_ANGIOGENESIS gene set (I), HALLMARK_HYPOXIA gene set (J), HALLMARK_GLYCOLYSIS gene set (K), and HALLMARK_CHOLESTEROL HOMEOSTASIS gene set (L). Enrichment plots were generated through GSEA preranked testing of the expressed genes of tumor-infiltrating Prkaa1/2fl/flFoxp3YFP-Cre and control Treg cells identified by RNA-sequencing. **** p < 0.0001 according to 2-way ANOVA with two-stage linear step-up procedure of Benjamini, Krieger, and Yekutieli with Q = 5% (A). *** p <0.001 according to Mann Whitney U test (B). Summary plots show all data points with mean and SD.
Figure 3.
Figure 3.. The metabolic landscape of the influenza virus-injured lung largely resembles the tumor microenvironment in its metabolite abundance; however, they differ in the abundance of key carbon sources.
(A) Principal component (PC) analysis of the peak intensities of metabolites identified via liquid chromatography tandem mass spectrometry (LC-MS) from B16 melanoma tumor (n=3) and influenza virus-infected lung (flu, n=7) interstitial fluid (IF) and paired plasma (n=4 tumor, n=6 flu) from the same animals. (B) Heatmap of the 70 most differentially represented metabolites in plasma, tumor IF, and flu IF according to one-way ANOVA (p-val < 0.1). (C-F) Abundance of key significant differentially represented metabolites: 2-hydroxyglutarate (C), lactic acid (D), glucose (E), and glutamine (F). (G) Results from overrepresentation analysis of the significant (p < 0.1) differentially represented metabolites between tumor IF and plasma. (H) Results from overrepresentation analysis of the significant (p < 0.1) differentially represented metabolites between flu IF and plasma. (I) Overlap in significantly (p < 0.01) enriched metabolite sets between tumor IF vs plasma comparison and flu IF vs plasma comparison according to overrepresentation analysis of flu IF versus plasma and tumor IF versus plasma.
Figure 4.
Figure 4.. AMPKα1/α2 are necessary for optimal Treg cell function in the lung during influenza pneumonia.
(A) Enrichment plot of the REACTOME_INFLUENZA_INFECTION geneset (p < 0.05, FDR < 0.25) generated through GSEA preranked testing of the expressed genes of Prkaa1/2wt/wtFoxp3YFP-Cre (control) and Prkaa1/2fl/flFoxp3YFP-Cre CD4+Foxp3+ splenocytes identified by RNA-sequencing shown in Fig 1J. (B) Survival of control (n=23) and Prkaa1/2fl/flFoxp3YFP-Cre (n=25) mice following intra-tracheal inoculation of 12.5 plaque forming units (PFUs) of influenza A/WSN/33 H1N1 (influenza) virus. (CD) Weight (C), and arterial oxyhemoglobin saturation (D) over time of control (n=6) and Prkaa1/2fl/flFoxp3YFP-Cre (n=8) mice following intra-tracheal inoculation of 12.5 PFUs of influenza virus. (E-H) Absolute counts of CD4+Foxp3+ cells (E), CD4+Foxp3− cells (F), CD8+ cells (G), and CD45+ cells (H) per pair of lungs in control (n=6) and Prkaa1/2fl/flFoxp3YFP-Cre (n=9) mice at day 10 post-influenza virus inoculation. (I) Volcano plot of abundance of metabolites detected in control (n=4) and Prkaa1/2fl/flFoxp3YFP-Cre (n=4) Treg cells sorted from lungs at day 10 post-influenza virus-inoculation. (J) Heatmap of top 50 differentially represented metabolites between control (n=4) and Prkaa1/2fl/flFoxp3YFP-Cre (n=4) Treg cells sorted from lungs at day 10 post-influenza virus inoculation. (KM) Peak intensities measured for lactic acid (K), pyruvic acid (L), and glutathione GSH (M) in Treg cells from the lungs of control (n=4) and Prkaa1/2fl/flFoxp3YFP-Cre (n=4) mice at day 10 post-influenza virus-inoculation. (N) Results of overrepresentation analysis from the significant (p < 0.1, log2FC ≥ 1.5 or ≤ −1.5) differentially represented metabolites identified in (I). Survival curve (B) p was determined using log-rank (Mantel-Cox) test. * q < 0.05 according to two-way ANOVA with two-stage linear step-up procedure of Benjamini, Krieger, and Yekutieli with Q = 5% (CD). * p < 0.05, ns not significant according to Mann-Whitney U test (EH). Summary plots show all data points with mean and SD.
Figure 5.
Figure 5.. Treg cell AMPKα is necessary for maximal mitochondrial function.
(A) Representative oxygen consumption rate (OCR) over time of CD4+Foxp3+ splenocytes from Prkaa1/2wt/wtFoxp3YFP-Cre (control, n=3) and Prkaa1/2fl/flFoxp3YFP-Cre (n=2) mice following treatment of oligomycin (2.5 uM), carbonyl cyanide m-chlorophenylhydrazone (CCCP; 10 uM), and Antimycin A/Piercidin (A/P; 2 uM each) as measured by a metabolic flux assay. (BC) Basal (B) and maximal (C) OCR of CD4+Foxp3+ splenocytes from control (n=6) and Prkaa1/2fl/flFoxp3YFP-Cre (n=6) mice, some of which are shown in (A). (DE) MitoTracker Deep Red (MitoTracker DR) mean fluorescence intensity (MFI) of CD4+Foxp3+ splenocytes at homeostasis (D; n=7 control, n=8 Prkaa1/2fl/flFoxp3YFP-Cre mice) and lung CD4+Foxp3+ cells at day 10 post-influenza virus inoculation (E; same cohort as in Fig 4E–H and Supplemental Fig 6C–K, M–R, n=6 control, n=9 Prkaa1/2fl/flFoxp3YFP-Cre mice). (FG) Basal (F) and maximal (G) extracellular acidification rate (ECAR) of CD4+Foxp3+ splenocytes from control (n=6) and Prkaa1/2fl/flFoxp3YFP-Cre (n=7) mice. (H) LC3B-PE MFI of CD4+Foxp3+ splenocytes from control (n=8) and Prkaa1/2fl/flFoxp3YFP-Cre (n=8) mice. * p < 0.05, ** p < 0.01, ns not significant according to Mann-Whitney U test (BI). Summary plots show all data points with mean and SD.
Figure 6.
Figure 6.. AMPKα1 interacts with DNMT1 to demethylate the promoter of mitochondrial genes in tumor-infiltrating Treg cells.
(AC) CpG methylation of all gene promoters (A), gene promoters of cluster 1 genes identified by k-means clustering of the RNA-sequencing shown in Fig 2C–F (B), and the Ppargc1a promoter (C) in tumor-infiltrating CD4+Foxp3+ cells (n=4 Prkaa1/2wt/wtFoxp3YFP-Cre or control, n=2 Prkaa1/2fl/flFoxp3YFP-Cre) and splenic CD4+Foxp3+ cells at homeostasis (n=3 control, n=3 Prkaa1/2fl/flFoxp3YFP-Cre) (D) DNMT1 protein expression of splenic CD4+Foxp3+ (Treg) and CD4+Foxp3− (CD4+ Tconv) cells at homeostasis (n=3 control, n=3 Prkaa1/2fl/flFoxp3YFP-Cre; biological replicates were pooled and run as a single well). (E) Dnmt1 gene expression of splenic CD4+Foxp3+ cells at homeostasis (n=4 control, n=4 Prkaa1/2fl/flFoxp3YFP-Cre) as measured by RNA-sequencing shown in Fig 1. (F) anti-AMPKα1 and isotype control immunoprecipitates from ex vivo induced (i)Treg cell lysates blotted for DNMT1 protein. (G) Representative microscopy images of AMPKα-sufficient and -deficient iTreg cells showing AMPKα1 and DNMT1 subcellular localization. (H) Mitotracker Deep Red (Mitotracker DR) mean fluorescence intensity (MFI) of AMPKα-sufficient (control) and -deficient splenic CD4+Foxp3+ cells treated with either vehicle (n=8 control, n=10 Prkaa1/2fl/flFoxp3YFP-Cre), 50 nM decitabine (DAC, n=7 control, n=7 Prkaa1/2fl/flFoxp3YFP-Cre), or 100 nM DAC (n=7 control, n=7 Prkaa1/2fl/flFoxp3YFP-Cre). * p or q < 0.05, ns not significant according to Mann-Whitney U test (E) with two-stage linear step-up procedure of Benjamini, Krieger, and Yekutieli with Q = 5% (H). Summary plots show all data points with mean and SD.

References

    1. Sakaguchi S., Sakaguchi N., Asano M., Itoh M., Toda M., Immunologic self-tolerance maintained by activated T cells expressing IL-2 receptor alpha-chains (CD25). Breakdown of a single mechanism of self-tolerance causes various autoimmune diseases. J Immunol 155, 1151–1164 (1995). - PubMed
    1. Bacchetta R. et al. , Defective regulatory and effector T cell functions in patients with FOXP3 mutations. J Clin Invest 116, 1713–1722 (2006). - PMC - PubMed
    1. Weinberg S. E., Singer B. D., Toward a Paradigm to Distinguish Distinct Functions of FOXP3(+) Regulatory T Cells. Immunohorizons 5, 944–952 (2021). - PMC - PubMed
    1. Fisher S. A. et al. , Transient Treg depletion enhances therapeutic anti-cancer vaccination. Immun Inflamm Dis 5, 16–28 (2017). - PMC - PubMed
    1. Stewart C. A. et al. , Interferon-dependent IL-10 production by Tregs limits tumor Th17 inflammation. J Clin Invest 123, 4859–4874 (2013). - PMC - PubMed

Publication types