[Preprint]. 2024 Feb 16:rs.3.rs-3576483.
doi: 10.21203/rs.3.rs-3576483/v2.

Decoding functional hematopoietic progenitor cells in the adult human lung

Affiliations

Decoding functional hematopoietic progenitor cells in the adult human lung

Catharina Conrad et al. Res Sq. .

Update in

  • Decoding functional hematopoietic progenitor cells in the adult human lung.
    Conrad C, Magnen M, Tsui J, Wismer H, Naser M, Venkataramani U, Samad B, Cleary SJ, Qiu L, Tian JJ, De Giovanni M, Mende N, Leavitt AD, Passegué E, Laurenti E, Combes AJ, Looney MR. Conrad C, et al. Blood. 2025 May 1;145(18):1975-1986. doi: 10.1182/blood.2024027884. Blood. 2025. PMID: 40014797 Free PMC article.

Abstract

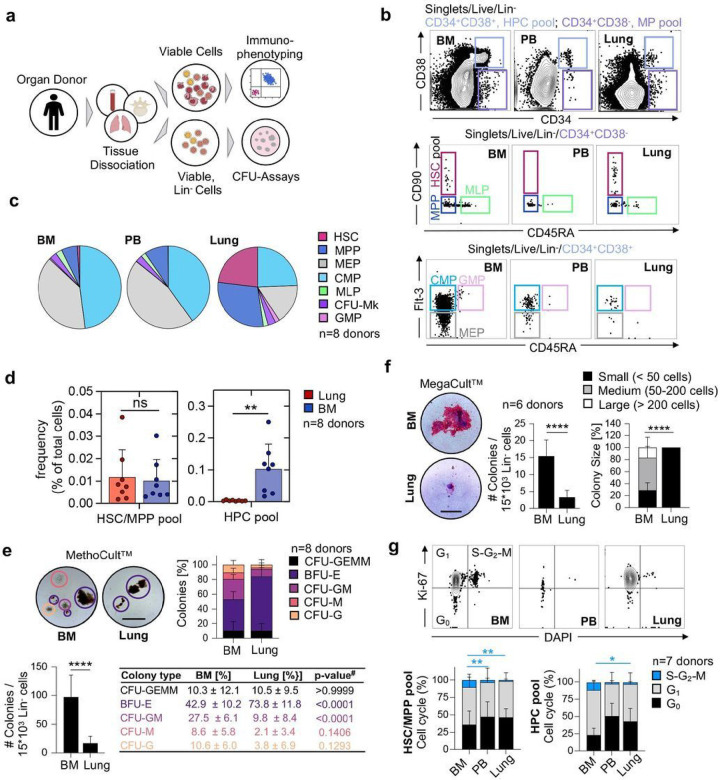
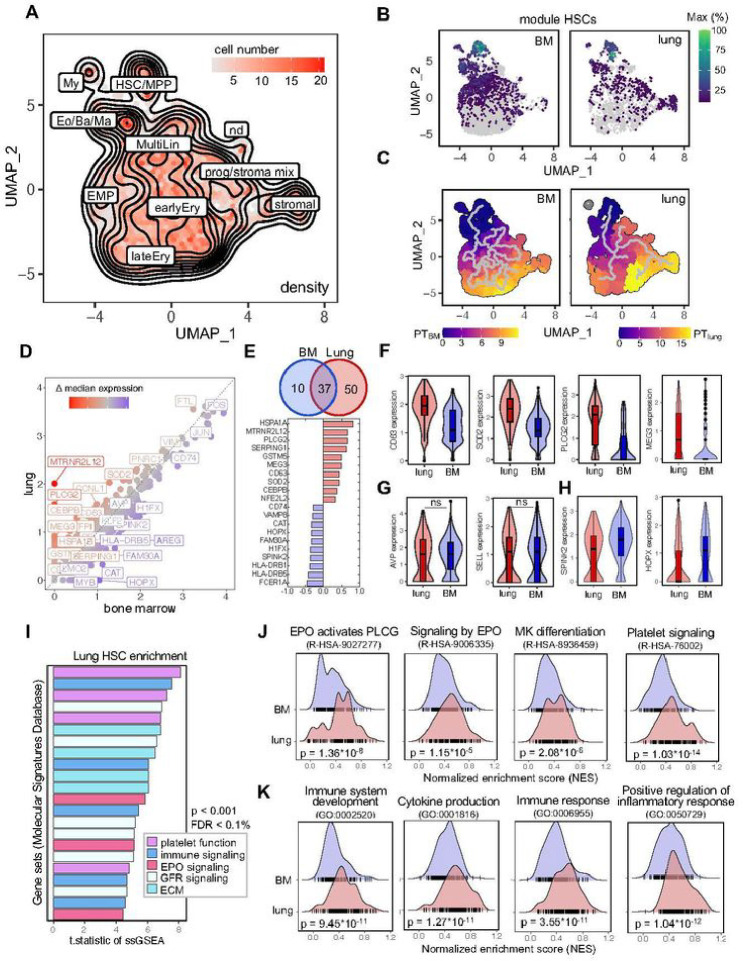
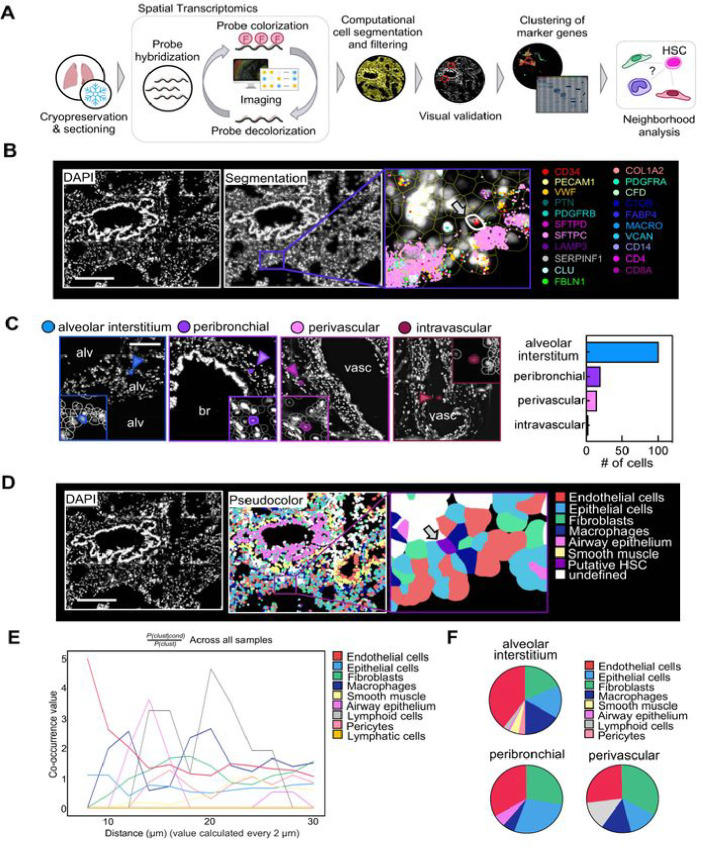
The bone marrow is the main site of blood cell production in adults, however, rare pools of hematopoietic stem and progenitor cells with self-renewal and differentiation potential have been found in extramedullary organs. The lung is primarily known for its role in gas exchange but has recently been described as a site of blood production in mice. Here, we show that functional hematopoietic precursors reside in the extravascular spaces of the human lung, at a frequency similar to the bone marrow, and are capable of proliferation and engraftment. The organ-specific gene signature of pulmonary and medullary CD34+ hematopoietic progenitors indicates greater baseline activation of immune, megakaryocyte/platelet and erythroid-related pathways in lung progenitors. Spatial transcriptomics mapped blood progenitors in the lung to a vascular-rich alveolar interstitium niche. These results identify the lung as a pool for uniquely programmed blood stem and progenitor cells with the potential to support hematopoiesis in humans.

Keywords: Blood and Immune Cell Production; Erythropoeisis; Extramedullary Hematopoeisis; Hematopoeitic stem and progenitor cells; Stem Cell Biology; Stem Cell Transplantation.


Conflict of interest statement

Declarations The authors declare no competing financial interests.

Figures

Figure 1
Figure 1
The human lung contains phenotypic hematopoietic progenitors with in vitro proliferation and differentiation capacity. (A) Pipeline for flow-cytometric immunophenotyping and evaluation of in vitro colony-forming capacity of hematopoietic progenitor cells from BM, lung and PB of organ donors. (B) Normalized flow cytometry plots of BM, PB in the Live/Lin− gate from a representative donor showing stem cell subsets within the multipotent (MP [CD34+CD38−], light purple) and the hematopoietic progenitor cell (HPC [CD34+CD38+], light blue) pool. HSC, hematopoietic stem cell; MPP, multipotent progenitor; MLP, multilymphoid progenitor; CMP, common myeloid progenitor; MEP, megakaryocyte-erythroid progenitor; GMP, granulocyte-macrophage progenitor; CFU-Mk, colony-forming-unit megakaryocyte. (C) Composition of hematopoietic progenitor subsets in the BM, PB and lung (n=8). (D) Frequency of cells in the HSC/MPP and HPC pool as a percentage of total nucleated cells in the lung or BM, respectively. Individual values are shown, bars represent mean ± SD. Student’s t-test, **p<0.01; ns, not significant. (E) Culture initiating capacity of lung and BM progenitors in MethoCultTM (n=8): Representative colonies (scale bar, 500μm), colony composition and colony quantity for progenitors derived from the BM and lung. Student’s t-test, ****p<0.0001, #ANOVA followed by Sidak’s multiple comparison test. CFU, colony-forming unit; BFU-E (purple), burst-forming unit-erythroid; G (orange), granulocyte; M (red), macrophage; GM (pink), granulocyte macrophage; GEMM (black), granulocyte, erythroid, macrophage, megakaryocyte. (F) Culture initiating capacity of lung and BM progenitors in MegaCultTM (n=6): Representative colonies (scale bar, 100μm), colony quantity and colony size for progenitors from the BM and lung. Bar graph represents mean number of colonies ± SD, Student’s t-test, ****p<0.0001. Stacked bars represent mean proportion ± SD, Kruskal-Wallis test, ****p<0.0001. (G) Proportions of cycling (S-G2-M phase (blue), Ki-67+DAPI+), preparing/growing (G1 (grey), Ki-67+DAPI−) and resting cells (G0 (black), Ki-67−DAPI−) in the HSC/MPP and HPC pool from BM, PB and lung (n=7). Stacked bars represent mean proportion ± SD, ANOVA followed by Sidak’s multiple comparison test, **p<0.01, *p<0.05. For comparisons not indicated, no statistically significant differences were observed.
Figure 3
Figure 3
Comparative transcriptomic analysis of lung and BM HSCs reveals shared and unique gene expression profiles. (A) Annotated, batch-corrected UMAP projection with cell density representation of merged BM and lung Lin-CD34+ progenitor subsets from 8 human donors. HSC/MPP, hematopoietic stem cell/multipotent progenitor; My, myeloid cell; Eo/Ba/Ma, eosinophil/basophil/mast cell progenitor; MultiLin, multi-lineage; EMP, erythroid megakaryocytic progenitor; earlyEry, early erythroid progenitor; lateEry, late erythroid progenitor; prog/stroma mix, progenitor stroma cell mix; nd, not determined. (B) Grouping of gene expression patterns into modules using Monocle3. Aggregate expression values of genes in the module highly specific for HSCs (Figure S6) are shown individually for the BM and lung. (C) Pseudotime calculation for each cell within the BM and lung using Monocle3 to infer progression through different cellular differentiation to provide insights into the developmental trajectory. (D) Scatter plot of median gene expression of cells in the HSC/MPP cluster from the lung (red) and BM (blue) to visualize consistent (grey) and differentially (highlighted) expressed genes. (E) Venn diagram and top 10 differentially expressed genes. The number in each circle represents the amount of differentially expressed genes between lung (red) and BM (blue), the overlapping number indicates mutual differentially expressed genes based on the Wilcoxon ran-sum test in Seurat’s ‘FindMarkers’ function. (F) Box and violin plots showing the distribution of selected genes upregulated in pulmonary hematopoietic progenitor cells. Wilcoxon adjusted p-value <0.001. (G) Selection of marker genes shared between lung and BM as box and violin plots, respectively. ns, not significant. (H) Box and violin plots showing the distribution of markers genes upregulated in BM HSCs, Wilcoxon adjusted p-value <0.001. (I) T.statistic of ssGSEA scores for selected gene sets (Hallmark, Reactome, Biocarta, KEGG) enriched in pulmonary HSCs categorized by recurring functions. EPO, erythropoietin; ECM, extracellular matrix, FDR, false discovery rate; GFR, growth factor receptor; ssGSEA, single-sample Gene Set Enrichment Analysis. (J) Enrichment ridge plots comparing the distribution of enrichment scores in HSCs from lung (red) and BM (blue) of selected Reactome pathways. Rug plots indicate the scores of individual cells along the ridge plot. P-values are given in the figure, FDR R-HSA-9027277 = 2.38*10−4; FDR R-HSA-9006335 = 0.09; FDR R-HSA-8936459 = 0.03; R-HSA-76002 = 2.03*10−10. (K) Enrichment ridge plots showing the distribution of enrichment scores in lung (red) and BM (blue) with individual cell placement on the rug plot to compare selected GOBP (Gene Ontology Biological Process) gene set enrichments. P-values are given in the figure, FDR GO:0002520 = 1.77*10−6; FDR GO:0001816 = 2.42*10−7; FDR GO:0006955 = 6.70*10−7; GO:0050729 = 2.02*10−8.
Figure 4
Figure 4
Spatial mapping of phenotypic CD34+ HSPCs in the lung. (A) Spatial transcriptomics analysis workflow. smFISH was performed to visualize gene expression in human lung tissue. Transcripts were assigned to individual cells after cell segmentation and putative HSPCs were computationally identified based on their gene signature and visually validated. Lung stromal and immune cells were annotated based on marker gene clusters (Figure S8). Subsequently, co-occurence analysis was performed. (B) Representative image of a putative HSPC in its pulmonary niche. Upper panel (left to right): DAPI staining, QuPath segmentation, zoom on putative HSC (arrow). Selected transcripts are shown. Scale bar, 250 μm (C) Anatomic location of candidate cells in the lung. Representative images of phenotypic HSPCs in four major locations (alveolar interstitium, peribronchial, perivascular or intravascular) and proportion of cells in each location. Alv, alveolar space; br, bronchus; vasc, vasculature. Scale bar, 150μm. (D) Pseudo-coloring of cell types in the lung tissue based on marker clustering (Figure S8). Zoom on putative HSPC in niche. Scale bar, 250 μm. (E) Squidpy co-occurrence score computed every 2 μm between putative HSPCs and the rest of the clusters across lung tissue sections from 4 organ donors. High score values indicate greater co-occurrence probability; endothelial cells (red) and macrophages (dark blue) co-occur with the HSPCs at short distances. (F) Pie graphs showing the proportion of neighboring cells within a radius of 20 μm from the putative HSPCs in the major anatomic locations.

References

    1. Weissman I.L., and Shizuru J.A. (2008). The origins of the identification and isolation of hematopoietic stem cells, and their capability to induce donor-specific transplantation tolerance and treat autoimmune diseases. Blood 112, 3543–3553. 10.1182/blood-2008-08-078220. - DOI - PMC - PubMed
    1. Abkowitz J.L., Catlin S.N., McCallie M.T., and Guttorp P. (2002). Evidence that the number of hematopoietic stem cells per animal is conserved in mammals. Blood 100, 2665–2667. 10.1182/blood-2002-03-0822. - DOI - PubMed
    1. Nombela-Arrieta C., and Manz M.G. (2017). Quantification and three-dimensional microanatomical organization of the bone marrow. Blood Adv 1, 407–416. 10.1182/bloodadvances.2016003194. - DOI - PMC - PubMed
    1. Wilkinson A.C., Igarashi K.J., and Nakauchi H. (2020). Haematopoietic stem cell self-renewal in vivo and ex vivo. Nat Rev Genet 21, 541–554. 10.1038/s41576-020-0241-0. - DOI - PMC - PubMed
    1. Verovskaya E.V., Dellorusso P.V., and Passegue E. (2019). Losing Sense of Self and Surroundings: Hematopoietic Stem Cell Aging and Leukemic Transformation. Trends Mol Med 25, 494–515. 10.1016/j.molmed.2019.04.006. - DOI - PMC - PubMed

Publication types

LinkOut - more resources