[Preprint]. 2023 Dec 1:2023.11.30.569198.
doi: 10.1101/2023.11.30.569198.

The Complete Sequence and Comparative Analysis of Ape Sex Chromosomes

Kateryna D Makova  1 Brandon D Pickett  2 Robert S Harris  1 Gabrielle A Hartley  3 Monika Cechova  4 Karol Pal  1 Sergey Nurk  2 DongAhn Yoo  5 Qiuhui Li  6 Prajna Hebbar  4 Barbara C McGrath  1 Francesca Antonacci  7 Margaux Aubel  8 Arjun Biddanda  6 Matthew Borchers  9 Erich Bomberg  8   10 Gerard G Bouffard  2 Shelise Y Brooks  2 Lucia Carbone  11   12 Laura Carrel  13 Andrew Carroll  14 Pi-Chuan Chang  14 Chen-Shan Chin  15 Daniel E Cook  14 Sarah J C Craig  1 Luciana de Gennaro  7 Mark Diekhans  4 Amalia Dutra  2 Gage H Garcia  5 Patrick G S Grady  3 Richard E Green  4 Diana Haddad  16 Pille Hallast  17 William T Harvey  5 Glenn Hickey  4 David A Hillis  18 Savannah J Hoyt  3 Hyeonsoo Jeong  5 Kaivan Kamali  1 Sergei L Kosakovsky Pond  19 Troy M LaPolice  1 Charles Lee  17 Alexandra P Lewis  5 Yong-Hwee E Loh  18 Patrick Masterson  16 Rajiv C McCoy  6 Paul Medvedev  1 Karen H Miga  4 Katherine M Munson  5 Evgenia Pak  2 Benedict Paten  4 Brendan J Pinto  20 Tamara Potapova  9 Arang Rhie  2 Joana L Rocha  21 Fedor Ryabov  22 Oliver A Ryder  23 Samuel Sacco  4 Kishwar Shafin  14 Valery A Shepelev  24 Viviane Slon  25 Steven J Solar  2 Jessica M Storer  3 Peter H Sudmant  21 Sweetalana  1 Alex Sweeten  2   6 Michael G Tassia  6 Françoise Thibaud-Nissen  16 Mario Ventura  7 Melissa A Wilson  20 Alice C Young  2 Huiqing Zeng  1 Xinru Zhang  1 Zachary A Szpiech  1 Christian D Huber  1 Jennifer L Gerton  9 Soojin V Yi  18 Michael C Schatz  6 Ivan A Alexandrov  25 Sergey Koren  2 Rachel J O'Neill  3 Evan Eichler  5   26 Adam M Phillippy  2
Affiliations

The Complete Sequence and Comparative Analysis of Ape Sex Chromosomes

Kateryna D Makova et al. bioRxiv. .

Update in

  • The complete sequence and comparative analysis of ape sex chromosomes.
    Makova KD, Pickett BD, Harris RS, Hartley GA, Cechova M, Pal K, Nurk S, Yoo D, Li Q, Hebbar P, McGrath BC, Antonacci F, Aubel M, Biddanda A, Borchers M, Bornberg-Bauer E, Bouffard GG, Brooks SY, Carbone L, Carrel L, Carroll A, Chang PC, Chin CS, Cook DE, Craig SJC, de Gennaro L, Diekhans M, Dutra A, Garcia GH, Grady PGS, Green RE, Haddad D, Hallast P, Harvey WT, Hickey G, Hillis DA, Hoyt SJ, Jeong H, Kamali K, Pond SLK, LaPolice TM, Lee C, Lewis AP, Loh YE, Masterson P, McGarvey KM, McCoy RC, Medvedev P, Miga KH, Munson KM, Pak E, Paten B, Pinto BJ, Potapova T, Rhie A, Rocha JL, Ryabov F, Ryder OA, Sacco S, Shafin K, Shepelev VA, Slon V, Solar SJ, Storer JM, Sudmant PH, Sweetalana, Sweeten A, Tassia MG, Thibaud-Nissen F, Ventura M, Wilson MA, Young AC, Zeng H, Zhang X, Szpiech ZA, Huber CD, Gerton JL, Yi SV, Schatz MC, Alexandrov IA, Koren S, O'Neill RJ, Eichler EE, Phillippy AM. Makova KD, et al. Nature. 2024 Jun;630(8016):401-411. doi: 10.1038/s41586-024-07473-2. Epub 2024 May 29. Nature. 2024. PMID: 38811727 Free PMC article.

Abstract

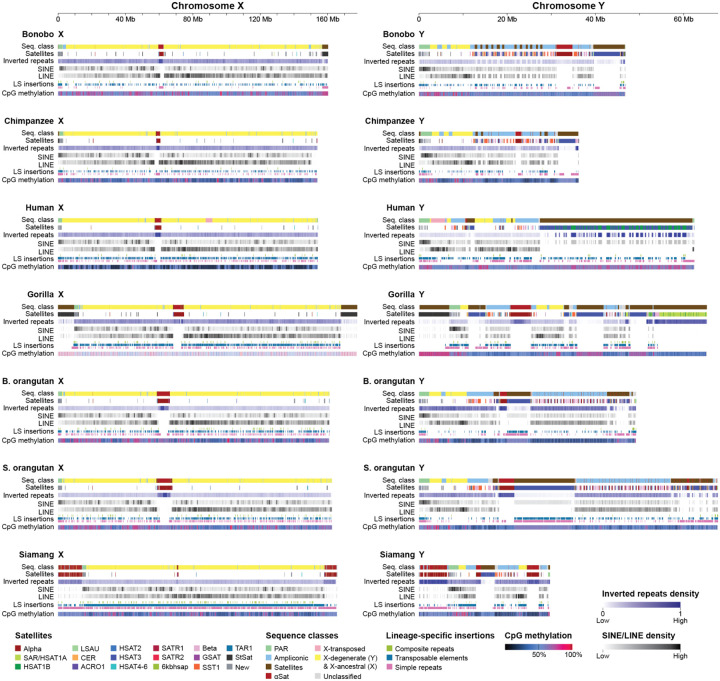
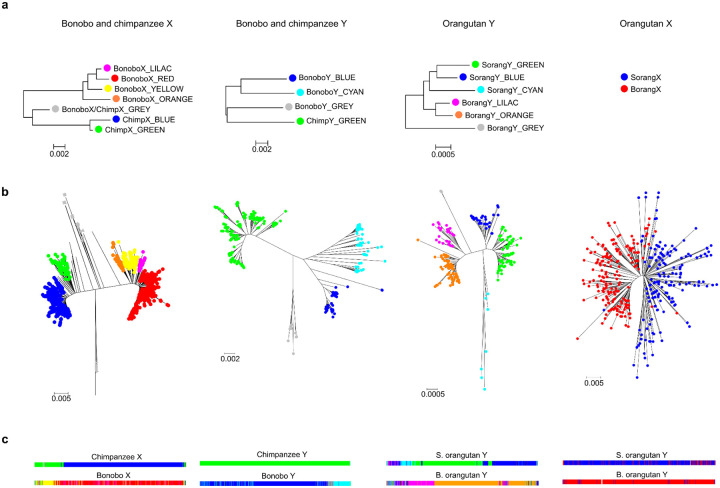
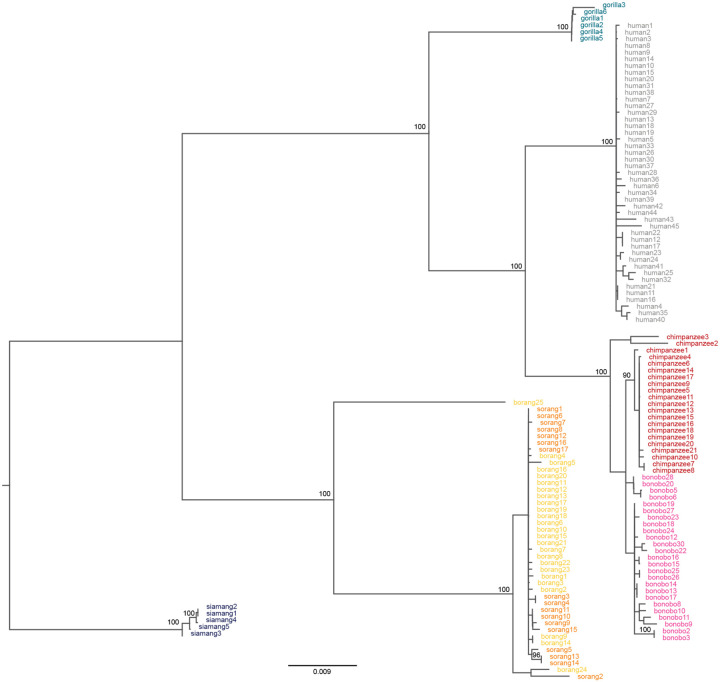
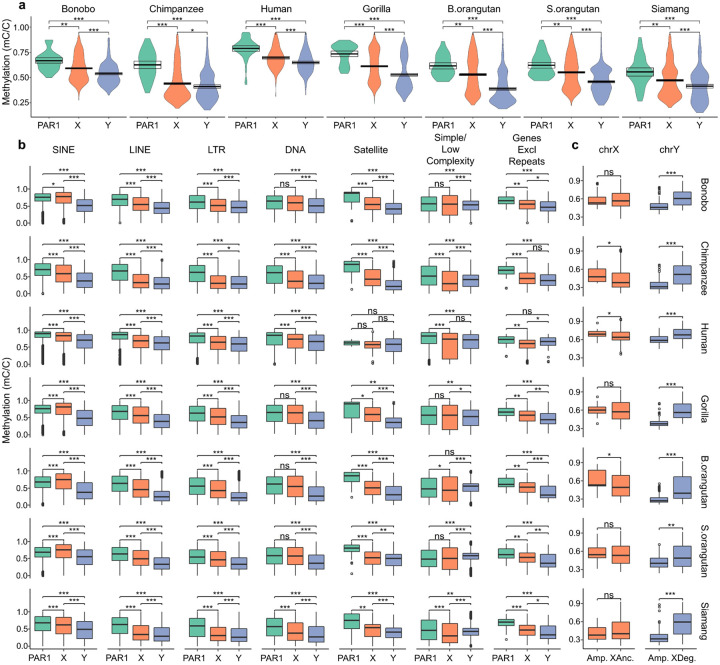
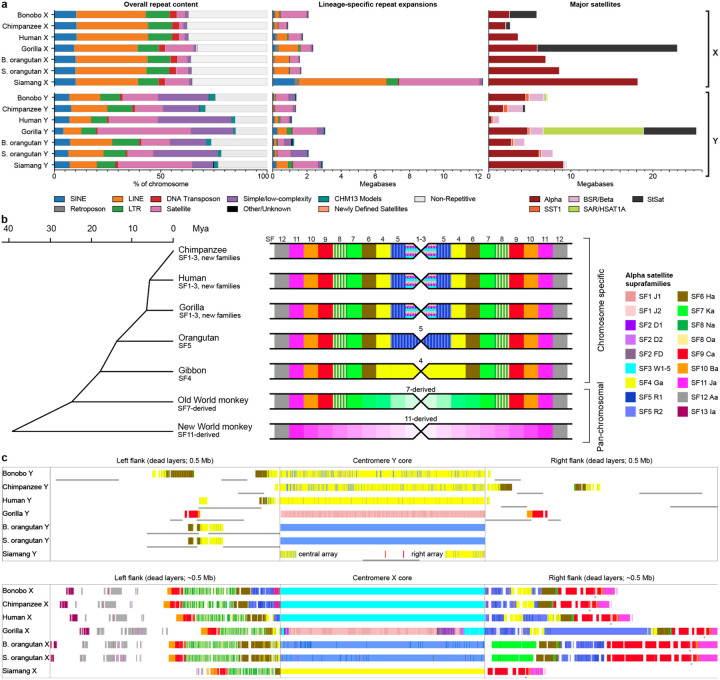
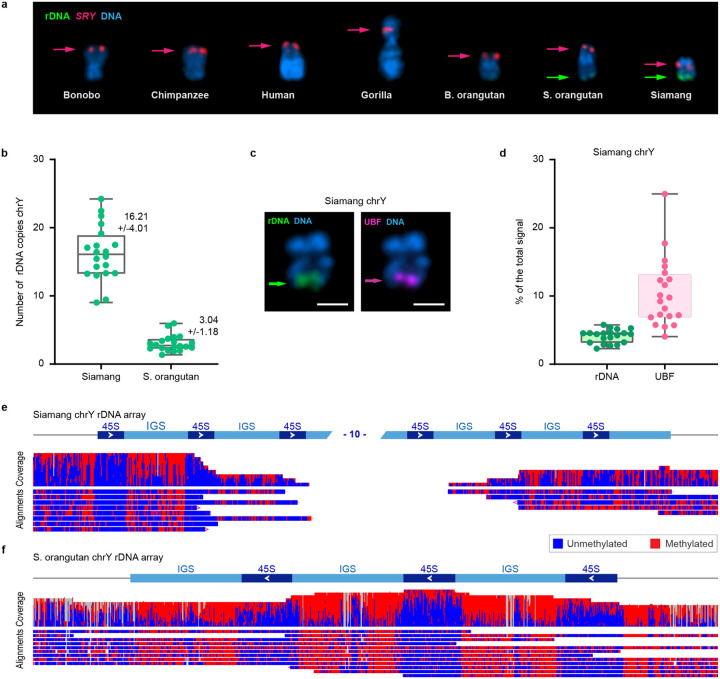
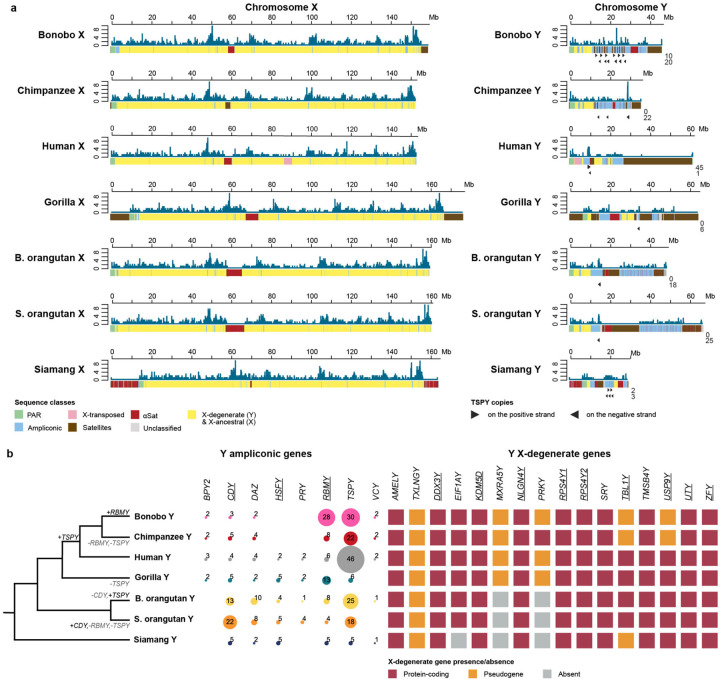
Apes possess two sex chromosomes-the male-specific Y and the X shared by males and females. The Y chromosome is crucial for male reproduction, with deletions linked to infertility. The X chromosome carries genes vital for reproduction and cognition. Variation in mating patterns and brain function among great apes suggests corresponding differences in their sex chromosome structure and evolution. However, due to their highly repetitive nature and incomplete reference assemblies, ape sex chromosomes have been challenging to study. Here, using the state-of-the-art experimental and computational methods developed for the telomere-to-telomere (T2T) human genome, we produced gapless, complete assemblies of the X and Y chromosomes for five great apes (chimpanzee, bonobo, gorilla, Bornean and Sumatran orangutans) and a lesser ape, the siamang gibbon. These assemblies completely resolved ampliconic, palindromic, and satellite sequences, including the entire centromeres, allowing us to untangle the intricacies of ape sex chromosome evolution. We found that, compared to the X, ape Y chromosomes vary greatly in size and have low alignability and high levels of structural rearrangements. This divergence on the Y arises from the accumulation of lineage-specific ampliconic regions and palindromes (which are shared more broadly among species on the X) and from the abundance of transposable elements and satellites (which have a lower representation on the X). Our analysis of Y chromosome genes revealed lineage-specific expansions of multi-copy gene families and signatures of purifying selection. In summary, the Y exhibits dynamic evolution, while the X is more stable. Finally, mapping short-read sequencing data from >100 great ape individuals revealed the patterns of diversity and selection on their sex chromosomes, demonstrating the utility of these reference assemblies for studies of great ape evolution. These complete sex chromosome assemblies are expected to further inform conservation genetics of nonhuman apes, all of which are endangered species.


Conflict of interest statement

Competing Interests EEE is a scientific advisory board (SAB) member of Variant Bio, Inc. RJO is a scientific advisory board (SAB) member of Colossal Biosciences, Inc. CL is a scientific advisory board (SAB) member of Nabsys, Inc. and Genome Insight, Inc.

Figures

Extended Data Figure 1.
Extended Data Figure 1.. Repeats and satellites on the X and Y chromosomes
Repeats and satellites shown with sequence class annotations and CpG methylation for chromosomes X and Y. The scales are different between chromosomes X and Y. The tracks for each species are: (1) sequence class annotation, (2) satellites, (3) inverted repeats, (4) SINEs, (5) LINEs, (6) lineage-specific (LS) insertions of composite repeats (green), transposable elements (blue), and satellites, simple repeats, and low-complexity repeats (pink), and (7) CpG methylation. The inverted repeats, SINEs, and LINEs tracks are plotted in blocks with darker colors representing a higher density. CpG methylation is also displayed on a gradient between dark blue (low methylation) and magenta (high methylation) based on the percentage of supporting aligned ONT reads. The remaining tracks (sequence class, satellites, and LS insertions) are displayed as presence/absence (color/no color). The class and satellite tracks are discrete, whereas the LS insertions are plotted as mini tracks to avoid overplotting where >1 label applies.
Extended Data Figure 2.
Extended Data Figure 2.. Alpha satellite higher order repeat (HOR) haplotypes are species-specific in Pongo and Pan (except for the few distal HOR copies)
(A) Consensus HOR haplotype (HORhap) trees, (B) HOR trees, and (C) HORhap UCSC Genome Browser annotation tracks for active alpha satellite arrays of chromosomes X and Y in two Pan and two Pongo species. The details of building the trees and the tracks are in Note S6. Each colored branch in each HOR tree represents a HORhap. All branches in HOR trees are species-specific, except for the GREY branch in Pan cenX tree, for which mixing of chimpanzee (square markers) and bonobo (triangle markers) HORs in the GREY cluster was observed. All branches were used to obtain HORhap consensus sequences and HMMs further used in HMMER-based HORhap classification tool to produce HORhap annotations of the active HOR arrays shown in the Browser tracks. The larger branches with shorter twigs correspond to the younger large active HORhaps, and the smaller branches with longer twigs correspond to the older and smaller side arrays. The arrays corresponding to smaller branches with yet longer twigs are the oldest and often cannot be seen in the tracks; they were located towards the periphery of the arrays. The Pongo X tree had a ‘star-like’ shape and did not have obvious HORhaps; HORs colored by species indicate almost no mixing between species. Analysis of species-specific consensus sequences (this tree is not shown, as there were just two sequences) showed two consistent differences. Thus, we concluded that the species did not share the same HORhaps, but no significant divides could be seen in the tree due to the short HOR length (a 4-mer). The length of the divide in the tree depends on HOR length; with the same degree of divergence there will be more differences between longer HORs (Table in Fig. S13C). The age of the HORhaps is also confirmed by consensus trees where the oldest GREY twigs branch out closer to the root and are nearly equidistant to the active HOR branches of respective species. Thus, GREY HORs likely resemble the HORs that existed in a common ancestor of both species. Note that only in Pan cenX such sequences have survived in both species. The younger and more derived consensus HORhaps branch out farther from the root. The values of intra-array divergence, which further confirm the age of the HORhaps, are shown in Note S6. Thus, all but the oldest HORhaps are species-specific, and indicate considerable evolution that occurred after the species diverged.
Extended Data Figure 3.
Extended Data Figure 3.. Phylogenetic analysis of the TSPY gene family
Phylogenetic analysis (Methods) of the protein-coding copies of the TSPY gene family in great apes, using siamang as an outgroup, uncovered genus-specific clustering suggesting homogenization among copies. Bootstrap values ≥90% are shown. All but one TSPY protein-coding copies in the Bornean orangutan are located in an array with an average distance of 25.2 kb between individual copies, while one copy (id 25, not clustering with the other orangutan TSPY copies on the tree) is located 126 kb downstream from the last copy in the array. Five truncated copies of the TSPY gene in bonobo were excluded from the analysis. All sequences were aligned using the Clustal Omega algorithm and the tree was constructed using a neighbor-joining method with the Tamura-Nei genetic distance model as implemented in Geneious Prime. Bootstrap resampling was done with 500 replicates. Bootstrap values higher than 90 were kept in the plot.
Extended Data Figure 4.
Extended Data Figure 4.. Methylation patterns
(A) DNA methylation levels in Pseudoautosomal region 1 (PAR1; teal), non-PAR chromosome X (orange), and non-PAR chromosome Y (periwinkle). p-values were determined using the Wilcoxon rank-sum tests. * p<0.05; ** p<10−3; *** p<10−6. (B) Differences in DNA methylation levels between different repeat categories as well as protein-coding genes (after excluding repetitive sequences). (C) Differences in methylation levels between ampliconic and X-ancestral/X-degenerate regions in the X and the Y chromosomes (in 100-kb bins).
Extended Data Figure 5.
Extended Data Figure 5.. T2T assemblies facilitate short-read mapping and enable the analysis of genetic diversity in great apes
(A) The percentage of short reads mapped to T2T vs. previous sex chromosome assemblies (using the previous reference assembly of Sumatran orangutan for Bornean orangutan data). (B) Allele frequencies (y-axis) of variants called from reads mapped to T2T vs. previous assemblies. (C) Coverage and variant density (in log2 values of densities per 10 kb) distribution across previous (shown in the reverse orientation) and T2T assemblies for western chimpanzee. Peak variant densities were observed at 5.9 for previous chrY, and at 7.6 for T2T chrY. (D) Distributions of variant allele frequencies on JADBMG010000033.1 (positions 2 to 618,314, upper), a contig from a previous chrY assembly, and T2T chrY (positions 43,632,350 to 44,250,835, bottom), for western lowland gorilla, visualized using IGV. (E) Nucleotide diversity (pi) in pseudoautosomal regions (PARs), X-ancestral regions of chromosome X, and X-degenerate (X-DEG) regions of chromosome Y. ‘Chimp’ stands for chimpanzee. ‘Nigerian chimp’ stands for Nigeria-Cameroon chimpanzee.
Figure 1.
Figure 1.. Chromosome alignability and divergence
(A) The phylogenetic tree of the studied species (see text for references of divergence times). (B) Pairwise alignments of chromosomes X and Y (% of reference, as shown on the x-axis, covered by the query, as shown on the y-axis). (C) Alignment of the primate sex chromosome against the human T2T assembly,. Blue and yellow blocks indicate the direct or inverted alignments, respectively, between the chromosomes. Pseudoautosomal regions (PARs) are indicated by triangles (not to scale). (D) Phylogenetic trees of nucleotide sequences on the X and Y chromosomes using Progressive Cactus. Branch lengths (substitutions per 100 sites) were estimated from multi-species alignment blocks including all seven species. (E) Substitution spectrum differences between chromosomes X and Y. Comparing the proportions of six single-base nucleotide substitution types among total nucleotide substitutions per branch between the two sex chromosomes (excluding PARs). The distribution of the proportion of each substitution type across phylogenetic branches is shown. The significance of differences was evaluated with a t-test and marked with * for p<0.05 and *** for p<0.0005. ‘B.orang’ and ‘B.orangutan’ stand for Bornean orangutan, and ‘S. orang’ and ‘S. orangutan’ stand for Sumatran orangutan.
Figure 2.
Figure 2.. Sequences gained, palindromes, sequence classes, and intrachromosomal similarity in the assemblies
Tracks for novel sequence relative to existing references (new in black), non-B DNA density (darker is more dense), palindromes (in black), and sequence classes (see color legend) are shown. The X and Y chromosomes are portrayed on different scales. No previous references existed for the Bornean orangutan or siamang, hence the solid black bars for the novel sequence tracks. No new sequence was added to the existing T2T human reference in this study and thus the human novel sequence tracks are empty (white). Self-similarity dot plots are also shown for the Y chromosomes (see percent identity legend). While these dot plots show the intrachromosomal similarity, the divergence between the Y chromosomes is also evident from the variable dot plot patterns. ‘B. orangutan’ and ‘S. orangutan’ stand for Bornean and Sumatran orangutan, respectively.
Figure 3.
Figure 3.. Conservation of ampliconic regions and palindromes across species
(A) A comparison of ampliconic regions on the X chromosomes and (B) Y chromosomes between species with similarities highlighted using a dot plot analysis. Ampliconic regions were extracted and concatenated independently for each species, and visualized with gepard using a window size of 100. (C) Palindromes on the X chromosome: all palindromes are shown, but shared palindromes are connected by edges. An edge in one color from one species always connects to only one other species. Circular genomic coordinates are accompanied by color maps of sequence classes. Genes located in palindromes shared across species are shown. The number of genes following each other in a sequence without being interrupted by other genes is shown in parentheses. (D) The same for the Y chromosomes, with the only difference being that we limited the plot to ampliconic gene families (BPY2, CDY, DAZ, HSFY, PRY, RBMY, TSPY, VCY) located in palindromes.
Figure 4.
Figure 4.. Repeats and centromeres on ape sex chromosomes
(A) Overall repeat annotations (left), lineage-specific repeat expansions (center), and major satellites (right) across each of the ape sex chromosomes. Overall repeat annotations (left) are depicted as a percentage of total nucleotides. Each repeat class is defined by color, with gray representing non-repetitive DNA. Previously uncharacterized human repeats derived from the CHM13 genome analyses are demarcated in teal, adding 0.02% to 2.84% of annotations in each of the non-human apes. Newly defined satellites (Methods), depicted in light orange, account for an average of 344 kb and 91 kb on each ape X and Y chromosome, respectively. The number of bases comprising lineage-specific repeat expansions (middle) are shown in the same colors as the overall repeat annotations, except that non-repetitive DNA (gray) is omitted. The number of bases on each X and Y chromosome comprising canonical satellites are shown, with each satellite represented by a different color according to the included key. Of note, StSat/pCht and SAR/HSat1A satellites have undergone expansion on gorilla, bonobo, and chimpanzee X and Y chromosomes. Alpha satellites, present in all species, form large subterminal expansions in siamang gibbon. (B)The left panel shows the primate phylogenetic tree with active alpha satellite (AS) suprafamilies (SFs) specified. Chromosome-specific organization indicates that the active centromere in each chromosome has a different higher order repeat (HOR). In pan-chromosomal organization, all centromeres have similar repeats. The right panel shows the generalized centromeres for each branch (not to scale) with SF composition of the active core indicated in the middle and of the dead flanking layers on the sides. Each branch has one or few SFs fewer than in African apes, but may have a number of branch-specific layers not shared with the human lineage (shown by hues of the same color). The African ape centromere cores are shown as horizontal bars of SF1-SF3 to represent that each chromosome has only one SF, and the SF differs with each chromosome. (C) The UCSC Genome Browser tracks showing the SF composition of centromere cores (not to scale) and the flanks for cenYs and cenXs. CenX is always surrounded by stable vestigial layers, which represent the remnants of dead ancestral centromeres, while cenY has a ‘naked’ centromere devoid of standard monomeric layers. Thin gray lines under the tracks show overlaps with the segmental duplications tracks, which are abundant among cenY flanks. In gorilla cenX, SF3 (cyan) was replaced by SF2 (purple) and then by SF1 (pink). The colors for all AS SFs, applicable to panels B and C, are listed in the included key. See details in Note S6.
Figure 5.
Figure 5.. Estimation of rDNA copy number and activity on chromosome Y arrays
(A) Gallery view of Y chromosomes from species used in this study. Chromosomes were labeled by FISH with BAC probes containing rDNA (BAC RP11–450E20, green) and SRY (BAC RP11–400O10, red). DNA was counter-stained with DAPI. rDNA signal is present on the distal ends of the q-arms of Y chromosomes in Sumatran orangutan and siamang. (B) Quantification of rDNA copy number on chrY in siamang and Sumatran orangutan. Chromosome spreads were labeled by FISH with probes for rDNA and SRY as in panel A. The rDNA copy number on chrY was calculated from its fraction of the total fluorescent intensity of the rDNA signals on all chromosomes and the Illumina sequencing estimate of the total copy number of rDNA repeats in the genome (339 copies in siamang and 814 copies in Sumatran orangutan). The box plot shows mean values with standard deviations of chrY rDNA from 20 chromosome spreads. The rounded average rDNA arrays on chrY were 16 copies for siamang and 3 copies for Sumatran orangutan. (C) A representative image of siamang chrY labeled by immuno-FISH with rDNA probe (green) and the antibody against rDNA transcription factor UBF (magenta). The chrY rDNA array is positive for the UBF signal. (D) Quantification of siamang chrY rDNA and UBF expressed as the fraction of the total fluorescent intensity of all rDNA-containing chromosomes in a chromosome spread. The box plot shows means with standard deviations from 20 spreads. ChrY rDNA arrays contain on average ~10% of the total chromosomal UBF signal. Siamang (E) and Sumatran orangutan (F) read-level plots showing ONT methylation patterns at the chrY rDNA locus and surrounding regions. The coverage track shows the depth of sequencing coverage across the rDNA array, and the methylation track displays the methylation status of individual cytosines. Only reads >100 kb that are anchored in unique sequence outside the rDNA array and span at least two 45S units are shown. Unmethylated and methylated cytosines are shown in blue and red, respectively.
Figure 6.
Figure 6.. Gene evolution
(A) Density (number of genes per 100 kb, shown on the y-axis) of protein-coding genes along the X and Y chromosomes with respect to sequence classes visualized on the x-axis for each chromosome. X and Y chromosomes are drawn to the same scale. The TSPY copies are shown below the Y chromosomes as black arrows pointing in the direction of DNA strands carrying gene copies, with the total number of copies per strand indicated. (B) Copy number (noted by number and shown by circle size) or absence of ampliconic genes, and presence, pseudogenization, and absence (i.e., deletion) of X-degenerate genes, on the Y chromosome. XKRY was found to be a pseudogene in all species studied and thus is not shown. The RBMY gene family harbored two distinct gene variants, each present in multiple copies, within both orangutan species (Fig. S18). Significant gains and losses in ampliconic gene copy number (Note S8) are shown on the phylogenetic tree. Genes showing signatures of purifying selection (Methods) are underlined.

References

    1. Veyrunes F. et al. Bird-like sex chromosomes of platypus imply recent origin of mammal sex chromosomes. Genome Res. 18, 965–973 (2008). - PMC - PubMed
    1. Bellott D. W. et al. Mammalian Y chromosomes retain widely expressed dosage-sensitive regulators. Nature 508, 494–499 (2014). - PMC - PubMed
    1. Sinclair A. H. et al. A gene from the human sex-determining region encodes a protein with homology to a conserved DNA-binding motif. Nature 346, 240–244 (1990). - PubMed
    1. Betrán E., Demuth J. P. & Williford A. Why Chromosome Palindromes? International Journal of Evolutionary Biology vol. 2012 1–14 Preprint at 10.1155/2012/207958 (2012). - DOI - PMC - PubMed
    1. Lahn B. T. & Page D. C. Four evolutionary strata on the human X chromosome. Science 286, 964–967 (1999). - PubMed

Publication types