. 2023 Nov 1;5(1):vdad142.
doi: 10.1093/noajnl/vdad142. eCollection 2023 Jan-Dec.

Spatial architecture of high-grade glioma reveals tumor heterogeneity within distinct domains

Affiliations

Spatial architecture of high-grade glioma reveals tumor heterogeneity within distinct domains

Joel J D Moffet et al. Neurooncol Adv. .

Abstract

Background: High-grade gliomas (HGGs) are aggressive primary brain cancers with poor response to standard regimens, driven by immense heterogeneity. In isocitrate dehydrogenase (IDH) wild-type HGG (glioblastoma, GBM), increased intratumoral heterogeneity is associated with more aggressive disease.

Methods: Spatial technologies can dissect complex heterogeneity within the tumor ecosystem by preserving cellular organization in situ. We employed GeoMx digital spatial profiling, CosMx spatial molecular imaging, Xenium in situ mapping and Visium spatial gene expression in experimental and validation patient cohorts to interrogate the transcriptional landscape in HGG.

Results: Here, we construct a high-resolution molecular map of heterogeneity in GBM and IDH-mutant patient samples to investigate the cellular communities that compose HGG. We uncovered striking diversity in the tumor landscape and degree of spatial heterogeneity within the cellular composition of the tumors. The immune distribution was diverse between samples, however, consistently correlated spatially with distinct tumor cell phenotypes, validated across tumor cohorts. Reconstructing the tumor architecture revealed two distinct niches, one composed of tumor cells that most closely resemble normal glial cells, associated with microglia, and the other niche populated by monocytes and mesenchymal tumor cells.

Conclusions: This primary study reveals high levels of intratumoral heterogeneity in HGGs, associated with a diverse immune landscape within spatially localized regions.

Keywords: brain cancer; glioma; immune microenvironment; sequencing; spatial transcriptomics.


Conflict of interest statement

S.A.B. received instrument support (GeoMx®) from NanoString Technologies as highlighted in the Acknowledgments section. A.P., D.S., L.Z., and Y.L. are employees and stockholders of NanoString Technologies.

Figures

Graphical Abstract
Graphical Abstract
Figure 1.
Figure 1.
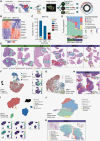
Detecting spatially heterogeneous regions in high-grade glioma. (A) Schematic of GeoMx digital spatial profiling workflow. Briefly, formalin-fixed paraffin-embedded (FFPE) blocks were sectioned and Ivy GAP pathology annotation performed to identify regions of interest. Slides were stained with GFAP, Ki67, and CD45 for segmentation into Tumor (GFAP+), proliferating tumor (GFAP+Ki67+), and immune (CD45+) samples, which were analyzed by whole transcriptome analysis. (B) Heat map of lineage-defining genes in IDH1-mut (n = 21 samples) and IDH1-wt (n = 23 samples) tumors. (C) Classification of IDH1-wt samples (n = 23) by Ivy GAP pathology annotation relative to cell cycling phase. (D) Deconvolution of tumor cell state proportions in tumor (T and K) samples for IDH1-mut (n = 3 patients) and IDH1-wt (n = 3 patients) tumors. (E) H&E of IDH1-mut and IDH1-wt GBM samples with tumor cell state proportions plotted over each region of interest. Scale, 1 mm. (F) UMAP plot depicting 11 269 cells identified in GBM-1 using CosMx separated into tumor, immune, normal glial, and vasculature cell types. Insets show UMAP colored by log expression of marker genes, APO-J, CD163, and COL4A2. (G) UMAP plot depicting 8394 tumor cells reclustered and colored by predicted tumor states based on Couturier. (H) H&E of GBM-1 sample with tumor cell state proportions calculated from single-cell transcriptomics. Scale, 1 mm. (I) UMAP plot depicting 133 548 cells identified in GBM-4 using Xenium separated into tumor, immune, vasculature, normal glial, and neuron cell types. Insets show UMAP colored by log expression of marker genes, PTPRC, PTPRZ1, C1QL3, ERMN, and IGFBP4. (J) UMAP plot depicting 68 609 tumor cells reclustered and colored by predicted tumor states based on Couturier and expression of marker genes. (K) H&E of GBM-4 sample with corresponding tumor cell annotation mapped in position. Scale, 1mm.
Figure. 2.
Figure. 2.
Enhanced spatial heterogeneity in IDH1-wt gliomas. (A) Shannon-entropy analysis of genes driving inter- and intratumoral heterogeneity in IDH1-wt GBM tumor samples (n = 3 patients). (B) PDGFRA gene expression in each GBM sample (n = 3). (C) Immunohistochemistry of PDGFR alpha expression in GBM samples. Scale, 100 µm. (D) GBM-1 spatial distribution of regions 1–3 (left) and associated tumor cell deconvolution and heat map of high-entropy genes in each sample (right). Region 3 (below) Ki67 immunostaining and GFAP+Ki67+ (K) and GFAP+Ki67 (T) tumor cell deconvolution and heat map of high-entropy genes in each sample (right). (E) Expression of PDGFRA and VEGFA in representative GBM samples from Ruiz-Moreno Visium dataset.
Figure 3.
Figure 3.
Dynamic cell states in proliferating tumor cells. (A) Deconvolution of tumor cell states in each IDH1-mut and IDH1-wt sample (T and K), with MKI67 gene expression score for each sample. (B) Deconvolution of GBM-1 (n = 3 paired samples) and GBM-2 (n = 2 paired samples) Ki67 vs Ki67+ sample in cellular tumor annotated regions. Proportions averaged across samples. GBM-3 not included due to no paired Ki67+ samples. (C) UMAP depicting presence of TOP2A expression in GBM-1 (left) and percentage of cells expressing TOP2A in each tumor state across all regions (right). (D) UMAP depicting presence of TOP2A expression in GBM-4 (left) and percentage of cells expressing TOP2A in each tumor state (right).
Figure 4.
Figure 4.
Immune infiltration in glioblastoma. (A) IHC staining of CD45 and CD68 protein expression aligning with regions for transcriptomics. Scale, 100 µm. (B) Average proportion of myeloid and lymphoid immune infiltrate in GBM samples, as determined from deconvolution. (C) H&E of GBM samples with immune proportions mapped spatially. Scale, 1 mm. (i, ii.) Corresponding regions analyzed by single-cell transcriptomics. Average immune proportions, immunofluorescence, and Voronoi plots of each annotated cell in frame. (D) Heat maps of tumor-expressing ligands and immune-expressing receptors with deconvolution of cell states.
Figure 5.
Figure 5.
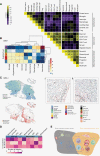
Tumor and immune cell types associate in discrete neighborhoods. (A) Correlation plot of immune cell types, tumor cell states, and location classifications across matched GBM immune samples (n = 15). Correlation value and P value inset in each square. (B) Enrichment heat map of each cell type identified co-localized within the neighborhoods in GBM-1. (C) Location of glial-derived tumor cell states (astrocytic, neuronal, oligodendrocytic, and progenitor; top) compared to mesenchymal cell states (bottom) in GBM-4. Zoom-in Voronoi plots of (i) and (ii) displaying all cell types. (D) Number of Visium samples with significant positive or negative co-localization between tumor and immune cell types. (E) Schematic of tumor and immune architecture in GBM samples highlighting key findings from this study.

References

    1. Louis DN, Perry A, Wesseling P, et al. . The 2021 WHO classification of tumors of the central nervous system: a summary. Neuro-Oncology. 2021;23(8):1231–1251. - PMC - PubMed
    1. Yan H, Parsons DW, Jin G, et al. . IDH1 and IDH2 mutations in gliomas. N Engl J Med. 2009;360(8):765–773. - PMC - PubMed
    1. van den Bent MJ, Brandes AA, Taphoorn MJB, et al. . Adjuvant procarbazine, lomustine, and vincristine chemotherapy in newly diagnosed anaplastic oligodendroglioma: long-term follow-up of EORTC Brain Tumor Group Study 26951. J Clin Oncol. 2013;31(3):344–350. - PubMed
    1. Buckner JC, Shaw EG, Pugh SL, et al. . Radiation plus procarbazine, CCNU, and vincristine in low-grade glioma. N Engl J Med. 2016;374(14):1344–1355. - PMC - PubMed
    1. van den Bent MJ, Tesileanu CMS, Wick W, et al. . Adjuvant and concurrent temozolomide for 1p/19q non-co-deleted anaplastic glioma (CATNON; EORTC study 26053-22054): second interim analysis of a randomised, open-label, phase 3 study. Lancet Oncol. 2021;22(6):813–823. - PMC - PubMed