. 2023 Nov 21:14:1270194.
doi: 10.3389/fimmu.2023.1270194. eCollection 2023.

Integrin-linked kinase expression in myeloid cells promotes colon tumorigenesis

Affiliations

Integrin-linked kinase expression in myeloid cells promotes colon tumorigenesis

Afsar U Ahmed et al. Front Immunol. .

Abstract

Colorectal cancer (CRC) is one of the most common forms of cancer worldwide and treatment options for advanced CRC, which has a low 5-year survival rate, remain limited. Integrin-linked kinase (ILK), a multifunctional, scaffolding, pseudo-kinase regulating many integrin-mediated cellular processes, is highly expressed in many cancers. However, the role of ILK in cancer progression is yet to be fully understood. We have previously uncovered a pro-inflammatory role for myeloid-specific ILK in dextran sodium sulfate (DSS)-induced colitis. To establish a correlation between chronic intestinal inflammation and colorectal cancer (CRC), we investigated the role of myeloid-ILK in mouse models of CRC. When myeloid-ILK deficient mice along with the WT control mice were subjected to colitis-associated and APCmin/+-driven CRC, tumour burden was reduced by myeloid-ILK deficiency in both models. The tumour-promoting phenotype of macrophages, M2 polarization, in vitro was impaired by the ILK deficiency and the number of M2-specific marker CD206-expressing tumour-associated macrophages (TAMs) in vivo were significantly diminished in myeloid-ILK deficient mice. Myeloid-ILK deficient mice showed enhanced tumour infiltration of CD8+ T cells and reduced tumour infiltration of FOXP3+ T cells in colitis-associated and APCmin/+-driven CRC, respectively, with an overall elevated CD8+/FOXP3+ ratio suggesting an anti-tumour immune phenotypes. In patient CRC tissue microarrays we observed elevated ILK+ myeloid (ILK+ CD11b+) cells in tumour sections compared to adjacent normal tissues, suggesting a conserved role for myeloid-ILK in CRC development in both human and animal models. This study identifies myeloid-specific ILK expression as novel driver of CRC, which could be targeted as a potential therapeutic option for advanced disease.

Keywords: Apc min/+; CAC; CD8; CRC; Foxp3; ILK; M2 polarization; myeloid.


Conflict of interest statement

The authors declare that the research was conducted in the absence of any commercial or financial relationships that could be construed as a potential conflict of interest.

Figures

Figure 1
Figure 1
Loss of ILK in myeloid cells reduces colonic tumour formation in AOM/DSS model. (A) A schematic protocol of the AOM/DSS mouse model of CRC used in this study. (B) Representative images of the dissected colon in WT and myeloid-ILK deficient (M-ILK KO) mice following the AOM/DSS model. Arrows indicate polyps. Briefly, 12-week-old mice were subjected to AOM/DSS treatment which is based on a single i.p. injection of a carcinogen (AOM) (12.5 mg/kg) at day 0 followed by 3 cycles of inflammatory agent DSS (2%) treatment in the drinking for 5 days and a subsequent 10-days recovery period without DSS started from day 5 to day 62. All mice were sacrificed at day 62 for post-mortem examination. (C) Numbers of visible polyps in the colon intestine of mice with indicated genotypes are shown. Results are representative of at least three independent experiments and are shown as mean ± SD., n = 12 per group. (D) Colon tumour sizes of mice with the indicated genotypes are shown. Results are representative of at least three independent experiments and are shown as mean ± SD., n = 53 (WT tumours) and n = 29 (M-ILK KO tumours). (E) Representative of H&E-stained sections of colonic tissue with tumours from WT and M-ILK KO mice are shown (scale bars, 200 µm). (F) Blinded histological scoring of colon adenocarcinomas from WT and M-ILK KO mice, n = 23 (WT tumours) and n = 13 (M-ILK KO tumours). *, p < 0.05; **, p < 0.01, Student’s t test.
Figure 2
Figure 2
Myeloid-ILK deletion attenuates colonic tumorigenesis in APCmin/+ model. (A) Representative images of the dissected colon in APCmin/+ and APCmin/+ΔM-ILK mice sacrificed at 16-weeks of age. Arrows indicate polyps. (B) Numbers of visible polyps in the colon intestine of mice with indicated genotypes are shown. Results are representative of at least three independent experiments and are shown as mean ± SD, n = 27 (APCmin/+) and n = 23 (APCmin/+ΔM-ILK). (C) Colon tumour sizes of mice with the indicated genotypes are shown. Results are representative of at least three independent experiments and are shown as mean ± SD, n = 71 (APCmin/+) and n = 28 (APCmin/+ΔM-ILK). (D) Representative of H&E-stained sections of colonic tissue with tumours from WT and M-ILK KO mice are shown (scale bars, 200 µm). (E) Blinded histological scoring of colon adenocarcinomas from WT and M-ILK KO mice, n = 23 (APCmin/+) and n = 15 (APCmin/+ΔM-ILK). **, p < 0.01; ***, p < 0.001, Student’s t test.
Figure 3
Figure 3
Myeloid-ILK deficiency reverses body weight loss, improves survival and reduces splenomegaly in Apcmin/+ mice. (A) Changes in body weight in both APCmin/+ and APCmin/+ΔM-ILK mice are expressed as percentage of body weight at 9 weeks of age. Body weights of randomly selected mice from each genotype were measured weekly from week 9 to week 17, n = 10 per group. Results are representative of at least three independent experiments and are shown as mean ± SD. (B) Both APCmin/+ and APCmin/+ΔM-ILK mice were followed for long-term survival. Survival probability was analyzed using the Kaplan-Meier estimate, and differences were evaluated using the log-rank test, n = 33 (APCmin/+) and n = 31 (APCmin/+ΔM-ILK). (C) Representative images of spleen from APCmin/+ and APCmin/+ΔM-ILK mice sacrificed at 16-weeks of age. (D) Spleen weights (mg) are shown for both APCmin/+ and APCmin/+ΔM-ILK mice sacrificed at 16-weeks of age, n = 27 (APCmin/+) and n = 24 (APCmin/+ΔM-ILK). Results are representative of at least three independent experiments and are shown as mean ± SD. *, p < 0.05; ***, p < 0.001, Student’s t test.
Figure 4
Figure 4
ILK promotes M2 macrophage polarization. q-RT-PCR analyses of M2-specific genes Arg1, Ym1 and FIZZ1 in both peritoneal (A–C) and bone-marrow derived macrophages (BMDM) (D–F) isolated from WT and myeloid-ILK deficient (M-ILK KO) mice are shown. Analyses were carried out under both resting and M2-polarised conditions (refer to Materials and Method section). Results are representative of three independent experiments and are shown as mean ± SD. n = 5 per genotype. *, p < 0.05; Student’s t test.
Figure 5
Figure 5
Myeloid-ILK deficiency is associated with reduced infiltration of CD206+ cells in tumours. (A) Representative immunohistochemistry images of colon tumours showing CD206+ cells of indicated mice subjected to the AOM/DSS model and (B) quantification of CD206+ cells in high-powered fields (HPFs, original magnification x400) across 5 mice per genotype, n = 18 (WT) and n = 18 (M-ILK KO) HPFs. (C) Representative immunohistochemistry images of colon tumours showing CD206+ cells of APCmin/+ and APCmin/+ΔM-ILK mice, and (D) quantification of CD206+ cells in high-powered fields (HPFs) across 5 mice per genotype, n = 21 (APCmin/+) and n = 15 (APCmin/+ΔM-ILK) HPFs. Results are shown as mean ± SD. Scale bars, 100 µm; ***, p < 0.001, Student’s t test.
Figure 6
Figure 6
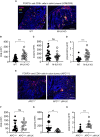
Myeloid-ILK deficiency enhances tumour-infiltration of CD8+ T in AOM/DSS model and reduces tumour-infiltration of FOXP3+ T cells in APCmin/+ model. (A) Representative immunofluorescence images of colon tumours showing infiltration of FOXP3+ and CD8+ T cells in tumours of indicated mice subjected to the AOM/DSS model. Pink, FOXP3+ cells; yellow, CD8+ cells; and blue, DAPI. Quantification of CD8+ T cells (B), FOXP3+ T cells (C), and the ratio of CD8+/FOXP3+ cells (D) in the AOM/DSS-driven colon tumours using the high-powered fields (HPFs, original magnification x400) across 4 mice per genotype, n = 23 (WT) and n = 19 (M-ILK KO) HPFs. (E) Representative immunofluorescence images of colon tumours showing infiltration of FOXP3+ and CD8+ T cells in tumours of APCmin/+ and APCmin/+ΔM-ILK mice. Pink, FOXP3+ cells; yellow, CD8+ cells; and blue, DAPI. (B) Quantification of CD8+ T cells (F), FOXP3+ T cells (G), and the ratio of CD8+/FOXP3+ cells (H) in APCmin/+-driven colon tumours using high-powered fields (HPFs) across 4 mice per genotype, n = 21 (APCmin/+) and n = 13 (APCmin/+ΔM-ILK) HPFs. Results are shown as mean ± SD. Scale bars, 100 µm; **, p < 0.01; ***, p < 0.001, ns, not significant, Student’s t test.
Figure 7
Figure 7
ILK expression is elevated in human CRC epithelial cells and infiltrating CD11b+ cells compared to the adjacent normal tissues. (A) CRC tissue microarray from patients (n=13) consisting of both tumours and their adjacent normal tissues were stained with immunofluorescence to investigate ILK expression (green) and CD11b marker for myeloid cell infiltration (red) in addition to the DAPI nuclear stain (blue). Orange colour in the merged image is an expression of both red CD11b and green ILK. The top panel is a representative microscopic image of adjacent normal tissue and the bottom panel is the tumour tissue showing ILK expression and infiltrating CD11b+ myeloid cells. Single-coloured images within the tumour section corresponding to CD11b+ cells (red) and ILK+ cells (green) show that merged signals (orange) are originated from the combined signals of both CD11b and ILK. Arrows indicate myeloid cells in both CD11b+ and merged images. The scale bar is 20μm. (B-D) Quantifications of epithelial ILK intensity (B), CD11b+ ILK+ cells (C) and CD11b+ ILK- cells (D) in the tumours and their adjacent normal tissues. Results are shown as mean ± SD. Scale bars, 20 µm; **, p < 0.01, ns, not significant, Student’s t test.

Similar articles

Cited by

References

    1. DeSantis CE, Lin CC, Mariotto AB, Siegel RL, Stein KD, Kramer JL, et al. . Cancer treatment and survivorship statistics, 2014. CA Cancer J Clin (2014) 64:252–71. doi: 10.3322/caac.21235 - DOI - PubMed
    1. Jemal A, Center MM, DeSantis C, Ward EM. Global patterns of cancer incidence and mortality rates and trends. Cancer Epidemiol Biomarkers Prev (2010) 19:1893–907. doi: 10.1158/1055-9965.EPI-10-0437 - DOI - PubMed
    1. Labianca R, Merelli B. Screening and diagnosis for colorectal cancer: present and future. Tumori (2010) 96:889–901. doi: 10.1177/548.6506 - DOI - PubMed
    1. Siegel R, Desantis C, Jemal A. Colorectal cancer statistics, 2014. CA Cancer J Clin (2014) 64:104–17. doi: 10.3322/caac.21220 - DOI - PubMed
    1. Zauber AG, Winawer SJ, O'Brien MJ, Lansdorp-Vogelaar I, van Ballegooijen M, Hankey BF, et al. . Colonoscopic polypectomy and long-term prevention of colorectal-cancer deaths. N Engl J Med (2012) 366:687–96. doi: 10.1056/NEJMoa1100370 - DOI - PMC - PubMed

Publication types

Substances