. 2023 Nov 21:14:1250214.
doi: 10.3389/fimmu.2023.1250214. eCollection 2023.

More rapid blood interferon α2 decline in fatal versus surviving COVID-19 patients

Affiliations

More rapid blood interferon α2 decline in fatal versus surviving COVID-19 patients

Candie Joly et al. Front Immunol. .

Abstract

Background: The clinical outcome of COVID-19 pneumonia is highly variable. Few biological predictive factors have been identified. Genetic and immunological studies suggest that type 1 interferons (IFN) are essential to control SARS-CoV-2 infection.

Objective: To study the link between change in blood IFN-α2 level and plasma SARS-Cov2 viral load over time and subsequent death in patients with severe and critical COVID-19.

Methods: One hundred and forty patients from the CORIMUNO-19 cohort hospitalized with severe or critical COVID-19 pneumonia, all requiring oxygen or ventilation, were prospectively studied. Blood IFN-α2 was evaluated using the Single Molecule Array technology. Anti-IFN-α2 auto-Abs were determined with a reporter luciferase activity. Plasma SARS-Cov2 viral load was measured using droplet digital PCR targeting the Nucleocapsid gene of the SARS-CoV-2 positive-strand RNA genome.

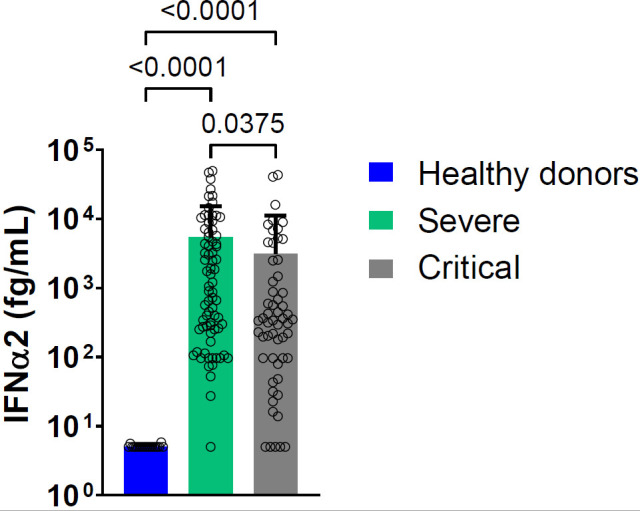
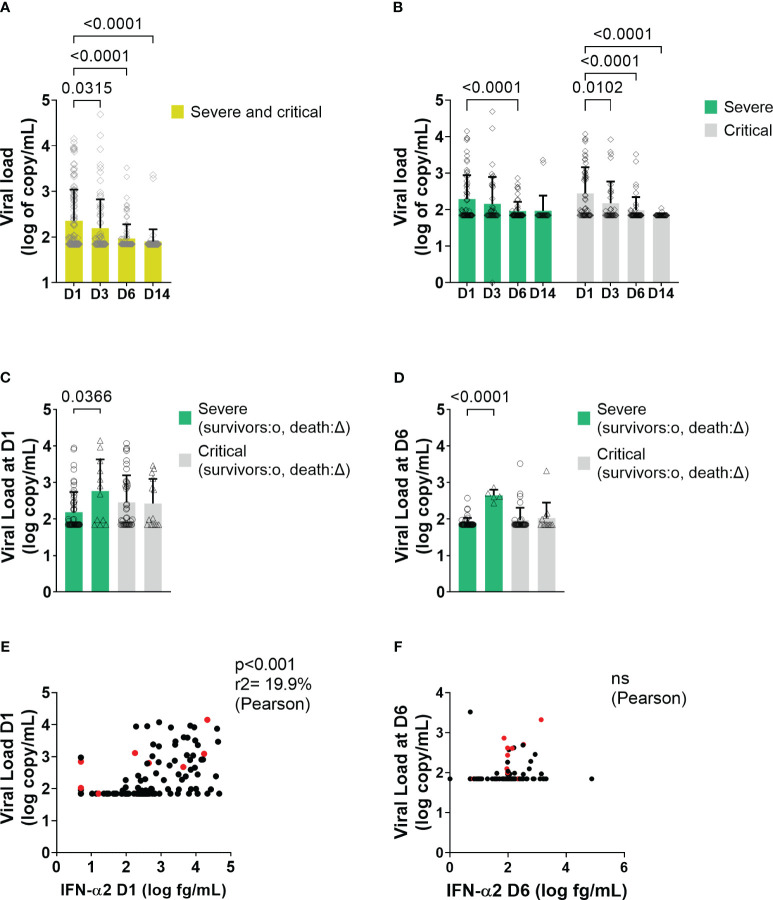
Results: Although the percentage of plasmacytoid dendritic cells was low, the blood IFN-α2 level was higher in patients than in healthy controls and was correlated to SARS-CoV-2 plasma viral load at entry. Neutralizing anti-IFN-α2 auto-antibodies were detected in 5% of patients, associated with a lower baseline level of blood IFN-α2. A longitudinal analysis found that a more rapid decline of blood IFN-α2 was observed in fatal versus surviving patients: mortality HR=3.15 (95% CI 1.14-8.66) in rapid versus slow decliners. Likewise, a high level of plasma SARS-CoV-2 RNA was associated with death risk in patients with severe COVID-19.

Conclusion: These findings could suggest an interest in evaluating type 1 IFN treatment in patients with severe COVID-19 and type 1 IFN decline, eventually combined with anti-inflammatory drugs.

Clinical trial registration: https://clinicaltrials.gov, identifiers NCT04324073, NCT04331808, NCT04341584.

Keywords: COVID-19; SARS-CoV-2; pneumonia; prospective study; type I interferon.


Conflict of interest statement

The authors declare that the research was conducted in the absence of any commercial or financial relationships that could be construed as a potential conflict of interest.

Figures

Figure 1
Figure 1
Mean blood IFN-α2 level at D1 in severe and critical COVID-19 patients and in healthy donors. Bars represent the mean level of IFN-α2 in femtogram per milliliter (fg/mL) for each group: severe patients (green bar, nserum =23, nplasma=52), critical patients (light grey bar nserum =31, nplasma=26), healthy donors (blue bar, n=20). Symbols represent individual measures done at D1. Detection of IFN-α2 in serum and plasma pooled. Statistical analysis was performed using Kruskal Wallis’s test, followed by Dunn’s post-test.
Figure 2
Figure 2
Percentage of DC subsets in COVID-19 patients (n=14) at baseline and in healthy donors (n=7). Red lines correspond to the mean percentages of DC (percentage of leucocytes) in both groups; symbols represent individual values (asterisk for healthy donors and circle for COVID-19 patients) (Kruskal Wallis’s test, followed by Dunn’s post-test). ns = non significant.
Figure 3
Figure 3
Change in blood IFN-α2 over time in severe and critical patients. (A) Results of blood IFN-α2 dosage at D1, D3, D6, and D14. Bars represent the mean level of IFN-α2 in fg/m for each group: severe patients (green bar) and critical patients (light grey bar), and symbols represent individual measures. Blood IFN-α2 waned between D1 and D6 in severe and critical patients (Two-way ANOVA, followed by Sidak’s post-test). (B) Blood IFN-α2 level at D1 and D6 in COVID-19 patients treated with anakinra (n=12), sarilumab (n=49), tocilizumab (n=17), or usual care (n=62). Symbols represent individual measures. Patients were separated into 4 groups according to the treatment: anakinra (purple symbols), sarilumab (orange symbols), tocilizumab (yellow symbols), or usual care (dark blue symbols). The black lines link D1 and D6 IFN-α2 symbols to visualize the evolution between the two time points for each patient. Only patients with available dosage at D1 and D6 are represented (patients dead in between those days or without available serum at D6 are depicted). IFN-α2 levels of patients treated with usual care, anakinra, and tocilizumab waned between D1 and D6 (Two-way ANOVA, followed by Sidak’s post-test).
Figure 4
Figure 4
D6/D1 ratio of IFN-α2 level in severe patients and critical patients. Symbols represent individual measures: severe patients (green symbols, n=64) and critical patients (light grey symbols, n= 45). The lines represent the mean ratios; patients who died are represented with triangles (n=19) and survived patients in circles (n=90). Among the severe patients, those who perished depicted lower ratios IFN-α2 D6/IFN-α2 D1 than those who survived. There was no difference in ratios among critical patients (Kruskal Wallis’s test, followed by Dunn’s post-test). ns = non significant.
Figure 5
Figure 5
Relationship between the slope of IFN-α2 between days 1 and 6 and survival beyond day 6. (A) Observed evolution of IFN-α2 according to whether the individual slopes of variation of IFN-α2 was below (orange, steeper decrease, n=66) or above (green, slower decrease, n=65) the median slope. The slopes were obtained by modeling the log-transformed IFN-α2 values in a Bayesian joint model accounting for limits of quantification and death. (B) Survival beyond day 1 in day 6 survivors (landmark analysis) according to the same groups of individuals. Individuals with a steeper decrease in IFN-α2 (in orange) had a higher risk of death than those with a slower decrease (in green) (hazard ratio [HR] 3.15; 95% confidence interval [CI] 1.14–8.66; p=0.019). (C) Survival beyond day 1 in day 6 survivors for severe patients at baseline. (D) Survival beyond day 1 in day 6 survivors for critical patients at baseline.
Figure 6
Figure 6
Viral load and correlation with IFN-α2 in all patients and in severe and critical patients. (A, B) Mean level of plasma viral load level at different time points in COVID-19 patients. Bars represent the mean level of plasma viral load in log10 of copy/mL of all patients. Symbols represent individual measures. Plasma viral loads waned from D1 to D3, D6, and D14 of the follow-up (One-way ANOVA followed by Dunnett’s post-test comparing all time points to D1). (C, D) Mean level of plasma viral load between survivors and dead in severe and critical patients at D1 and at D6, respectively (Two-way ANOVA followed by Tukey’s post-test). (E, F) Correlation between viral load and blood IFN level at D1 and at D6, respectively. On the X-axis are depicted the IFN-α2 a values in log10 (fg/mL), and on the Y-axis, the viral load values expressed in log10 (copy/mL) (Pearson’s correlation test). Red points correspond to patients who will not survive. ns = non significant.

References

    1. Wu Z, McGoogan JM. Characteristics of and important lessons from the coronavirus disease 2019 (COVID-19) outbreak in China: summary of a report of 72 314 cases from the Chinese center for disease control and prevention. Jama (2020) 323(13):1239–42. doi: 10.1001/jama.2020.2648 - DOI - PubMed
    1. Huang C, Wang Y, Li X, Ren L, Zhao J, Hu Y, et al. Clinical features of patients infected with 2019 novel coronavirus in Wuhan, China. Lancet (2020) 395(10223):497–506. doi: 10.1016/S0140-6736(20)30183-5 - DOI - PMC - PubMed
    1. Guan WJ, Ni ZY, Hu Y, Liang WH, Ou CQ, He JX, et al. Clinical characteristics of coronavirus disease 2019 in China. N Engl J Med (2020) 382(18):1708–20. doi: 10.1056/NEJMoa2002032 - DOI - PMC - PubMed
    1. Verity R, Okell LC, Dorigatti I, Winskill P, Whittaker C, Imai N, et al. Estimates of the severity of coronavirus disease 2019: a model-based analysis. Lancet Infect Dis (2020) 20(6):669–77. doi: 10.1016/S1473-3099(20)30243-7 - DOI - PMC - PubMed
    1. Del Sole F, Farcomeni A, Loffredo L, Carnevale R, Menichelli D, Vicario T, et al. Features of severe COVID-19: A systematic review and meta-analysis. Eur J Clin Invest (2020) 50(10):e13378. doi: 10.1111/eci.13378 - DOI - PMC - PubMed

Publication types

Associated data