. 2023 Nov 20;2(12):pgad402.
doi: 10.1093/pnasnexus/pgad402. eCollection 2023 Dec.

Fibril structures of TFG protein mutants validate the identification of TFG as a disease-related amyloid protein by the IMPAcT method

Affiliations

Fibril structures of TFG protein mutants validate the identification of TFG as a disease-related amyloid protein by the IMPAcT method

Gregory M Rosenberg et al. PNAS Nexus. .

Abstract

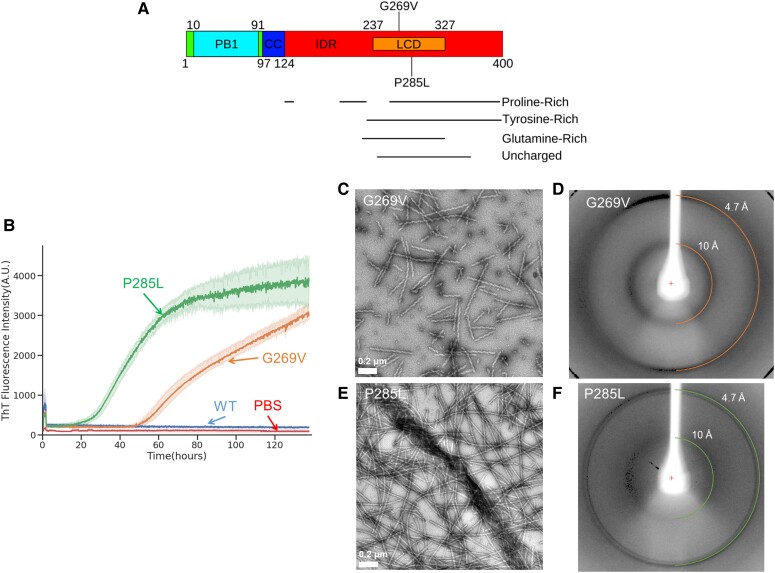
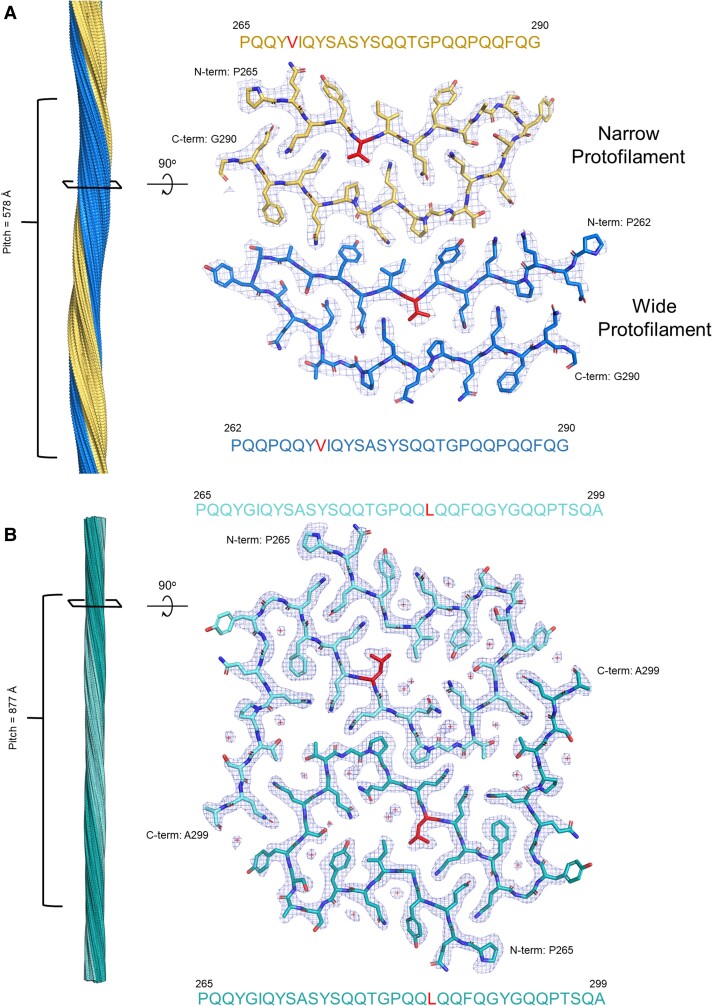
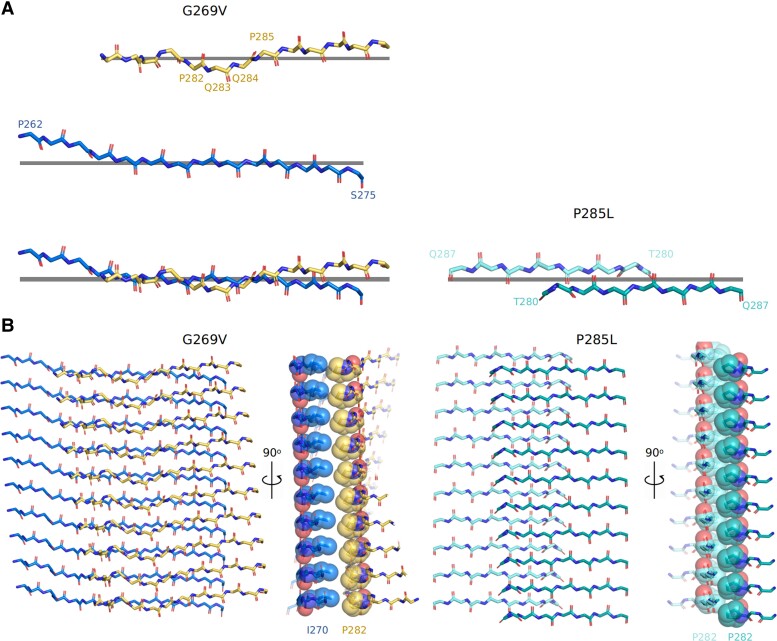
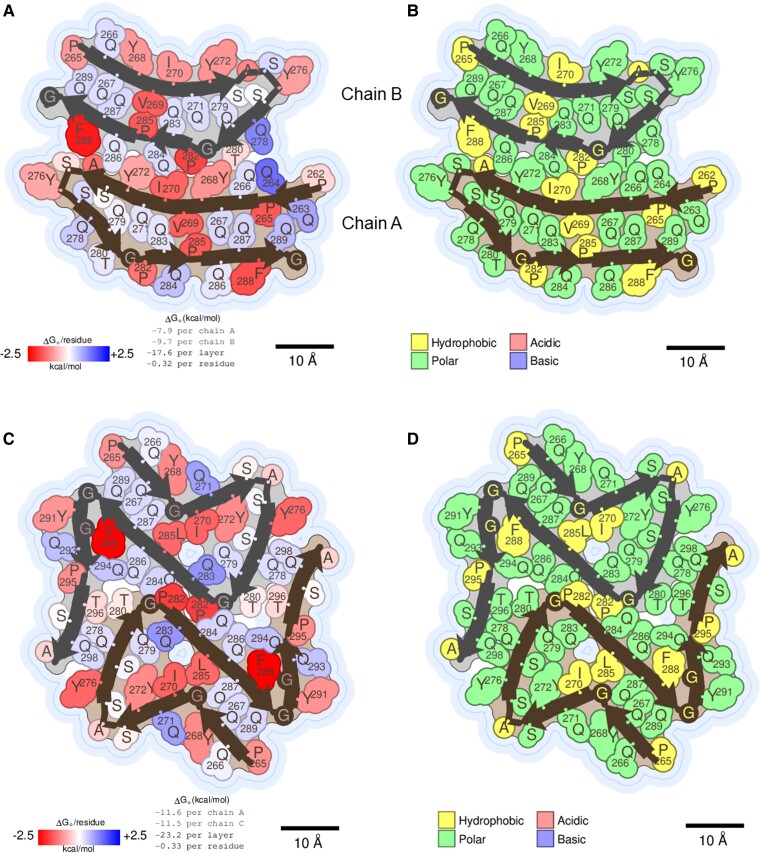
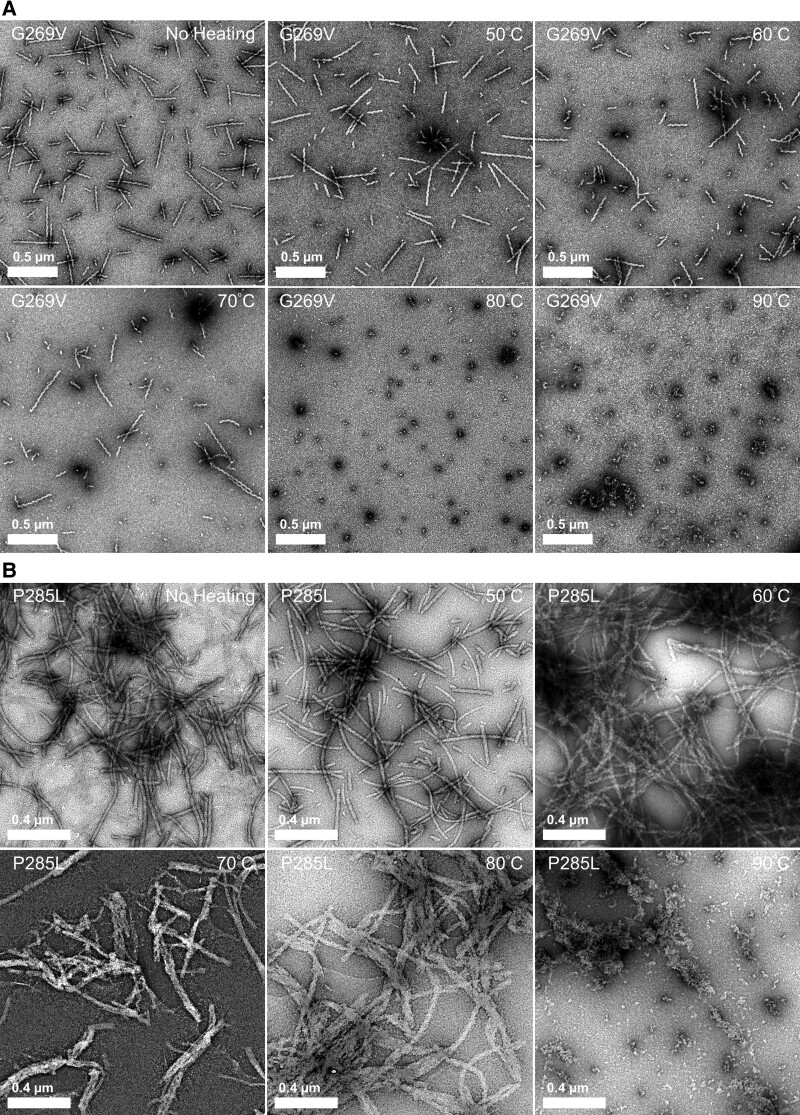
We previously presented a bioinformatic method for identifying diseases that arise from a mutation in a protein's low-complexity domain that drives the protein into pathogenic amyloid fibrils. One protein so identified was the tropomyosin-receptor kinase-fused gene protein (TRK-fused gene protein or TFG). Mutations in TFG are associated with degenerative neurological conditions. Here, we present experimental evidence that confirms our prediction that these conditions are amyloid-related. We find that the low-complexity domain of TFG containing the disease-related mutations G269V or P285L forms amyloid fibrils, and we determine their structures using cryo-electron microscopy (cryo-EM). These structures are unmistakably amyloid in nature and confirm the propensity of the mutant TFG low-complexity domain to form amyloid fibrils. Also, despite resulting from a pathogenic mutation, the fibril structures bear some similarities to other amyloid structures that are thought to be nonpathogenic and even functional, but there are other factors that support these structures' relevance to disease, including an increased propensity to form amyloid compared with the wild-type sequence, structure-stabilizing influence from the mutant residues themselves, and double-protofilament amyloid cores. Our findings elucidate two potentially disease-relevant structures of a previously unknown amyloid and also show how the structural features of pathogenic amyloid fibrils may not conform to the features commonly associated with pathogenicity.

Keywords: Charcot–Marie–Tooth disease; amyloid; cryo-electron microscopy; hereditary motor and sensory neuropathy with proximal dominant involvement; mutation.


Figures

Fig. 1.
Fig. 1.
The TFG LCD forms amyloid fibrils. A) Domain structure of the full-length TFG protein. The protein contains an ordered PB1 domain and coiled-coil motif (residues 10–91 and 97–124, respectively), and the rest of the protein is intrinsically disordered. An LCD was identified using SEG (4) (residues 237–327), which was the portion of the protein that was conjugated to mCherry and expressed and purified. Amyloid-promoting mutations G269V and P285L are also labeled. The ordered fibril cores of both mutant fibrils encompass both of these mutation locations. Regions of the protein especially enriched for certain amino acids are also indicated. B) Time-dependent ThT fluorescence for the WT TFG LCD sequence conjugated to a molecule of mCherry (mC-TFG-LCD, labeled “WT”), the TFG LCD with the G269V mutation conjugated to a molecule of mCherry (mC-TFG-LCD-G269V, labeled “G269V”), the TFG LCD with the P285L mutation conjugated to a molecule of mCherry (mC-TFG-LCD-P285L, labeled “P285L”), and PBS buffer (labeled “PBS”). All constructs are at 50 μM concentration in PBS with ThT at 40 μM concentration. The mC-TFG-LCD-G269V construct and the PBS blank have n = 3 technical replicates and the mC-TFG-LCD and mC-TFG-LCD-P285L constructs have n = 6 technical replicates. The y-axis values represent the mean ThT fluorescence value of all replicates for each construct. C and E) Electron micrograph of the mC-TFG-LCD-G269V sample (C) and the mC-TFG-LCD-P285L sample (E) at the endpoint of the ThT assay. The mC-TFG-LCD construct did not form fibrils. D and F) X-ray fiber diffraction of mC-TFG-LCD-G269V fibrils (D) and mC-TFG-LCD-P285L fibrils (F). Rings are present at 4.7 and 10 Å spacing with distinct wedges, indicative of a cross-β structure.
Fig. 2.
Fig. 2.
Cryo-EM structures of the mC-TFG-LCD-G269V and mC-TFG-LCD-P285L amyloid fibril cores. A) Left: mC-TFG-LCD-G269V fibril reconstruction showing a left-handed twist and the pitch. Right: Density map and atomic model of one layer of the fibril viewed down the fibril axis. The G269V mutation is red. The sequence context is 265PQQYVIQYS273. The protofilament with three extra residues resolved (P262–Q264) is referred to as the “wide” protofilament and the other protofilament, starting at residue 265, is accordingly referred to as the “narrow” protofilament. B) Left: mC-TFG-LCD-P285L fibril reconstruction showing a left-handed twist and the pitch. Right: Density map and atomic model of one layer of the fibril viewed down the fibril axis. The P285L mutation is red. The sequence context is 281GPQQLQQFQ289. The plus symbols in the density represent modeled water molecules.
Fig. 3.
Fig. 3.
Protofilament interfaces of mC-TFG-LCD-G269V and mC-TFG-LCD-P285L fibrils. A) Top: The peptide backbone of the narrow protofilament of the mC-TFG-LCD-G269V fibril that constitutes the protofilament interface (residues 278–290) viewed orthogonal to the fibril axis with a line representing the plane perpendicular to the fibril axis. Residues P282–P285 are labeled to highlight the backbone warp that they constitute. Middle: The peptide backbone of the wide protofilament of the mC-TFG-LCD-G269V fibril that constitutes the protofilament interface (residues 262–275) viewed orthogonal to the fibril axis with a line representing the plane perpendicular to the fibril axis. Bottom left: The peptide backbones of the aforementioned segments of the narrow and wide protofilaments overlaid relative to each other as they exist in the mC-TFG-LCD-G269V fibril structure with a line representing the plane perpendicular to the fibril axis. The peptide backbones of each protofilament are only in plane with each other at a few spots, and notably not at the center of the interface due to the backbone warp of the narrow protofilament at residues 282–285. Bottom right: The peptide backbones of T280–Q287 of both protofilaments of the mC-TFG-LCD-P285L fibril overlaid relative to each other as they exist in the mC-TFG-LCD-P285L fibril structure with a line representing the plane perpendicular to the fibril axis. These protofilaments are offset from each other due to the pseudo 21 screw axis of symmetry of the protofilaments. B) Left: multiple layers of the mC-TFG-LCD-G269V fibril, showing how the protofilaments are not offset from each other in terms of overall symmetry despite the backbone warp. Van der Waals spheres are shown for residues I270 of the wide protofilament and P282 of the narrow protofilament. Right: multiple layers of the mC-TFG-LCD-P285L fibril showing the offset of each layer due to the pseudo 21 screw axis of symmetry. Van der Waals spheres are shown for residue P282 in both protofilaments.
Fig. 4.
Fig. 4.
Solvation energy maps and polarity maps of the mutant TFG LCD amyloid fibrils. A and C) Solvation energy map of the mC-TFG-LCD-G269V amyloid fibril (A) and mC-TFG-LCD-P285L amyloid fibril (C). Residues are colored according to their stabilization energies. Deeper blue (positive) is unfavorable for amyloid assembly and deeper red (negative) is favorable. The thin dark blue line represents the solvent-accessible surface. Energy values are listed below the structure illustration. For the mC-TFG-LCD-G269V fibril, chain A is the wide protofilament and chain B is the narrow protofilament in the illustration. B and D) Polarity map of the mC-TFG-LCD-G269V amyloid fibril (B) and mC-TFG-LCD-P285L amyloid fibril (D). Residues are colored according to whether they are polar, hydrophobic, acidic, or basic. The thin dark blue line represents the solvent-accessible surface.
Fig. 5.
Fig. 5.
Heat stability of mutant TFG LCD amyloid fibers. Amyloid fibers formed at 50 μm monomer concentration at 37°C were diluted 1:5 in PBS and distributed into 10 μL aliquots. Each aliquot was heated to the specified temperature (40 to 100°C in intervals of 10°C) for 10 min each and then each sample was prepared for negative stain EM. A) Representative images of mC-TFG-LCD-G269V fibrils heated to 50 to 90°C. Fibrils remain clearly visible in all samples heated below 80°C but are completely absent in samples heated to 80°C and above. B) Representative images of mC-TFG-LCD-P285L fibrils heated to 50 to 90°C. Fibrils remain clearly visible in all samples heated below 90°C but are completely absent in samples heated to 90°C and above.

Similar articles

References

    1. Rosenberg GM, et al. 2022. Bioinformatic identification of previously unrecognized amyloidogenic proteins. J Biol Chem. 298:101920. - PMC - PubMed
    1. Johnson A, et al. 2015. TFG clusters COPII-coated transport carriers and promotes early secretory pathway organization. EMBO J. 34:811–827. - PMC - PubMed
    1. Hanna MG, et al. 2017. TFG facilitates outer coat disassembly on COPII transport carriers to promote tethering and fusion with ER-Golgi intermediate compartments. Proc Natl Acad Sci U S A. 114:E7707–E7716. - PMC - PubMed
    1. Wootton JC, Federhen S. 1993. Statistics of local complexity in amino acid sequences and sequence databases. Comput Chem. 17:149–163.
    1. Tsai P-C, et al. 2014. A novel TFG mutation causes Charcot-Marie-Tooth disease type 2 and impairs TFG function. Neurology. 83:903–912. - PubMed