. 2024 Feb 27;120(1):69-81.
doi: 10.1093/cvr/cvad182.

Dysregulated iron homeostasis in dystrophin-deficient cardiomyocytes: correction by gene editing and pharmacological treatment

Affiliations

Dysregulated iron homeostasis in dystrophin-deficient cardiomyocytes: correction by gene editing and pharmacological treatment

Kalina Andrysiak et al. Cardiovasc Res. .

Abstract

Aims: Duchenne muscular dystrophy (DMD)-associated cardiomyopathy is a serious life-threatening complication, the mechanisms of which have not been fully established, and therefore no effective treatment is currently available. The purpose of the study was to identify new molecular signatures of the cardiomyopathy development in DMD.

Methods and results: For modelling of DMD-associated cardiomyopathy, we prepared three pairs of isogenic control and dystrophin-deficient human induced pluripotent stem cell (hiPSC) lines. Two isogenic hiPSC lines were obtained by CRISPR/Cas9-mediated deletion of DMD exon 50 in unaffected cells generated from healthy donor and then differentiated into cardiomyocytes (hiPSC-CM). The latter were subjected to global transcriptomic and proteomic analyses followed by more in-depth investigation of selected pathway and pharmacological modulation of observed defects. Proteomic analysis indicated a decrease in the level of mitoNEET protein in dystrophin-deficient hiPSC-CM, suggesting alteration in iron metabolism. Further experiments demonstrated increased labile iron pool both in the cytoplasm and mitochondria, a decrease in ferroportin level and an increase in both ferritin and transferrin receptor in DMD hiPSC-CM. Importantly, CRISPR/Cas9-mediated correction of the mutation in the patient-derived hiPSC reversed the observed changes in iron metabolism and restored normal iron levels in cardiomyocytes. Moreover, treatment of DMD hiPSC-CM with deferoxamine (DFO, iron chelator) or pioglitazone (mitoNEET stabilizing compound) decreased the level of reactive oxygen species in DMD hiPSC-CM.

Conclusion: To our knowledge, this study demonstrated for the first time impaired iron metabolism in human DMD cardiomyocytes, and potential reversal of this effect by correction of DMD mutation or pharmacological treatment. This implies that iron overload-regulating compounds may serve as novel therapeutic agents in DMD-associated cardiomyopathy.

Keywords: CISD1; CRISPR/Cas9; Cardiomyocytes; Cardiomyopathy; DMD; Deferoxamine; Duchenne muscular dystrophy; Induced pluripotent stem cells; Iron overload; MitoNEET; Pioglitazone; hiPSC-CM.


Conflict of interest statement

Conflict of interest: None declared. This manuscript was handled by Deputy Editor Pasquale Maffia.

Figures

Graphical Abstract
Graphical Abstract
Figure 1
Figure 1
Scheme of CRISPR/Cas9-mediated introduction or correction of the DMD mutation in hiPSC. (A) An example of non-homologous end joining (NHEJ)-mediated introduction of an exon 50 deletion in the DMD gene in the control hiPSC (DMB01 and DMB02) and (B) Homology-directed repair (HDR) double strand breaks (DSB) repair mechanism of deletion of exons 48–50 in DMD patient-derived hiPSC (DMB03) used in this study. PTC, premature termination codon. Created with BioRender.com.
Figure 2
Figure 2
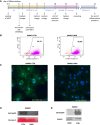
Differentiation of hiPSC to cardiomyocytes and confirmation of CRISPR/Cas9-mediated introduction and repair of the mutation in the DMD gene at the protein level. (A) Scheme of cardiac differentiation based on Wnt/β-catenin pathway modulation; (B) representative dot plots of flow cytometric analysis of cardiac differentiation efficiency in DMB01 cells calculated as percentage of troponin T-positive cells (shown as events collected in P4 gate); (C) representative pictures of DMB01-CTRL and DMB01-DMD hiPSC-CM stained for dystrophin, scale bars represent 50 µm; (D) western blot analysis of dystrophin in control and DMD DMB02 hiPSC-CM shown as representative pictures (n = 2, separate differentiation runs); (E) western blot analysis of dystrophin in DMD and corrected (CTRL) hiPSC-CM shown as representative pictures (n = 2, separate differentiation runs).
Figure 3
Figure 3
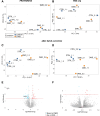
Transcriptomic and proteomic effect of DMD vs. control hiPSC-CM. The principal component analysis (PCA) of the (A) proteomic and (B) transcriptomic samples, based on log2-counts and vst-normalized counts respectively, shows that samples group together based on donor and batch. After correcting the donor and batch effects with ComBat for the proteome, and sva-seq and limma for the transcriptome, the PCA shows that (C) proteomic and (D) transcriptomic samples group based on the presence or lack of mutation in DMD. For the (E) proteomics data, proteins with a log2foldchange > 0.5 and P < 0.5 are coloured, and for the (F) transcriptomics data, genes with adjusted P < 0.05 are coloured. Genes and proteins upregulated (UP) and downregulated (DOWN) in DMD cells are marked according to the legend below.
Figure 4
Figure 4
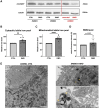
Disturbances in iron homeostasis, oxidative stress, and mitochondrial ultrastructure in DMD hiPSC-CM. (A) Result of western blot assessing the level of mitoNEET protein, protein that was decreased by DMD exon 50 deletion (DMB01 and DMB02) and restored by DMD gene correction in DMD patient-derived hiPSC-CM, N = 3, n = 3; (B) level of cytosolic labile iron pool, N = 3, n = 3; (C) level of mitochondrial labile iron pool, N = 3, n = 3–4; (D) level of ROS production, N = 3, n = 2–4; (E) ultrastructure images of the control and DMD DMB01 hiPSC-CM analysed by TEM demonstrating degenerated mitochondria (asterisks) and autophagosomes (arrows) in DMD hiPSC-CM. Scale bars represent 1 µm. Western blot result presented as a representative picture. Flow cytometric analysis results presented as inverted percentage of fluorescence intensity median values normalized to control = 100% (data from DMB01, DMB02, and DMB03 pooled together), **P < 0.01, ****P < 0.001, unpaired two-tailed Student’s t-test. LIP, labile iron pool; ROS, reactive oxygen species.
Figure 5
Figure 5
Western blot analysis of the proteins involved in the regulation of iron homeostasis. (A) Transferrin receptor protein level; (B) ferroportin protein level; (C) ferritin protein level; (D) nuclear erythroid 2-related factor 2 (NRF2); (E) NAD(P)H dehydrogenase [quinone] 1 (NQO1), and (F) heme oxygenase-1 (HO-1). Western blot results presented as representative pictures, N = 3, n = 2–3.
Figure 6
Figure 6
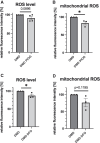
Analysis of oxidative stress in DMD hiPSC-CM by determination of (A) ROS and (B) mitochondrial ROS production level after 24 h stimulation with 10 µM pioglitazone (PIOG) and (C) ROS and (D) mitochondrial ROS production level after 2 h stimulation with 20 µM deferoxamine (DFO) using FACS. Results are presented as median (ROS) and mean (mitochondrial ROS) fluorescence intensity values normalized to DMD = 100%, *P < 0.05, N = 3, unpaired two-tailed Student’s t-test.
Figure 7
Figure 7
MEA analysis of the electrophysiological properties of control (CTRL) and DMD hiPSC-CM. (A) FPD values in basal conditions; (B) FPD fold change normalized to the values obtained in basal conditions in control and DMD hiPSC-CM stimulated with 20 µM deferoxamine (DFO)—24, 48, and 72 h after stimulation; $$  P < 0.01, $$$$  P < 0.0001, basal vs. 48 and 72 h; (C) FPD values in hiPSC-CM 72 h after stimulation with 20 µM DFO, unstimulated cells from the same time point served as a control; $$  P < 0.01, $$$$  P < 0.0001, control vs. DFO; (D) FPD fold change normalized to the values obtained in basal conditions in control and DMD hiPSC-CM stimulated with 10 µM pioglitazone (PIOG)—24, 48, and 72 h after stimulation; $  P < 0.05, $$$  P < 0.005, $$$$  P < 0.0001, basal vs. 48 and 72 h (E) FPD values in hiPSC-CM 72 h after stimulation with 10 µM PIOG, unstimulated cells from the same time point served as a control; $$  P < 0.01, DMSO vs. PIOG. In all graphs: *P < 0.05, **P < 0.01, ****P < 0.0001, CTRL vs. DMD hiPSC-CM; N = 2, n = 1–2, two-way ANOVA with Tukey’s correction for multiple comparison. Data are presented as the distribution of signals measured from all active electrodes.

References

    1. Petrof BJ, Shrager JB, Stedman HH, Kelly AM, Sweeney HL. Dystrophin protects the sarcolemma from stresses developed during muscle contraction. Proc Natl Acad Sci USA 1993;90:3710–3714. - PMC - PubMed
    1. Schulz T, Raucci Jr F, Salloum F. Cardiovascular disease in Duchenne muscular dystrophy: overview and insight into novel therapeutic targets. JACC Basic Transl Sci 2022;7:608–625. - PMC - PubMed
    1. Ishikawa Y, Miura T, Ishikawa Y, Aoyagi T, Ogata H, Hamada S, Minami R. Duchenne muscular dystrophy: survival by cardio-respiratory interventions. Neuromuscul Disord 2011;21:47–51. - PubMed
    1. Yoo WH, Cho MJ, Chun P, Kim KH, Lee JS, Shin YB. The evolution of electrocardiographic changes in patients with Duchenne muscular dystrophies. Korean J Pediatr 2017;60:196–201. - PMC - PubMed
    1. Mittler R, Darash-Yahana M, Sohn YS, Bai F, Song L, Cabantchik IZ, Jennings PA, Onuchic JN, Nechushtai R. NEET proteins: a new link between iron metabolism, reactive oxygen species, and cancer. Antioxid Redox Signal 2019;30:1083–1095. - PMC - PubMed

Publication types