Meta-Analysis
. 2023 Dec;131(12):127010.
doi: 10.1289/EHP12146. Epub 2023 Dec 11.

Short-Term Exposure to Ambient Air Pollution and Influenza: A Multicity Study in China

Affiliations
Meta-Analysis

Short-Term Exposure to Ambient Air Pollution and Influenza: A Multicity Study in China

Lin-Jie Yu et al. Environ Health Perspect. 2023 Dec.

Abstract

Background: Air pollution is a major risk factor for planetary health and has long been suspected of predisposing humans to respiratory diseases induced by pathogens like influenza viruses. However, epidemiological evidence remains elusive due to lack of longitudinal data from large cohorts.

Objective: Our aim is to quantify the short-term association of influenza incidence with exposure to ambient air pollutants in Chinese cities.

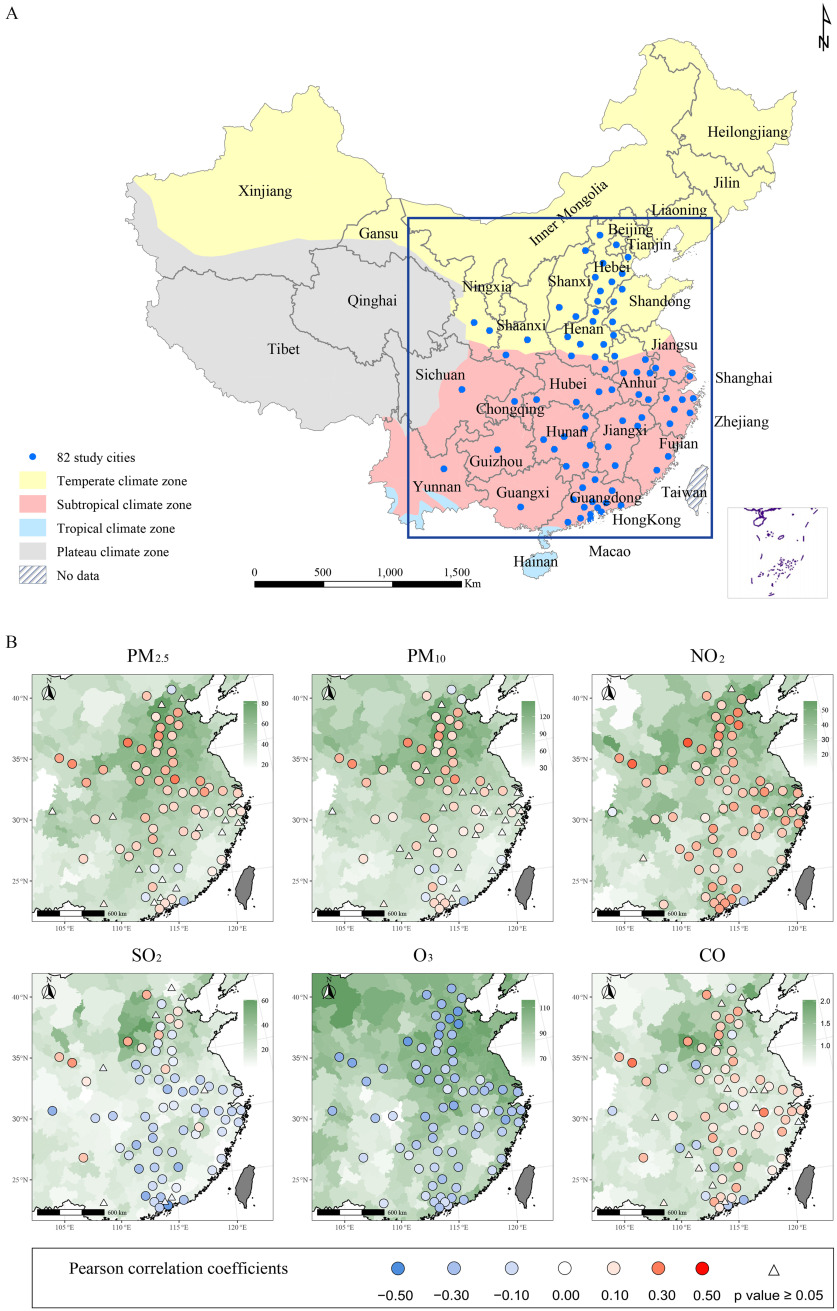
Methods: Based on air pollutant data and influenza surveillance data from 82 cities in China over a period of 5 years, we applied a two-stage time series analysis to assess the association of daily incidence of reported influenza cases with six common air pollutants [particulate matter with aerodynamic diameter 2.5μm (PM2.5), particulate matter with aerodynamic diameter 10μm (PM10), NO2, SO2, CO, and O3], while adjusting for potential confounders including temperature, relative humidity, seasonality, and holiday effects. We built a distributed lag Poisson model for one or multiple pollutants in each individual city in the first stage and conducted a meta-analysis to pool city-specific estimates in the second stage.

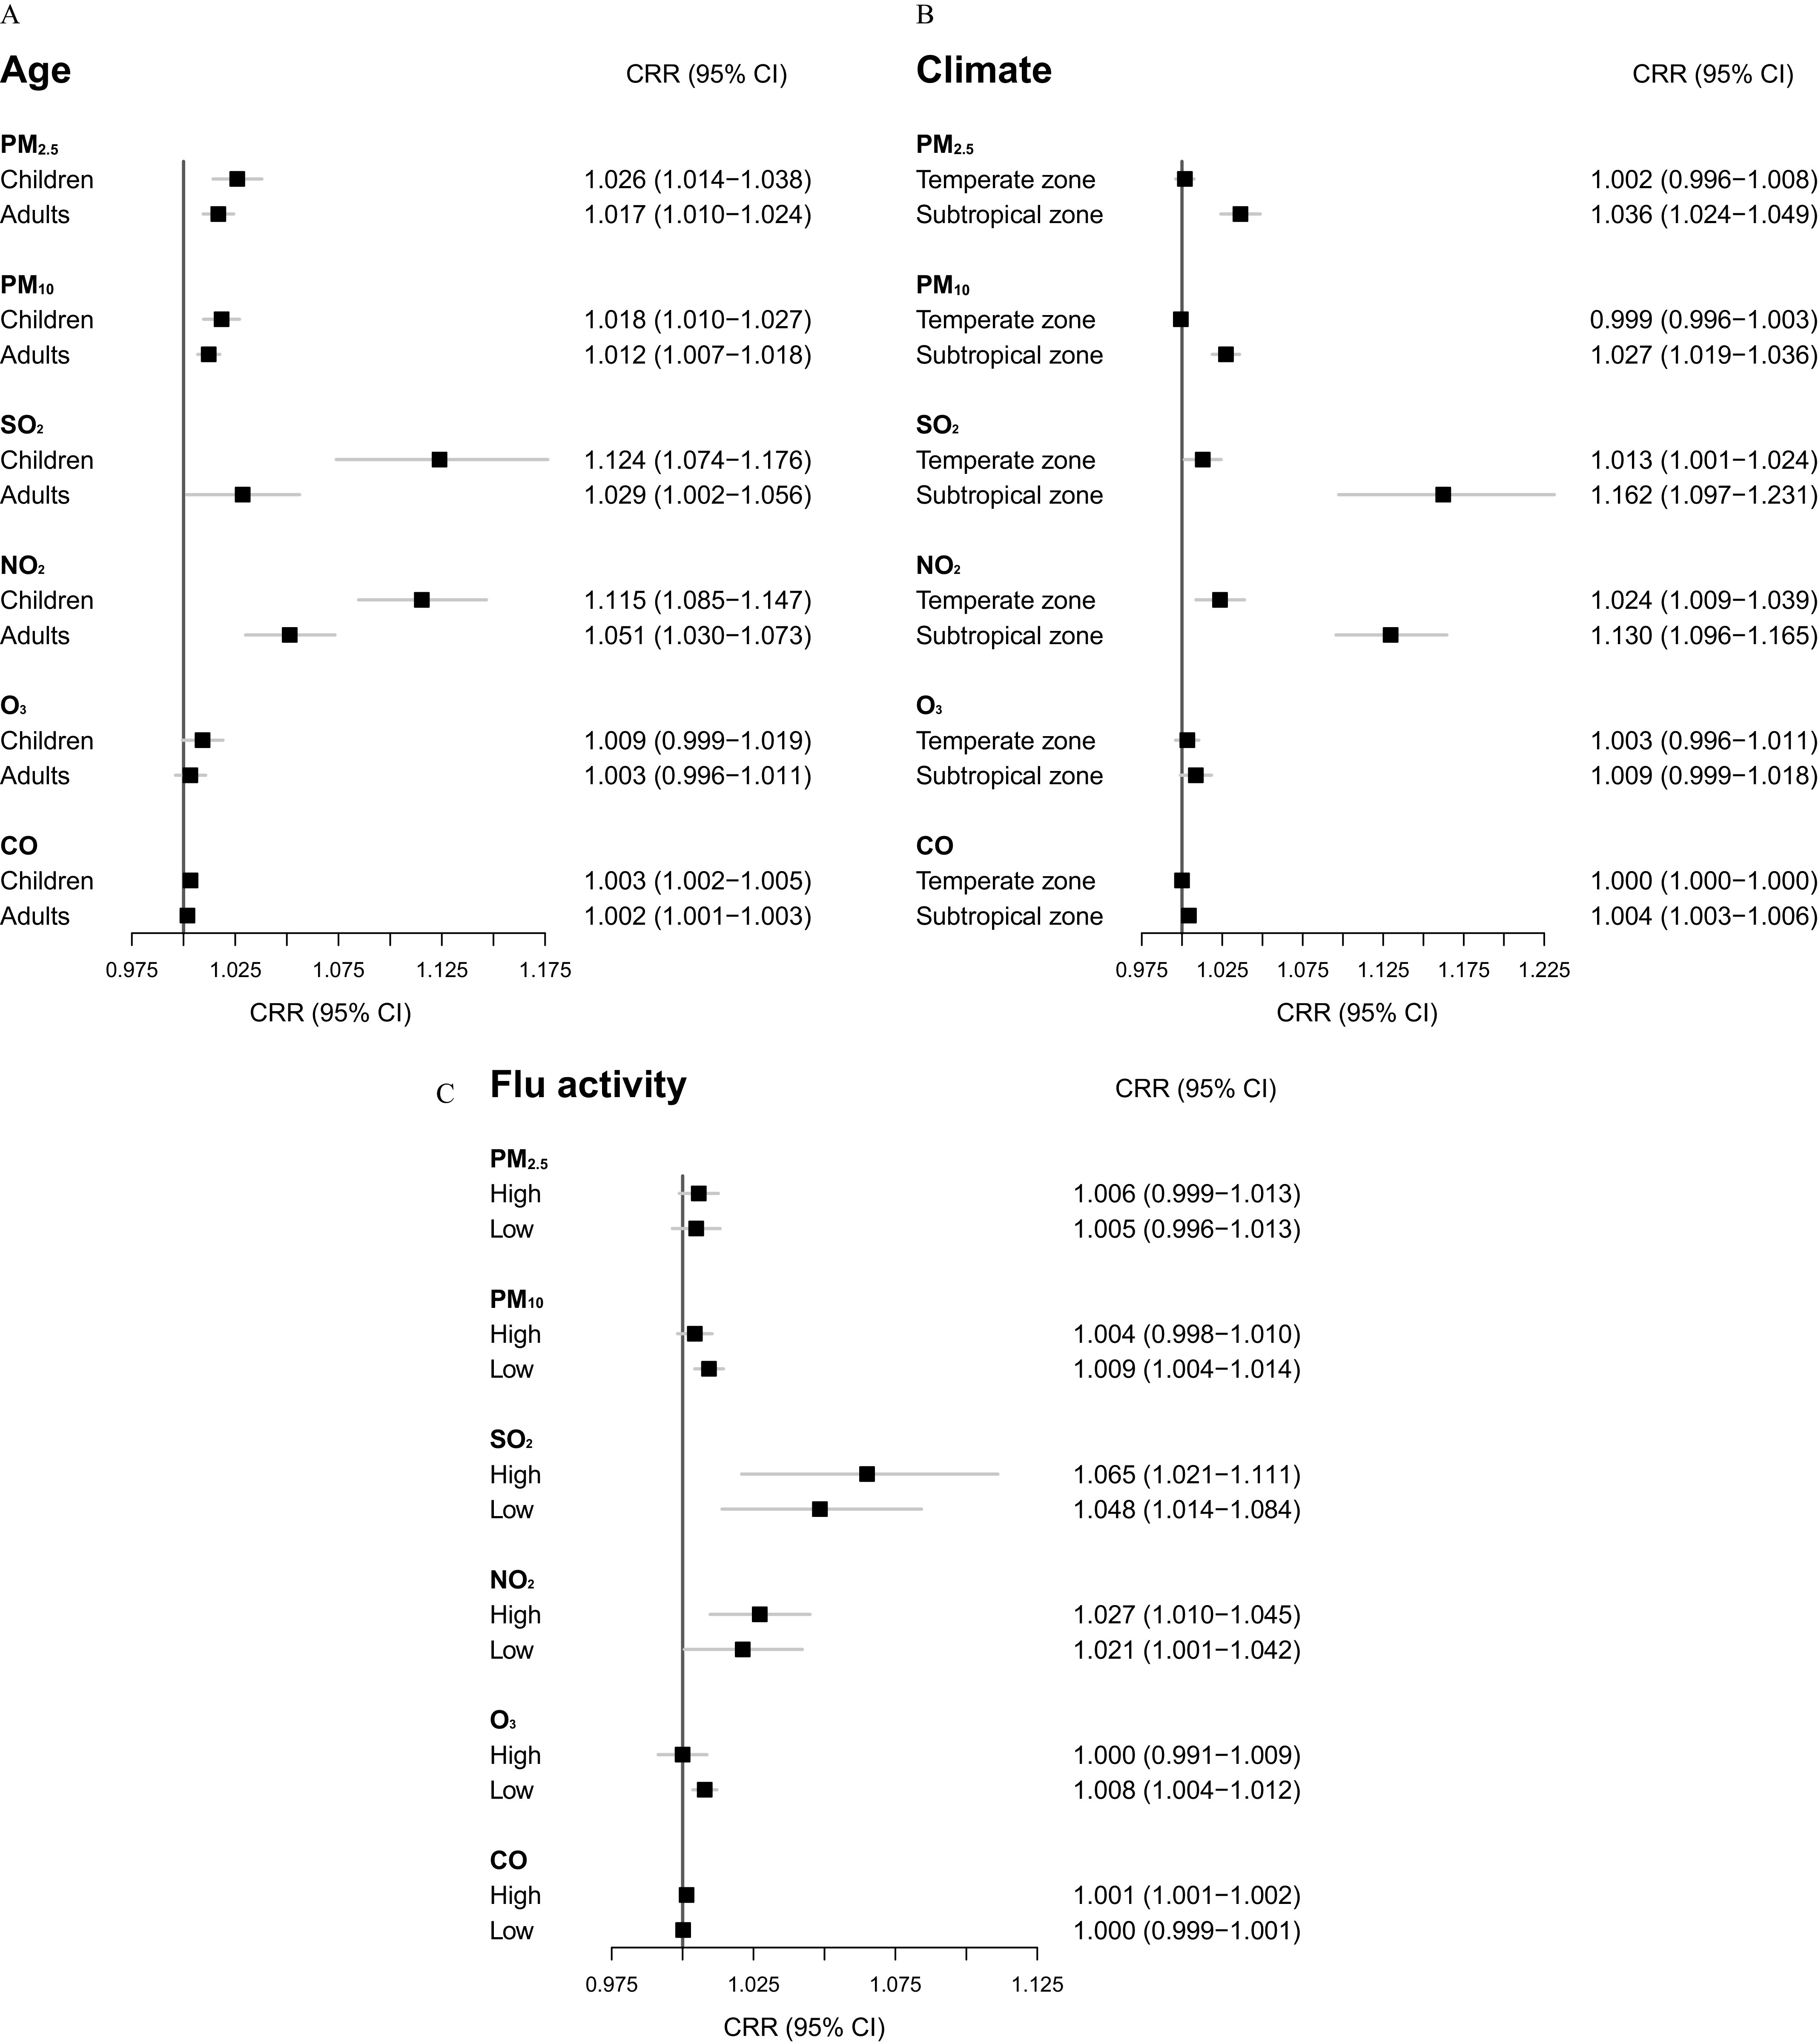
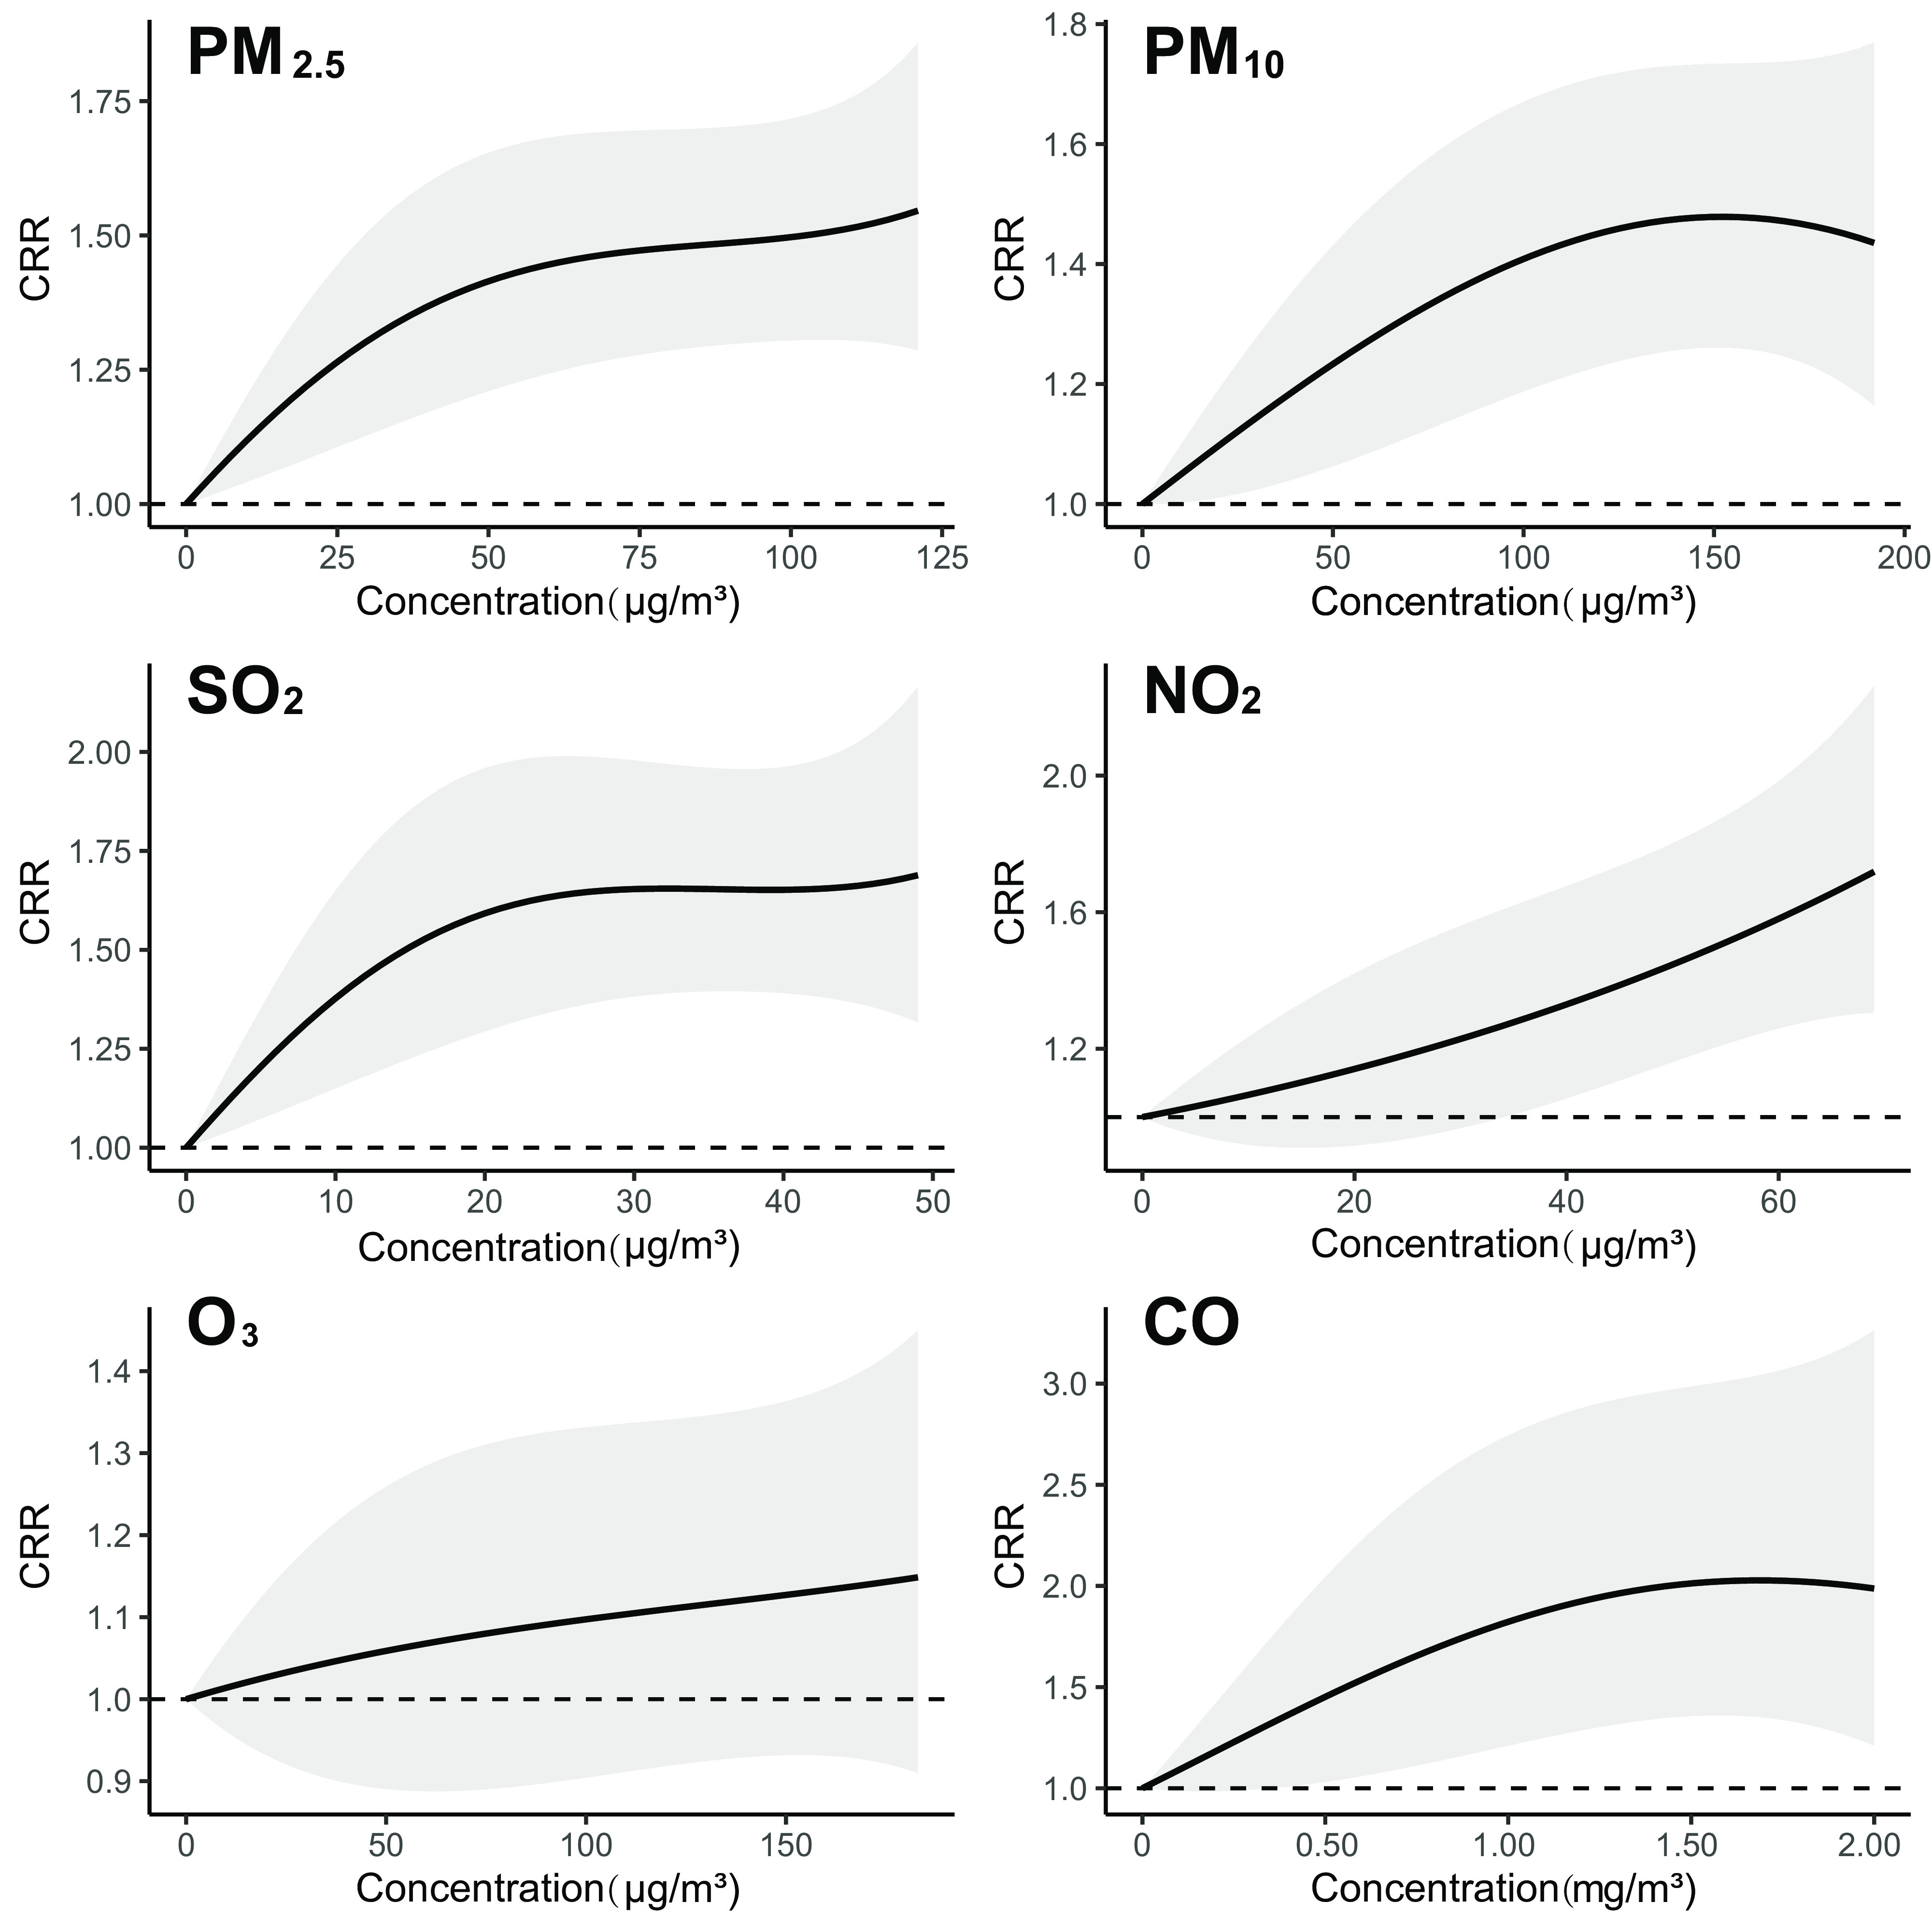
Results: A total of 3,735,934 influenza cases were reported in 82 cities from 2015 to 2019, accounting for 72.71% of the overall case number reported in the mainland of China. The time series models for each pollutant alone showed that the daily incidence of reported influenza cases was positively associated with almost all air pollutants except for ozone. The most prominent short-term associations were found for SO2 and NO2 with cumulative risk ratios of 1.094 [95% confidence interval (CI): 1.054, 1.136] and 1.093 (95% CI: 1.067, 1.119), respectively, for each 10 μg/m3 increase in the concentration at each of the lags of 1-7 d. Only NO2 showed a significant association with the daily incidence of influenza cases in the multipollutant model that adjusts all six air pollutants together. The impact of air pollutants on influenza was generally found to be greater in children, in subtropical cities, and during cold months.

Discussion: Increased exposure to ambient air pollutants, particularly NO2, is associated with a higher risk of influenza-associated illness. Policies on reducing air pollution levels may help alleviate the disease burden due to influenza infection. https://doi.org/10.1289/EHP12146.


Figures

Figure 1A is a map of China, highlighting the locations of the 82 cities selected for the primary analysis. The analysis is divided into five parts, namely, temperate climate zone, subtropical climate zone, tropical climate zone, plateau climate zone, and no data. A scale depicts kilometer ranges from 0 to 1,500 in increments of 500. Figure 1B is a set of six maps titled particulate matter begin subscript 2.5 end subscript, particulate matter begin subscript 10 end subscript, nitrogen dioxide, sulfur dioxide, ozone, and carbon monoxide, highlighting the spatial distributions of average concentration levels of the pollutants with their Pearson correlations with daily influenza incidence as per the city level. Points in circles include positive and negative correlations. Points are shaped as triangles when the correlation is not statistically significant (lowercase p greater than or equal to 0.05). Positive correlation coefficients range from negative 0.50 to 50 in increments of 20.
Figure 1.
Spatial distribution of average concentration levels of six air pollutants and Pearson correlations between daily influenza incidence and 1-week moving-average of air pollutant concentrations in selected Chinese cities during 2015–2019. (A) The locations of the 82 cities selected for the primary analysis. (B) The spatial distributions of average concentration levels of six pollutants (background) and their Pearson correlations with daily influenza incidence (points) at the city level. Points are colored red for positive correlation and blue for negative correlations. Points are shaped as triangles when the correlation is not statistically significant (p>0.05). The map outline in this figure was obtained from the Ministry of Civil Affairs of the People’s Republic of China (http://xzqh.mca.gov.cn/map). This figure was generated by using ArcGIS (version 10.7), QGIS (version 3.12) and R software (version 4.1.2). Numeric data for air pollution can be found in Tables S2–S4; Pearson correlation and p-value data can be found in Table S7. Note: CO, carbon monoxide; NO2, nitrogen dioxide; O3, ozone; PM, particulate matter; SO2, sulfur dioxide.
Figure 2 is a set of three forest plots. On the left, the forest plot is titled Age, plotting particulate matter begin subscript 2.5 end subscript, particulate matter begin subscript 10 end subscript, sulfur dioxide, nitrogen dioxide, ozone, and carbon monoxide, each includes children and adults (y-axis) across cumulative risk ratio, ranging from 0.975 to 1.175 in increments of 0.05 (x-axis) for cumulative risk ratio (95 percent confidence intervals). At the center, the forest plot is titled Climate, plotting particulate matter begin subscript 2.5 end subscript, particulate matter begin subscript 10 end subscript, sulfur dioxide, nitrogen dioxide, ozone, and carbon monoxide, each includes temperate zone and subtropical zone (y-axis) across cumulative risk ratio, ranging from 0.975 to 1.225 in increments of 0.05 (x-axis) for cumulative risk ratio (95 percent confidence intervals). On the right, the forest plot is titled Flu activity, plotting particulate matter begin subscript 2.5 end subscript, particulate matter begin subscript 10 end subscript, sulfur dioxide, nitrogen dioxide, ozone, and carbon monoxide, each includes high and low (y-axis) across cumulative risk ratio, ranging from 0.975 to 1.125 in increments of 0.05 (x-axis) for cumulative risk ratio (95 percent confidence intervals).
Figure 2.
Forest plots comparing the associations of six air pollutants with the daily incidence of influenza cases between subgroups defined by (A) age group, (B) climate zone, and (C) season of flu activity based on single-pollutant distributed lag models. The associations are presented as the cumulative risk ratios per 10μg/m3 increase in the air pollutant concentration simultaneously at all the lags of 1–7 d prior to symptom onset for 3,735,934 cases reported from 2015 to 2019 in 82 cities in China. Note: CI, confidence interval; CO, carbon monoxide; CRR, cumulative risk ratio; NO2, nitrogen dioxide; O3, ozone; PM, particulate matter; SO2, sulfur dioxide.
Figure 3 is a six ribbon plus line graphs titled particulate matter begin subscript 2.5 end subscript, particulate matter begin subscript 10 end subscript, sulfur dioxide, nitrogen dioxide, ozone, and carbon monoxide, plotting cumulative risk ratio, ranging from 1.00 to 1.75 in increments of 0.25; 1.0 to 1.6 in increments of 0.2; 1.00 to 2.00 in increments of 0.25; 1.2 to 2.0 in increments of 0.4; 0.9 to 1.4 in increments of 0.1; and 1.0 to 3.0 in increments of 0.5 (y-axis) across concentration (micrograms per meter cubed), ranging from 0 to 125 in increments of 25; 0 to 200 in increments of 50; 0 to 50 in increments of 10; 0 to 60 in increments of 20; 0 to 150 in increments of 50; and 0 to 2.00 in increments of 0.50 (x-axis), respectively.
Figure 3.
Nonlinear associations of six air pollutants with the daily incidence of influenza cases at different levels of concentration based on single-pollutant distributed lag models. The associations are presented as the cumulative risk ratios per 10μg/m3 increase in the air pollutant concentration simultaneously at all the lags of 1–7 d prior to symptom onset for 3,735,934 cases reported from 2015 to 2019 in 82 cities in China. The shaded areas represent the 95% CIs. Numeric data on CRR and CI for this figure can be found in Excel Table S2. Note: CI, confidence interval; CO, carbon monoxide; CRR, cumulative risk ratio; NO2, nitrogen dioxide; O3, ozone; PM, particulate matter; SO2, sulfur dioxide.

References

    1. Feng W, Li H, Wang S, Van Halm-Lutterodt N, An J, Liu Y, et al. . 2019. Short-term PM10 and emergency department admissions for selective cardiovascular and respiratory diseases in Beijing, China. Sci Total Environ 657:213–221, PMID: , 10.1016/j.scitotenv.2018.12.066. - DOI - PubMed
    1. Huang F, Luo Y, Tan P, Xu Q, Tao L, Guo J, et al. . 2017. Gaseous air pollution and the risk for stroke admissions: a case-crossover study in Beijing, China. Int J Environ Res Public Health 14(2):189, PMID: , 10.3390/ijerph14020189. - DOI - PMC - PubMed
    1. Su PF, Sie FC, Yang CT, Mau YL, Kuo S, Ou HT. 2020. Association of ambient air pollution with cardiovascular disease risks in people with type 2 diabetes: a Bayesian spatial survival analysis. Environ Health 19(1):110, PMID: , 10.1186/s12940-020-00664-0. - DOI - PMC - PubMed
    1. Zhang Z, Dong B, Li S, Chen G, Yang Z, Dong Y, et al. . 2019. Exposure to ambient particulate matter air pollution, blood pressure and hypertension in children and adolescents: a national cross-sectional study in China. Environ Int 128:103–108, PMID: , 10.1016/j.envint.2019.04.036. - DOI - PubMed
    1. Feng C, Li J, Sun W, Zhang Y, Wang Q. 2016. Impact of ambient fine particulate matter (PM2.5) exposure on the risk of influenza-like-illness: a time-series analysis in Beijing, China. Environ Health 15:17, PMID: , 10.1186/s12940-016-0115-2. - DOI - PMC - PubMed

Publication types