. 2024 Jan;625(7996):778-787.
doi: 10.1038/s41586-023-06903-x. Epub 2023 Dec 11.

Distinct Hodgkin lymphoma subtypes defined by noninvasive genomic profiling

Affiliations

Distinct Hodgkin lymphoma subtypes defined by noninvasive genomic profiling

Stefan K Alig et al. Nature. 2024 Jan.

Abstract

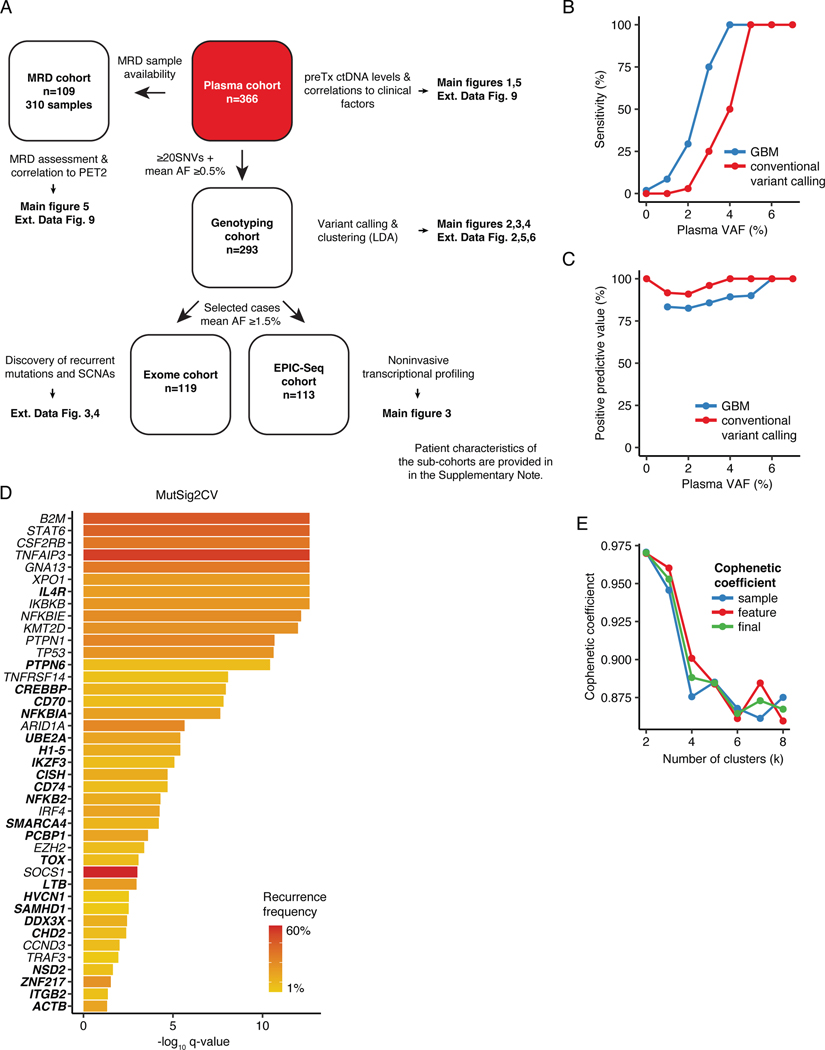
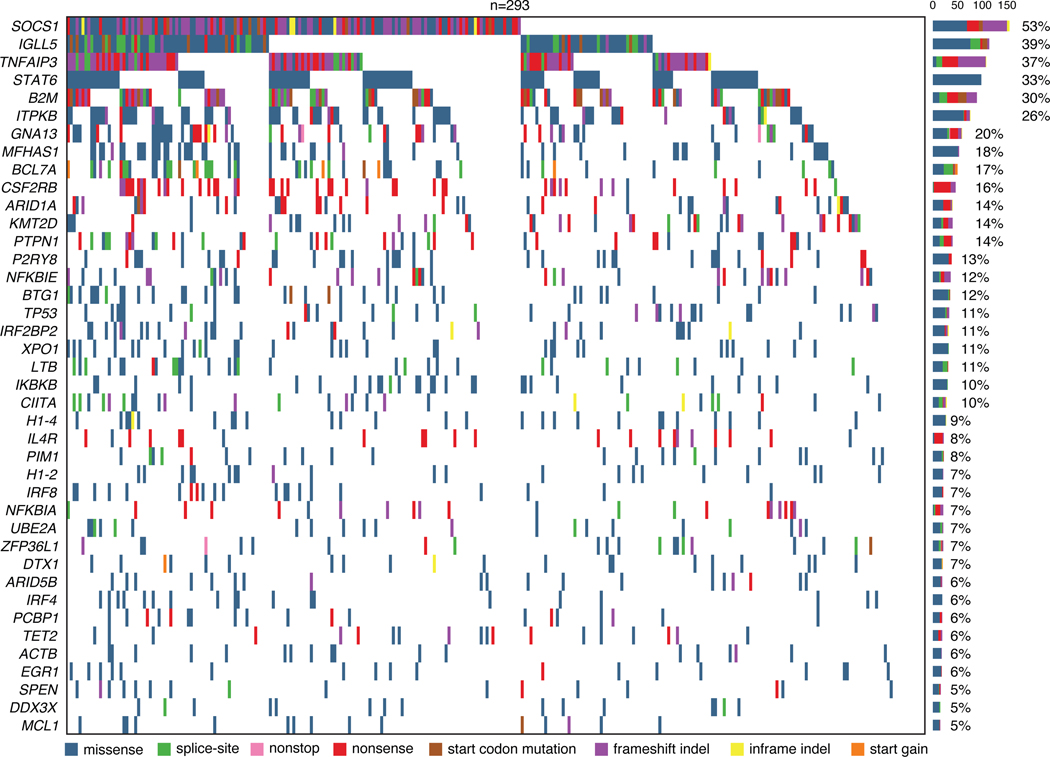
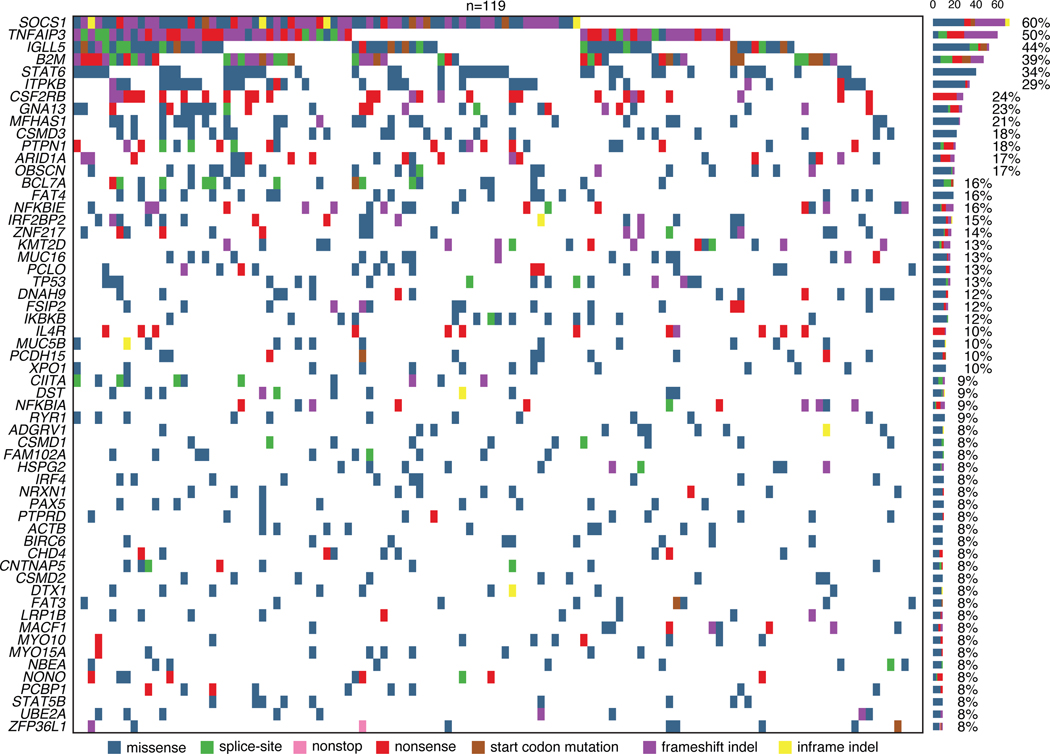
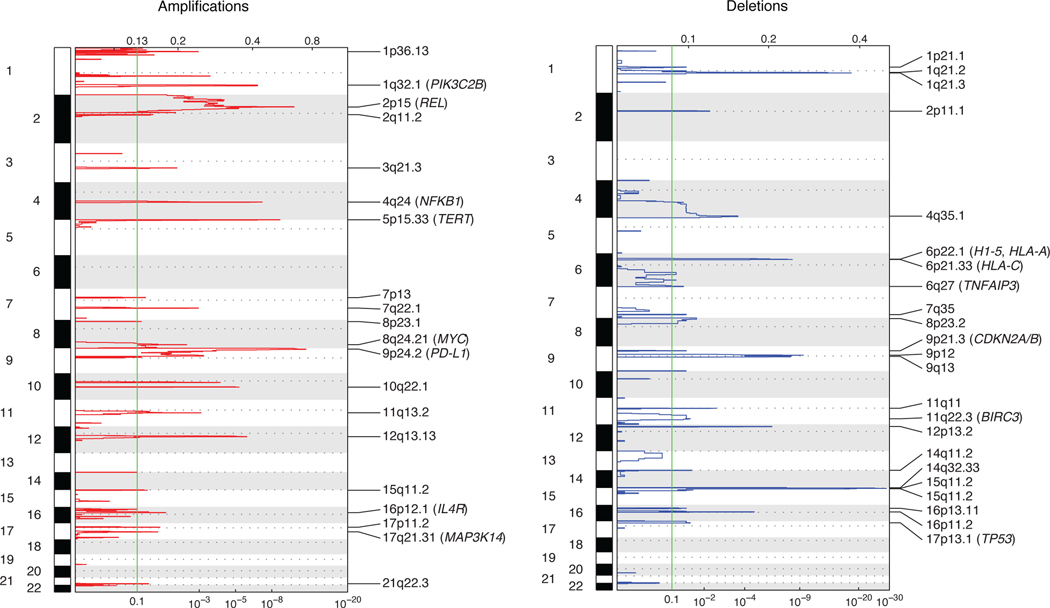
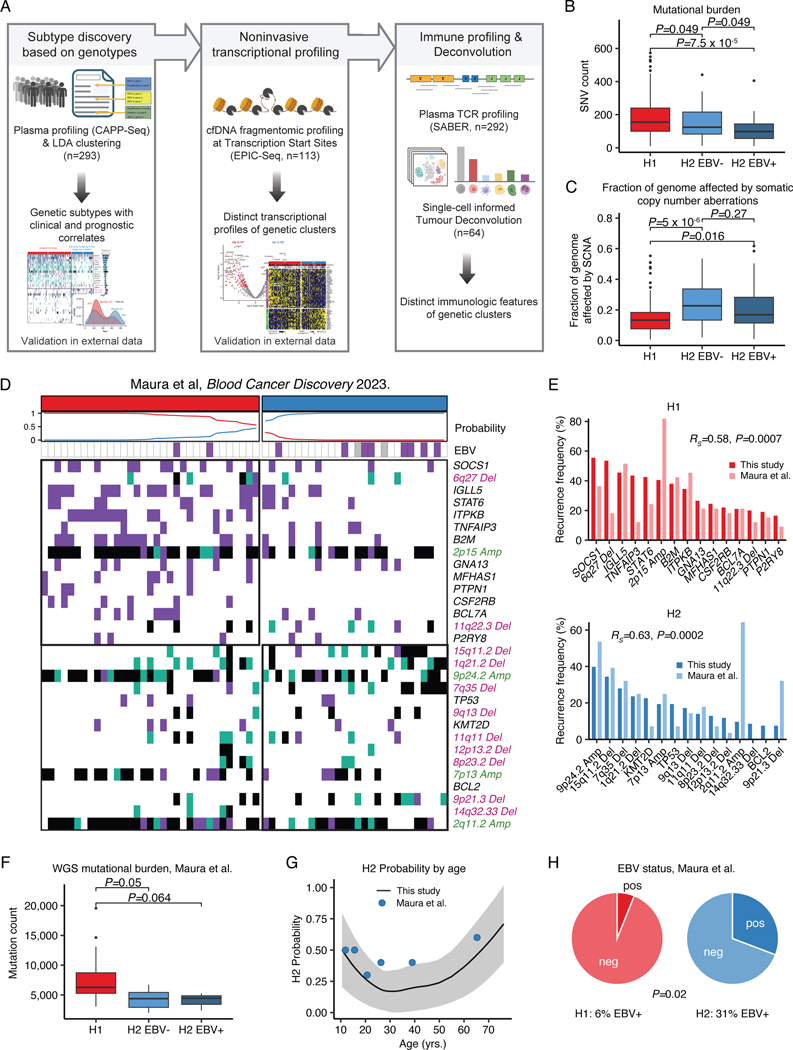
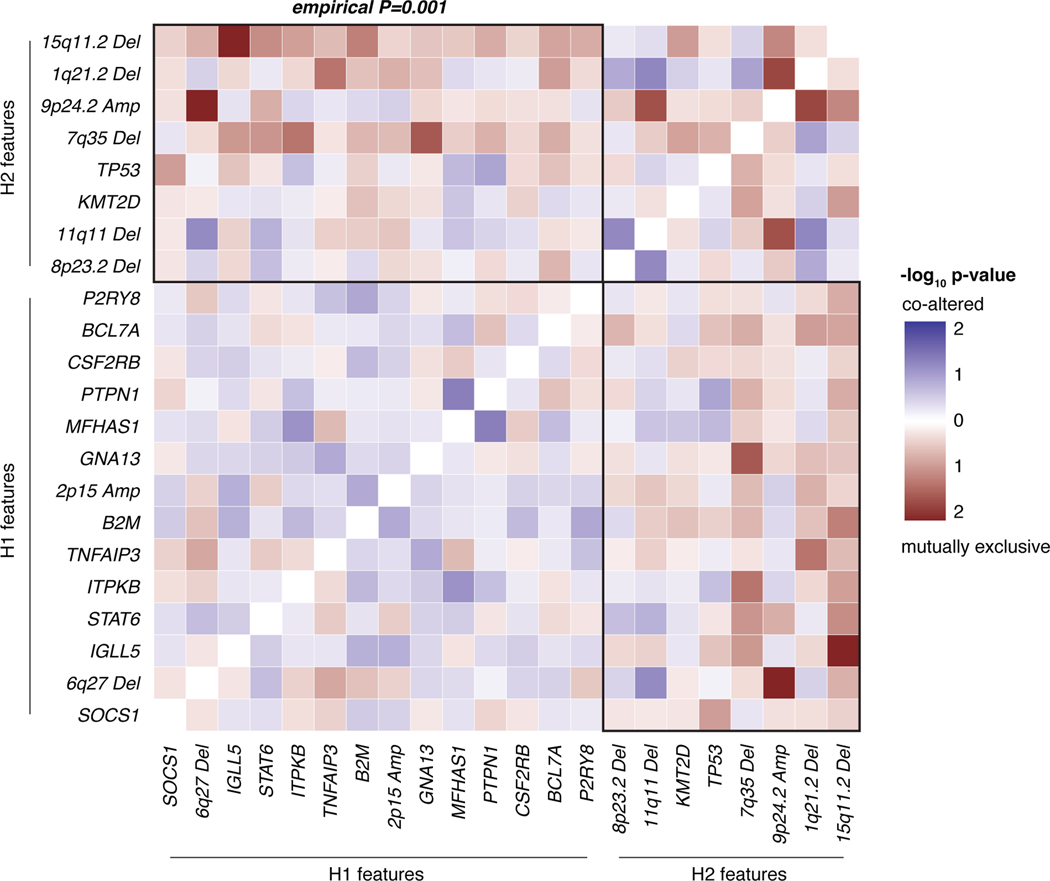
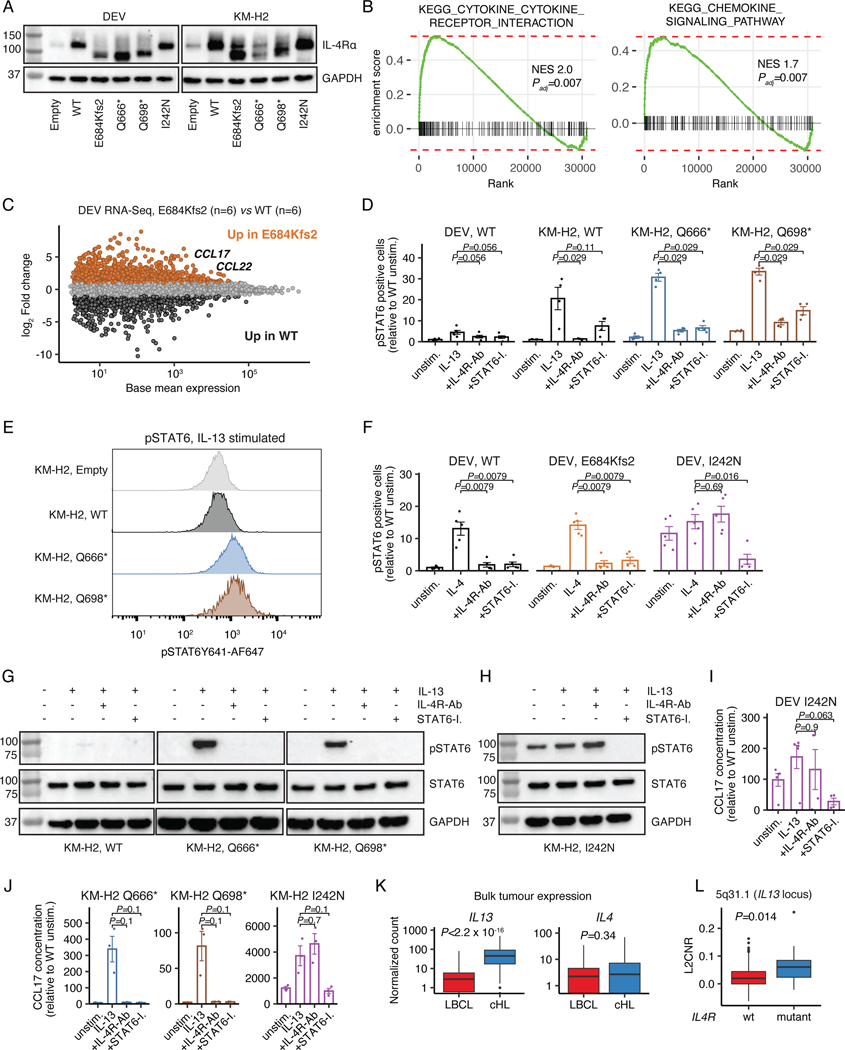
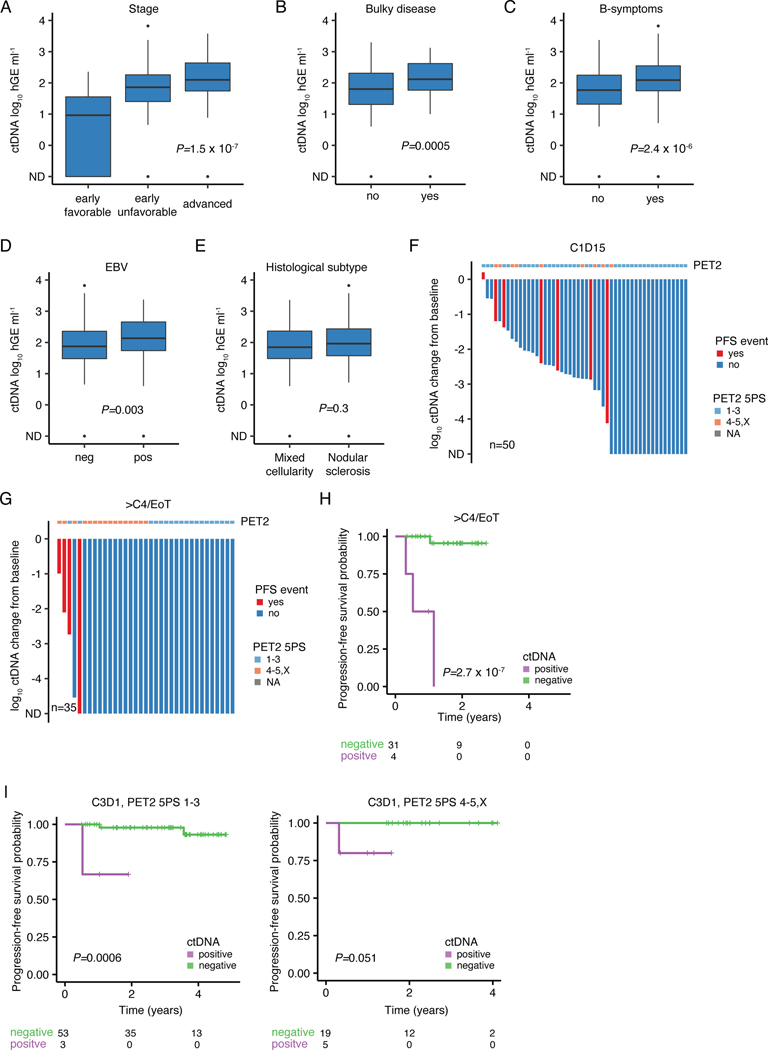
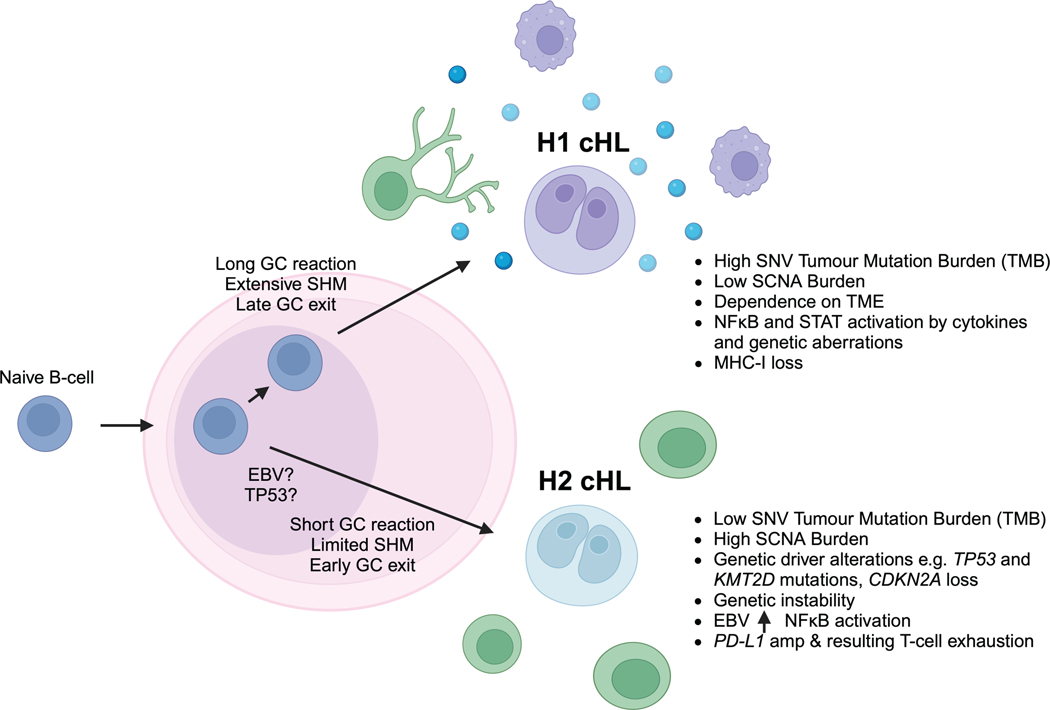
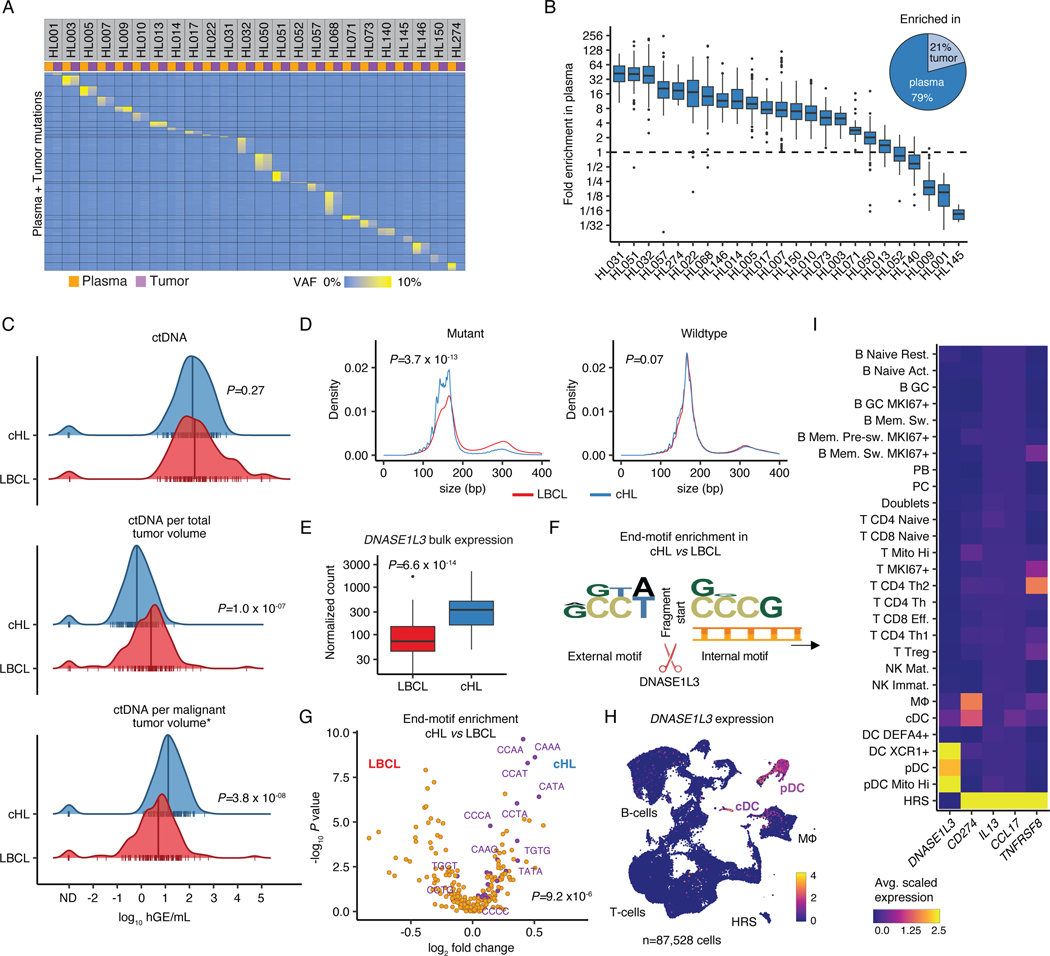
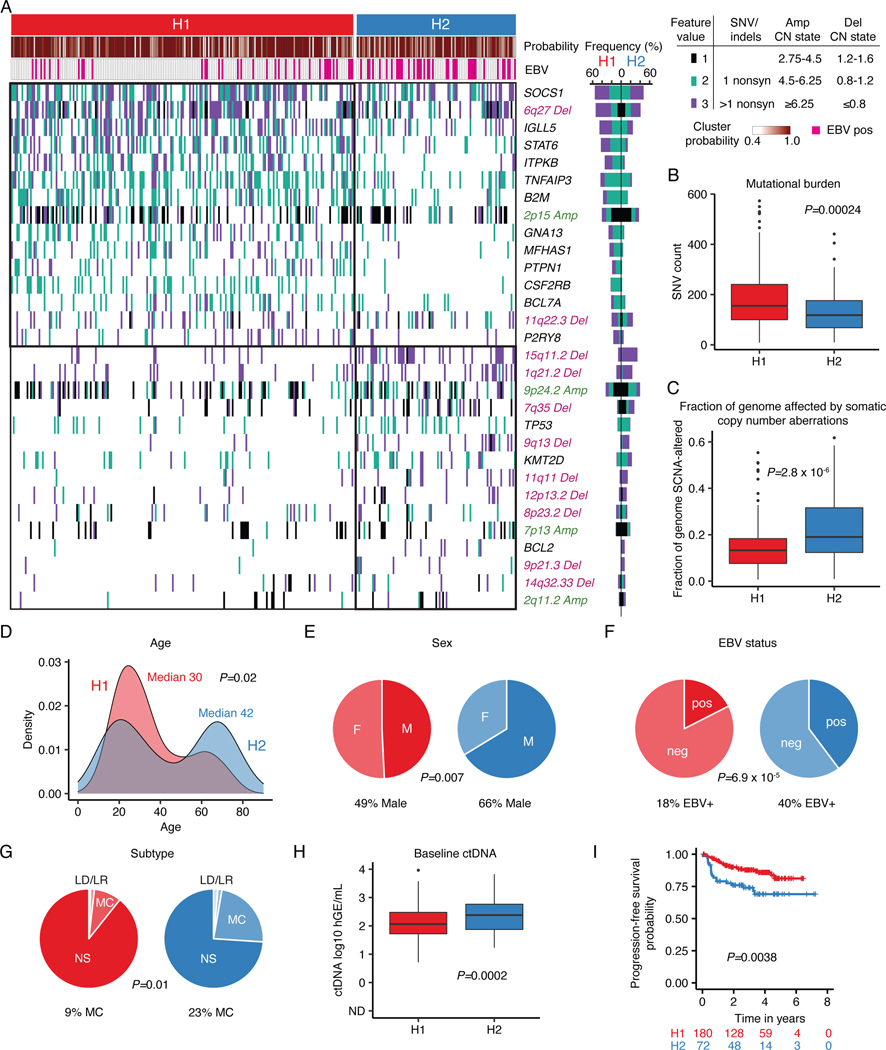
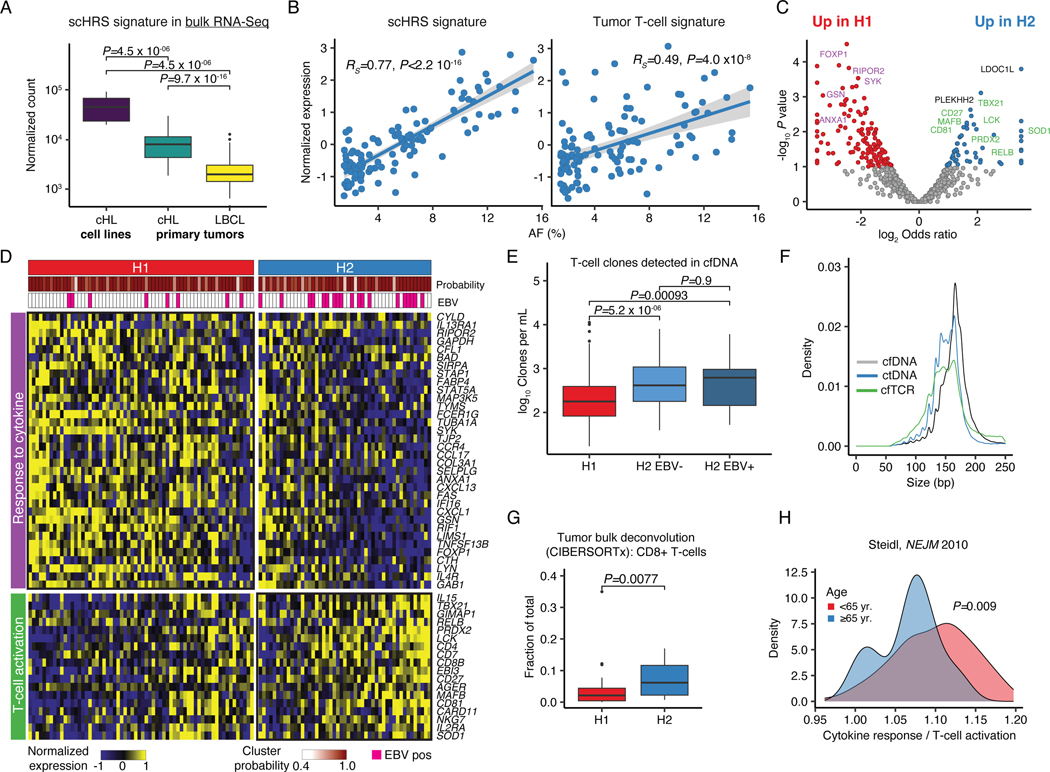
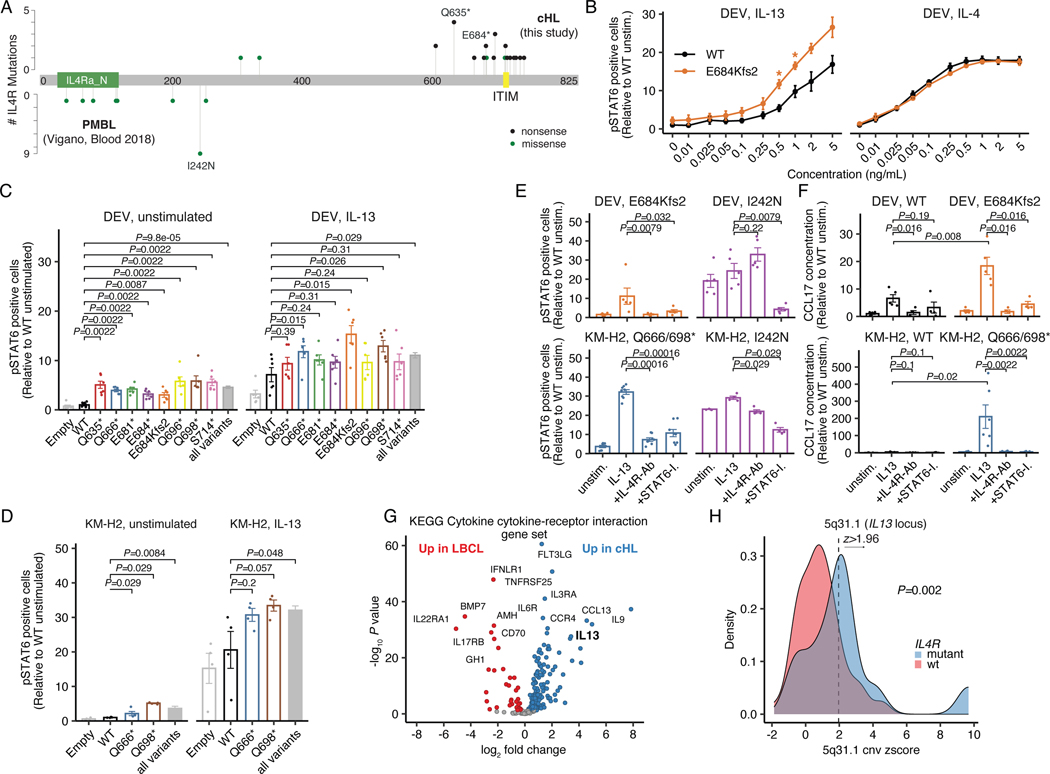
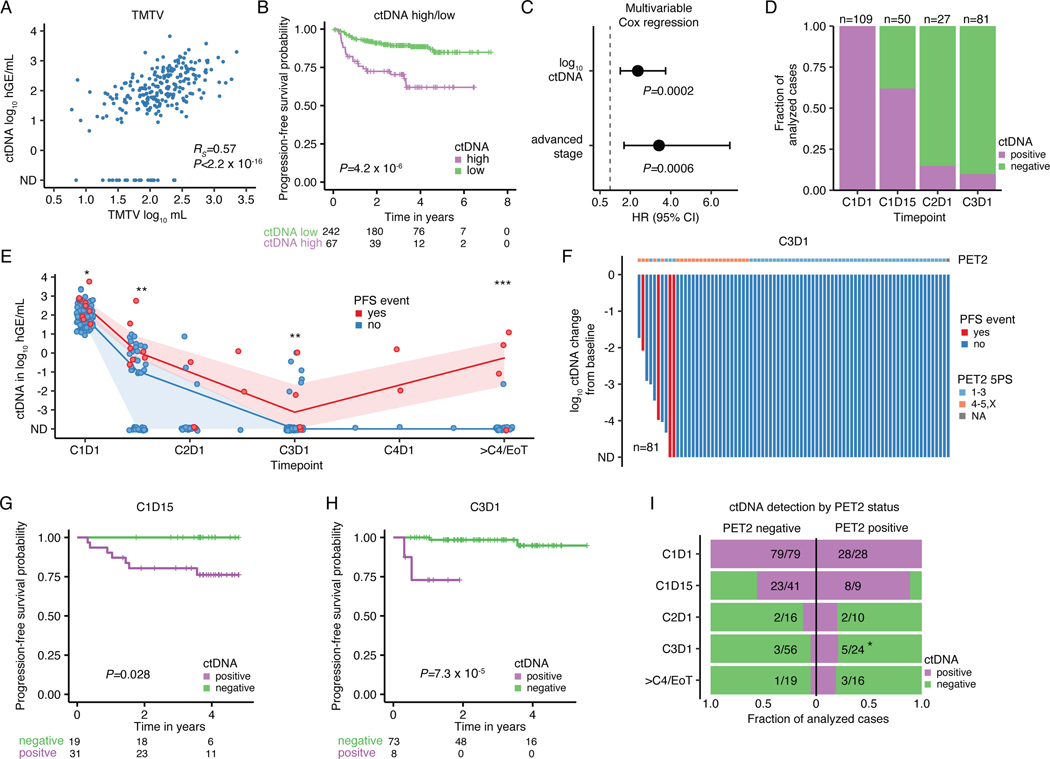
The scarcity of malignant Hodgkin and Reed-Sternberg cells hampers tissue-based comprehensive genomic profiling of classic Hodgkin lymphoma (cHL). By contrast, liquid biopsies show promise for molecular profiling of cHL due to relatively high circulating tumour DNA (ctDNA) levels1-4. Here we show that the plasma representation of mutations exceeds the bulk tumour representation in most cases, making cHL particularly amenable to noninvasive profiling. Leveraging single-cell transcriptional profiles of cHL tumours, we demonstrate Hodgkin and Reed-Sternberg ctDNA shedding to be shaped by DNASE1L3, whose increased tumour microenvironment-derived expression drives high ctDNA concentrations. Using this insight, we comprehensively profile 366 patients, revealing two distinct cHL genomic subtypes with characteristic clinical and prognostic correlates, as well as distinct transcriptional and immunological profiles. Furthermore, we identify a novel class of truncating IL4R mutations that are dependent on IL-13 signalling and therapeutically targetable with IL-4Rα-blocking antibodies. Finally, using PhasED-seq5, we demonstrate the clinical value of pretreatment and on-treatment ctDNA levels for longitudinally refining cHL risk prediction and for detection of radiographically occult minimal residual disease. Collectively, these results support the utility of noninvasive strategies for genotyping and dynamic monitoring of cHL, as well as capturing molecularly distinct subtypes with diagnostic, prognostic and therapeutic potential.


Figures

Extended Data Figure 1:
Extended Data Figure 1:. Noninvasive profiling of cHL.
(A) Study overview. MRD: Minimal residual disease; PET2: Positron emission tomography after 2 cycles of chemotherapy; preTx: pretreatment; AF: allelic fraction; SNV: single nucleotide variants; LDA: Latent Dirichlet Allocation; SCNA: somatic copy number aberration; EPIC-Seq: epigenetic expression inference from cell-free DNA-sequencing. (B) Line plot summarizing sensitivity of the Gradient Boosting Machine (GBM) model to call exome-wide SNVs as a function of plasma VAF in 2 non-Hodgkin lymphoma validation samples as compared with a conventional workflow. Sensitivity was calculated considering mutations with VAFs ranging from x-1 to x+1%. Tumor mutation calls were considered ground truth for sensitivity estimation. (C) Line plot summarizing positive predictive values (PPV) of the GBM model as a function of plasma VAF in 2 non-Hodgkin lymphoma validation samples as compared with a conventional workflow. PPV was calculated considering mutations with VAFs ranging from x-1 to x+1%. The union of tumor and deep plasma exome mutation calls were considered ground truth for PPV estimation. (D) Bar plot summarizing MutSig2CV -log10 q-values of 41 genes found to be significantly mutated in targeted or whole exome sequencing (q-value <0.05). The heat of the bars reflects mutation recurrence frequency. Genes that have not been recurrently described in the cHL literature (i.e. ≤1 study comprising at least 50 patients) are highlighted in bold. (E) Cophenetic coefficients (sample, feature and final) by number of clusters (k) when applied to the Latent Dirichlet Allocation (LDA) framework to identify genetic subtypes in 293 cHL cases.
Extended Data Figure 2:
Extended Data Figure 2:. Oncoprint visualizing targeted SNV and indel variant calls.
Genes with mutation frequencies ≥5% are visualized. If more than 1 variant per gene was identified in a patient, color coding was derived using the following hierarchy: nonsense > start codon mutation > frameshift indel > nonstop > splice-site > missense > inframe indel. N=293 pretreatment plasma samples were included in the analysis.
Extended Data Figure 3:
Extended Data Figure 3:. Oncoprint visualizing whole exome SNV and indel variant calls.
Genes with mutation frequencies ≥7.5% are visualized. If more than 1 variant per gene was identified in a patient, color coding was derived using the following hierarchy: nonsense > start codon mutation > frameshift indel > nonstop > start gain > splice-site > missense > inframe indel. N=119 cases profiled by plasma exome sequencing were included in the analysis.
Extended Data Figure 4:
Extended Data Figure 4:. GISTIC2 peaks identified in 61 plasma samples profiled by whole exome sequencing with AFs ≥5%.
Selected gene symbols of genes of interest falling within a peak are annotated with the cytobands. Top x-axis: G-score, bottom x-axis: q-value.
Extended Data Figure 5:
Extended Data Figure 5:. Mutual exclusivity/ co-association analysis using the DISCOVER R-package.
Heatmaps summarizing (A) unadjusted -log10 p-values or (B) -log10 q-values for mutual exclusivity/ co-association, respectively. Alterations that tend to co-occur are visualized in blue, while those with a tendency for mutual exclusivity are depicted in red colors. Non-silent mutations and SCNA as summarized in the LDA clustering matrix observed in >20 patients among 293 cases were included in the analysis. Statistics were performed using the DISCOVER R-package.
Extended Data Figure 6:
Extended Data Figure 6:. Genetic subtypes are independent of EBV status and validate in external data.
(A) Overview figure summarizing genetic cHL subtype discovery and validation. LDA: Latent Dirichlet Allocation; cfDNA: cell-free DNA; TCR: T-cell receptor. (B-C) Boxplots and Wilcoxon p-values (two-sided) summarizing the targeted SNV burden (B), and fraction of the genome affected by SCNAs (C) in cluster H1 (n=200), H2 EBV- (n=56) and H2 EBV+ (n=37) in the plasma sequencing cohort. (D) Heatmap summarizing non-silent mutations and SCNAs (rows) of 61 patients with cHL (columns) as published in Maura et al. Clusters were assigned using the probabilistic model generated by LDA from the plasma discovery cohort as shown in Figure 2. (E) Bar plot visualizing recurrence frequencies of features associated with subtype H1 (top) and H2 (bottom) as presented in panel D. Dark colors denote frequencies from plasma genotyping (H1: n=200; H2: n=93, as visualized in Figure 2) while light colors reflect frequencies as described in Maura et al (H1: n=33; H2: n=28). Spearman rhos and p-values (algorithm AS 89) provided in the graphs describe the correlation of recurrence frequencies from all 30 features visualized in D between this study and Maura et al. within H1 and H2, respectively. (F) Boxplots summarizing the whole genome mutational burden in cluster H1 (n=16), H2 EBV- (n=5) and H2 EBV+ (n=3) in patients with available whole genome sequencing and known EBV status from Maura et al. Wilcoxon p-values (two-sided) are provided. (G) Loess regression describing the association of age and the probability of assignment to the H2 subtype in n=292 patients from the plasma genotyping cohort (black line: mean; ribbon: standard deviation*1.96). Each dot represents a group of 10 patients from Maura et al (n=60 total) with x and y illustrating average age, and the fraction of H2 cases within the group, respectively. Patients were sorted by age prior to grouping. (H) Pie chart summarizing EBV status of patients from Maura et al. assigned to the H1 (n=33) and H2 (n=26) clusters. Two-sided Fisher’s exact test p-value is provided. Panels B,C,F: each box represents the interquartile range (the range between the 25th and 75th percentile) with the median of the data, whiskers indicate the upper and lower value within 1.5 times the IQR.
Extended Data Figure 7:
Extended Data Figure 7:. Mutual exclusivity analysis in the validation cohort.
Mutual exclusivity/ co-association analysis using the DISCOVER R-package. The heatmap summarizes -log10 p-values for mutual exclusivity/ co-association, respectively. The mutual exclusivity of H1- and H2- defining features (black boxes) was compared to a null distribution constructed by random shuffling of the matrix while maintaining the number of cluster-defining features. To provide a single measure of mutual exclusivity, p-values (one-sided, mutual exclusivity) were combined using Fisher’s method. The empirical p-value provided on the top of the heatmap was defined by comparing the observed combined p-value with the null distribution. Features from Extended Data Fig. 6D with greater than 4 occurrences were visualized. In addition, only one cytoband per chromosome was visualized selected by their rank in the feature list of H1/H2.
Extended Data Figure 8:
Extended Data Figure 8:. Truncating IL4R mutations enhance STAT6 signaling.
(A) Immunoblot showing protein levels of IL4R and GAPDH in transduced DEV and KM-H2 cells. (B) Gene set enrichment plots from RNA-Sequencing showing enrichment of canonical KEGG pathways in mutant (E684Kfs2, n=6) vs WT (n=6) expressing DEV cells. Normalized enrichment scores (NES) and adjusted p-values (fgsea R-package) are provided. (C) Scatter plot visualizing base mean expression and log2 fold change comparing gene expression in mutant (E684Kfs2, n=6) vs WT (n=6) expressing DEV cells. Absolute log2 fold changes >1 are highlighted in orange or black, respectively. (D) Phospho-STAT6 levels (flow) in transduced DEV (n=5 each) and KM-H2 (n=4 each) cells under unstimulated, IL13-stimulated, IL13-stimulated + IL4R-Ab treated as well as IL13-stimulated + STAT6-I. treated conditions. Unadjusted Wilcoxon p-values (two-sided) compared to IL13 stimulation alone are provided. (E) Representative phospho-STAT6 flow raw data for KM-H2 Empty, WT, Q666* and Q698* constructs under IL13-stimulated conditions. (F) Phospho-STAT6 levels in WT, E684Kfs2 and I242N (PMBL hotspot) DEV cells under unstimulated, IL4-stimulated, IL4-stimulated + IL4R-Ab treated as well as IL4-stimulated + STAT6-I. treated conditions (n=5 each). Unadjusted Wilcoxon p-values (two-sided) compared to IL4 stimulation alone are provided. (G) Representative immunoblot showing protein levels of pSTAT6, STAT6 and GAPDH in KM-H2 cells as a function on IL4R construct expression under unstimulated, IL13-stimulated, IL13-stimulated + IL4R-Ab treated as well as IL13-stimulated + STAT6-I. treated conditions. All conditions were run on the same gel. Ladders run between IL4R constructs were cropped and are not shown. (H) Immunoblot showing protein levels of pSTAT6, STAT6 and GAPDH in IL4R I242N expressing KM-H2 cells under unstimulated, IL13-stimulated, IL13-stimulated + IL4R-Ab treated as well as IL13-stimulated + STAT6-I. treated conditions. (I-J) CCL17 (TARC) concentrations in supernatant of transduced (I) DEV (n=5 for unstimulated and IL13; n=4 for IL4R-Ab and STAT6-I.) and (J) KM-H2 (n=3 each) cells under unstimulated, IL13-stimulated, IL13-stimulated + IL4R-Ab treated as well as IL13-stimulated + STAT6-I. treated conditions. Unadjusted Wilcoxon p-values (two-sided) are provided. (K) Boxplots and Wilcoxon p-values (two-sided) comparing IL13 and IL4 expression in RNA-Sequencing of primary bulk tumor specimens visualized as normalized counts (n=86 cHL, n=66 LBCL). (L) Log2 copy number ratio (L2CNR, boxplot and Wilcoxon p-value, two-sided) of the 5q31.1 cytoband harboring IL13 stratified by IL4R mutation status in n=119 patients with plasma exome sequencing [IL4R mutant: n=12; IL4R WT: n=107]. Panels A,G-H: At least 2 independent experiments were performed for each condition. Panels D,F,I,J: mean +/− standard error (se). Panels K-L: each box represents the interquartile range (the range between the 25th and 75th percentile) with the median of the data, whiskers indicate the upper and lower value within 1.5 times the IQR.
Extended Data Figure 9:
Extended Data Figure 9:. Pretreatment ctDNA correlates with clinical risk factors and MRD is an independent prognostic factor in cHL.
(A-E) Previously untreated, adult cHL patients were considered for associations between pretreatment ctDNA levels and clinical variables (n=309). Boxplots summarizing pretreatment ctDNA levels by (A) stage (n=309, Kruskal-Wallis p-value), (B) bulky disease (n=184, Wilcoxon p-value), (C) B-symptoms (n=308, Wilcoxon p-value), (D) EBV status (n=309, Wilcoxon p-value) and (E) histological subtype (n=247, Wilcoxon p-value). Patients with lymphocyte rich and lymphocyte depleted subtypes are not visualized due to small numbers (n=9). All p-values were derived from two-sided tests. (F-G) Waterfall plot showing log10 ctDNA changes from baseline at (F) C1D15 and (G) the >C(ycle)4/EoT (End of Treatment) timepoint. Bars are colored by PFS event status. Top annotation visualizes PET2 readings according to 5-point scale (5PS Deauville). (H) Kaplan-Meier curves and logrank p-value showing PFS stratified by ctDNA detection at >C4/EoT. (I) Kaplan-Meier curves and logrank p-values showing progression-free survival (PFS) stratified by ctDNA detection at C3D1 in PET2 negative and PET2 positive patients. Panels A-E: each box represents the interquartile range (the range between the 25th and 75th percentile) with the median of the data, whiskers indicate the upper and lower value within 1.5 times the IQR.
Extended Data Figure 10:
Extended Data Figure 10:. Model depicting the potential pathogenesis of H1 and H2 cHL subtypes.
GC: Germinal center; SHM: Somatic hypermutation; SNV: Single nucleotide variant; SCNA: Somatic copy number aberrations. Created with BioRender.com.
Figure 1:
Figure 1:. Liquid biopsies facilitate molecular profiling of cHL.
(A) Heatmap visualizing plasma and tumor representation (VAF) of cHL SNVs (rows) called in plasma or tumor samples (columns, n=24 pairs). (B) Boxplot depicts the fold enrichment of plasma over tumor VAF for SNVs called in either specimen (n=3,171; median per patient 124 [range 10–335]). The pie chart shows the fraction of sample pairs enriched in either tissue. (C) Comparison of ctDNA levels between previously untreated patients with cHL (n=142) and LBCL (n=114) visualized by density ridge plots with Wilcoxon p-values (two-sided). The top graph shows absolute ctDNA levels (log10 hGE/mL), the middle graph log10 ctDNA levels per TMTV (mL) and the bottom graph log10 ctDNA levels per inferred malignant tumor volume (calculated as TMTV [mL] multiplied by estimated tumor fraction [cHL: 0.05; LBCL: 0.5]). (D) Density plots with Wilcoxon p-values (two-sided) comparing cfDNA fragment length for mutant and wildtype molecules between cHL (n=300) and LBCL (n=53). (E) Boxplot with Wilcoxon p-value (two-sided) comparing DNASE1L3 bulk expression visualized as normalized counts (n=86 cHL, n=66 LBCL). (F) Logo plot summarizing overrepresentation of external and internal 4-mer motifs at fragment ends in mutant cHL over mutant LBCL molecules (n=294 cHL, n=48 LBCL). (G) Volcano plot depicting enrichment of end-motifs in mutant cHL vs LBCL molecules (x-axis: log2 median fold change, y-axis: -log10 p-value [Wilcoxon, two-sided]). Wilcoxon p-value (two-sided) comparing the abundance of previously described 25 end-motifs associated with DNASE1L3 digestion (purple) among mutant molecules in cHL vs LBCL patients is provided. (H) scRNA-Sequencing UMAP with DNASE1L3 expression (heat). (I) Average scaled expression of selected HRS genes and DNASE1L3 by cell type. Panels B,E: each box represents the interquartile range (the range between the 25th and 75th percentile) with the median of the data, whiskers indicate the upper and lower value within 1.5 times the IQR.
Figure 2:
Figure 2:. Genetic subtypes of cHL identified by LDA clustering.
(A) Heatmap summarizing non-silent mutations and SCNAs (rows) identified through noninvasive profiling of 293 pretreatment plasma samples (columns). Unsupervised clustering identified two distinct genetic subtypes denoted as H1 (n = 200) and H2 (n = 93). The top annotations visualize cluster assignment probability and EBV status. A legend summarizing the definition of feature values as used for clustering is provided in the top right. Alteration recurrence frequencies within each subtype by feature value are provided as a stacked bar plot. The top 15 features associated with each cluster are visualized. Indel, insertion and deletion; CN, copy number; SNV, single-nucleotide variant. (B-C) Boxplots with Wilcoxon p-values (two-sided) summarizing the targeted SNV burden (B), and fraction of the genome affected by SCNAs (C) by genetic subtype (n=293). (D) Density plot and Wilcoxon p-value (two-sided) summarizing age by genetic subtype (n=292 [n=200 H1, n=92 H2]). Median values are provided in the graph. (E-G) Pie charts and two-sided Fisher’s exact test p-values summarizing distributions of sex (E, n=288 [n=199 H1, n=89 H2]), EBV status (F, n=293) and histological subtype (G, n=241 [n=168 H1, n=73 H2], NS: nodular sclerosis, MC: mixed cellularity, LR: lymphocyte rich, LD: lymphocyte depleted subtypes) distribution by genetic subtype. (H) Boxplots and Wilcoxon p-value (two-sided) summarizing pretreatment ctDNA levels by genetic subtype (n=293). (I) Kaplan-Meier curves showing progression-free survival (PFS) stratified by genetic subtype. Logrank p-value and numbers at risk are provided in the graph. Only previously untreated, adult cHL patients were included in this analysis (n=252). Panels B,C,H: each box represents the interquartile range (the range between the 25th and 75th percentile) with the median of the data, whiskers indicate the upper and lower value within 1.5 times the IQR.
Figure 3:
Figure 3:. Genetic cHL subtypes are transcriptionally distinct.
(A) Boxplot and Wilcoxon p-values (two-sided) visualizing expression of a single-cell derived HRS (scHRS) gene signature in bulk RNA-Sequencing of cHL cell lines (n=8), and primary tumors (n=86 cHL, n=66 LBCL). (B) Scatter plot with Spearman rho and p-value (algorithm AS 89) delineating the correlation between mutational AF and inferred expression of the scHRS and a tumor T-cell signature using EPIC-Seq (n=113). (C) Volcano plot showing differentially expressed genes between clusters H1 (n=64) and H2 (n=49) as assessed by EPIC-Seq. (colored dots: unadjusted P<0.1 two-sided Fisher’s exact test). Genes from pathways visualized in (D) are highlighted in purple or green, respectively. (D) Heatmap visualization of 2 top differentially expressed pathways between H1 and H2 (GO:0034097, GO:0042110) at case and gene level. Top annotations denote cluster assignment probability and EBV status. (E) Boxplots and unadjusted Wilcoxon p-values (two-sided) visualizing T-cell counts per mL plasma detected from cfDNA using SABER (n=199 H1, n=56 H2 EBV-, n=37 H2 EBV+). (F) Length density plots of fragments supporting rearranged TCRs (cfTCR) as compared to wildtype (cfDNA) and mutant (ctDNA) supporting molecules (n=292, same as E). (G) CIBERSORTx deconvolution of 64 bulk cHL profiled by RNA-Sequencing using a scRNA-Sequencing derived signature matrix. Boxplot and Wilcoxon p-value (two-sided) comparing the CD8 T-cell content by genetic subtype (n=47 H1, n=17 H2). (H) Density plot and Wilcoxon p-value (two-sided) visualizing the ratio of the average normalized expression of cytokine response and T-cell activation genes visualized in (D) in gene expression data generated in prior studies. Patients with ≥65 years (yr., n=19) and those <65 yr. (n=111) are visualized separately. Panels A,E,G: each box represents the interquartile range (the range between the 25th and 75th percentile) with the median of the data, whiskers indicate the upper and lower value within 1.5 times the IQR.
Figure 4:
Figure 4:. Truncating IL4R mutations enhance IL13 signaling and are targetable through IL4R antibodies.
(A) Lollipop plot summarizing IL4R mutations identified in cHL patients (n=26, top) as compared to PMBL patients (n=16, bottom). Nonsense (black) and missense mutations (green). (B) Dose-response curves for IL13/IL4 in transduced DEV cells using phospho-STAT6 (flow cytometry) as readout. WT and E684Kfs2: n=3 each. * P<0.05 (t-test, two-sided; P=0.013 at 0.5ng/mL and P=0.028 at 1ng/mL). (C) Phospho-STAT6 levels in unstimulated and IL13-stimulated transduced DEV cells (n=6 each; grey bar: all mutants [all variants, n=48]). Unadjusted Wilcoxon p-values (two-sided) compared to WT are provided. (D) Phospho-STAT6 levels in unstimulated and IL13-stimulated transduced KM-H2 cells (n=4 each; grey bar: all mutants [all variants, n=8]). Unadjusted Wilcoxon p-values (two-sided) compared to WT are provided. (E) Phospho-STAT6 levels in transduced DEV (n=5 each) and KM-H2 (n=4 each) cells under unstimulated, IL13-stimulated, IL13-stimulated + IL4R-antibody (IL4R-Ab) treated as well as IL13-stimulated + STAT6-Inhibitor (STAT6-I.) treated conditions. Unadjusted Wilcoxon p-values (two-sided) compared to IL13 stimulation alone are provided. (F) CCL17 (TARC) concentrations with unadjusted Wilcoxon p-values (two-sided) in supernatant of transduced DEV (n=5 for unstimulated/IL13; n=4 for IL4R-Ab/STAT6-I.) and KM-H2 cells (n=3 each) under unstimulated, IL13-stimulated, IL13-stimulated + IL4R-Ab treated as well as IL13-stimulated + STAT6-I. treated conditions. (G) Volcano plot summarizing differentially expressed genes from the KEGG Cytokine cytokine-receptor interaction gene set between cHL (n=86) and LBCL (n=66) in bulk RNA-Sequencing. (H) Copy-number (CN) z-score (density plot) of the 5q31.1 cytoband harboring IL13 stratified by IL4R mutation status in patients with plasma exome sequencing [IL4R mutant: n=12; IL4R WT: n=107]. 7/12 (58%, IL4R mutant) and 16/107 (15%, IL4R WT) cases were found to have a 5q31.1 amplification when considering a z-score of 1.96 as threshold. The corresponding two-sided Fisher’s exact test p-value is provided. Panels B-F: mean +/− standard error (se).
Figure 5:
Figure 5:. Pretreatment ctDNA levels and ctDNA minimal residual disease to prognosticate cHL.
Previously untreated, adult cHL patients were considered for associations between pretreatment ctDNA levels and clinical variables in panels A-C (n=309). (A) Scatter plot and Spearman rho and p-value (algorithm AS 89) correlating TMTV and pretreatment ctDNA levels (n=241). (B) Kaplan-Meier curves showing PFS stratified by pretreatment ctDNA levels binarized using a previously defined threshold in DLBCL (2.5 log10 hGe/mL). Numbers at risk and logrank p-value are provided. (C) Forest plot summarizing hazard ratios (HR) and 95%-confidence interval (CI) derived from multivariable Cox regression including ctDNA and disease stage as a categorical variable (early favorable, early unfavorable, and advanced). Early favorable stage (n=14, no event) were omitted from visualization. Patients with at least one profiled on-treatment sample were evaluated for MRD assessment in panels D-I (n=109). (D) Stacked bar plot visualizing the fraction of evaluable cases with detectable ctDNA by PhasED-seq at various milestones. CxDy, cycle x day y. (E) Line plot summarizing median ctDNA levels and the interquartile range along the course of treatment. * P<0.05; ** P<0.01; *** P<0.001 (Wilcoxon test, two-sided; C1D1: P=0.03, C1D15: P=0.005, C3D1: P=0.007, ≥4 cycles: P=2.0e-5). (F) Waterfall plot showing log10 ctDNA changes from baseline at C3D1. Bars are colored by PFS event status with PET2 readings according to 5-point scale (5PS Deauville) as top annotation. (G-H) Kaplan-Meier curves showing PFS stratified by ctDNA detection at (G) C1D15 and at (H) C3D1. Logrank p-values are provided. (I) Stacked bar plot summarizing the fraction of evaluable cases with detectable/undetectable ctDNA by PET2 status. PET2 positive cases (5PS 4–5,X) are plotted on the right, PET2 negative cases (5PS 1–3) on the left. * P<0.05 (two-sided Fisher’s exact test; P=0.048 at C3D1). 2/109 patients with missing PET2 status were excluded.

References

    1. Sobesky S et al. In-depth cell-free DNA sequencing reveals genomic landscape of Hodgkin’s lymphoma and facilitates ultrasensitive residual disease detection. Med (N Y) 2, 1171–1193 e1111 (2021). 10.1016/j.medj.2021.09.002 - DOI - PubMed
    1. Spina V et al. Circulating tumor DNA reveals genetics, clonal evolution, and residual disease in classical Hodgkin lymphoma. Blood 131, 2413–2425 (2018). 10.1182/blood-2017-11-812073 - DOI - PubMed
    1. Desch AK et al. Genotyping circulating tumor DNA of pediatric Hodgkin lymphoma. Leukemia 34, 151–166 (2020). 10.1038/s41375-019-0541-6 - DOI - PubMed
    1. Vandenberghe P et al. Non-invasive detection of genomic imbalances in Hodgkin/Reed-Sternberg cells in early and advanced stage Hodgkin’s lymphoma by sequencing of circulating cell-free DNA: a technical proof-of-principle study. The Lancet Haematology 2, e55–e65 (2015). 10.1016/s2352-3026(14)00039-8 - DOI - PubMed
    1. Kurtz DM et al. Enhanced detection of minimal residual disease by targeted sequencing of phased variants in circulating tumor DNA. Nat Biotechnol 39, 1537–1547 (2021). 10.1038/s41587-021-00981-w - DOI - PMC - PubMed