. 2023 Dec 11;14(1):8179.
doi: 10.1038/s41467-023-43954-0.

Interactions between climate change, urban infrastructure and mobility are driving dengue emergence in Vietnam

Affiliations

Interactions between climate change, urban infrastructure and mobility are driving dengue emergence in Vietnam

Rory Gibb et al. Nat Commun. .

Abstract

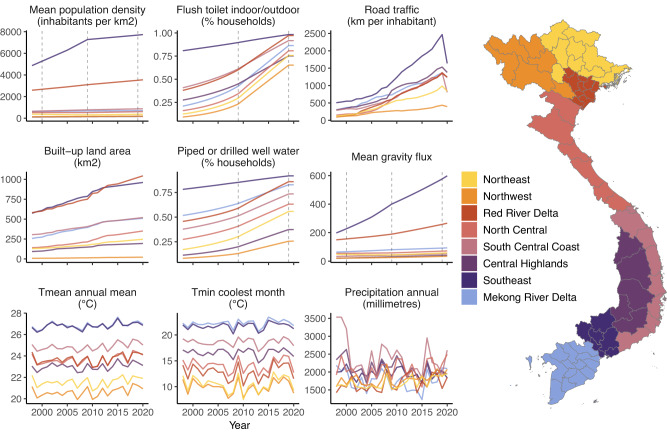
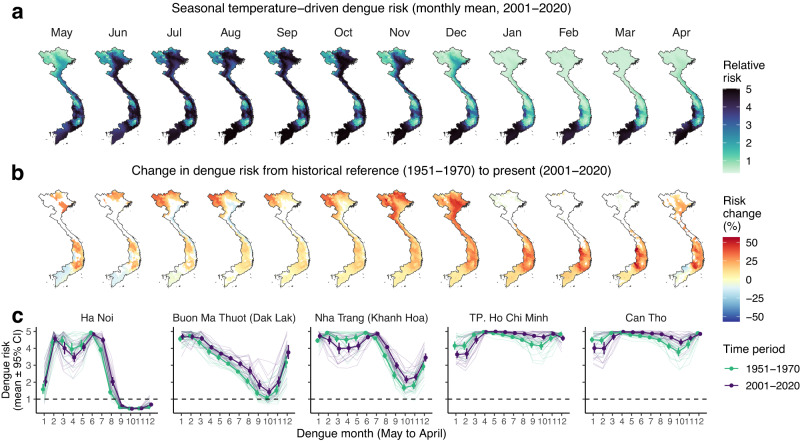
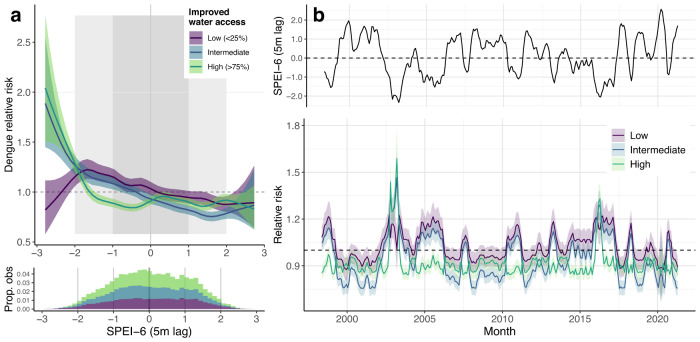
Dengue is expanding globally, but how dengue emergence is shaped locally by interactions between climatic and socio-environmental factors is not well understood. Here, we investigate the drivers of dengue incidence and emergence in Vietnam, through analysing 23 years of district-level case data spanning a period of significant socioeconomic change (1998-2020). We show that urban infrastructure factors (sanitation, water supply, long-term urban growth) predict local spatial patterns of dengue incidence, while human mobility is a more influential driver in subtropical northern regions than the endemic south. Temperature is the dominant factor shaping dengue's distribution and dynamics, and using long-term reanalysis temperature data we show that warming since 1950 has expanded transmission risk throughout Vietnam, and most strongly in current dengue emergence hotspots (e.g., southern central regions, Ha Noi). In contrast, effects of hydrometeorology are complex, multi-scalar and dependent on local context: risk increases under either short-term precipitation excess or long-term drought, but improvements in water supply mitigate drought-associated risks except under extreme conditions. Our findings challenge the assumption that dengue is an urban disease, instead suggesting that incidence peaks in transitional landscapes with intermediate infrastructure provision, and provide evidence that interactions between recent climate change and mobility are contributing to dengue's expansion throughout Vietnam.


Conflict of interest statement

The authors declare no competing interests.

Figures

Fig. 1
Fig. 1. Geographical distribution and trends in dengue incidence at district-level in Vietnam.
a Mean annual dengue incidence rates across all dengue years (May to April) within each 5–6 year time period between 1998 and 2020 (cases per 100,000 persons, log+1 transformed for visualisation purposes) for districts with dengue time series available (n = 667). Surveillance time series commenced between 1998 and 2001 depending on the region (see Methods). b Estimated slopes of annual dengue incidence rates between the earliest year of surveillance and 2020 (% change per year) are shown for districts with strong evidence (p < 0.01) of increasing (red) or decreasing (blue) trends, with Vietnam’s 5 major urban municipalities labelled. Slopes were inferred using ordinary least squares regression without adjustment for multiple comparisons (as districts were not spatially independent from each other and the principal purpose was visualisation). The latitudinal gradient in seasonal dynamics is shown in Supp. Fig. 1.
Fig. 2
Fig. 2. Socio-environmental change and climatic variability in Vietnam from 1998 to 2020.
Sub-plots show annual socio-environmental and climatic covariate data (Table 1), aggregated from district- to region-level for the visualisation (region denoted by line and map fill colour; population density, gravity flux, temperature and precipitation are summarised as the mean across all districts). For census-based metrics (population, infrastructure, and gravity models) annual estimates were obtained via district-level interpolation or back/forward projection from observed years, which are shown as dotted lines (Methods, Supp. Text 1). For all other metrics, data were available for all years. Urbanisation, population density and mobility are highest in the subregions with the two largest municipalities: Ha Noi (Red River Delta) and Ho Chi Minh City (Southeast).
Fig. 3
Fig. 3. Effects of socio-environmental and climatic drivers on district-level dengue incidence.
Sub-panels show posterior marginal linear fixed effects (a, b) and nonlinear effects (cg) from the full-fitted model of district-level dengue incidence (n = 667 districts, 174,936 observations; Methods). Linear fixed effects are shown as risk ratios for scaled or log-transformed covariates (i.e., proportion change in risk for a 1 unit change in covariate), with points and error-bars showing posterior marginal mean and 95% credible interval. Nonlinear marginal effects (specified as second-order random walks; Methods) are shown on the relative risk scale, with lines and ribbons showing posterior mean and 95% credible interval. Point or ribbon colour denotes broad covariate class: either socio-environmental (green) or climatic (blue).
Fig. 4
Fig. 4. Influence of individual socio-environmental and climatic factors on spatiotemporal and seasonal predictions of dengue incidence.
Influence of individual covariates on out-of-sample mean absolute error (MAE) was evaluated using 5-fold cross-validation under 3 block holdout designs: spatial (entire districts; panel a), spatiotemporal (district-year combinations; b and seasonal (quarterly blocks within each district; c (Methods, Supp. Fig. 8). Candidate models excluding one covariate at a time from the full model are shown on the y-axis, with the baseline (random effects-only) model for comparison. Individual points show change in MAE relative to the full model (dashed line), across 10 repeats account for variability due to random reallocation of cross-validation folds. Point colour denotes broad covariate class: socio-environmental (green), climatic (blue) or baseline model (grey). Black points and error-bars summarise the mean and 95% confidence interval across all 10 repeats. Values above zero indicate an increase in prediction error relative to the full model when a covariate is excluded (i.e., positive influence on prediction accuracy), and vice versa.
Fig. 5
Fig. 5. Recent climate change has expanded and redistributed dengue transmission risk across Vietnam.
The full model was used to predict monthly marginal temperature-driven risk since 1950 using ERA5-Land reanalysis data (i.e., holding all other variables constant). Top maps a show present-day monthly 20-year means of dengue relative risk (2001–2020), with darker colours denoting increased risk. Bottom maps b show the monthly percentage difference in 20-year average dengue risk between historical reference (1951–1970) and present-day (red shading denotes increasing risk and blue decreasing risk). Only statistically significant differences (p < 0.05) are shown, with non-significant differences shaded white. Differences were estimated using categorical regression without adjustment for multiple comparisons (as districts were not spatially independent from each other and the principal purpose was visualisation). Graphs c show long-term changes in seasonal risk by dengue month (May to April) for 5 example cities with high dengue burden (Ha Noi in north; Buon Ma Thuot in the central highlands; Nha Trang on the south central coast; and Ho Chi Minh and Can Tho in the south). Fine lines show individual years, and points and error-bars show monthly 20-year mean and standard error (n = 20), with lines coloured by time period (green for reference period; purple for present-day). The supplementary material shows more district examples (Supp. Fig. 13) as well as changes in temperature patterns for these 5 localities (Supp. Fig. 14). Results were very similar when defining a later reference period (1971–1990; Supp. Fig. 15).
Fig. 6
Fig. 6. Improved water supply modifies the effect of long-term drought (SPEI-6) on dengue incidence in southern Vietnam.
The fitted interaction between SPEI-6 (5-month lag) and piped or borehole-derived water access is shown in a (low = <25% of households; medium = 25–75%, high = >75%), with lines and shaded area showing posterior marginal mean and 95% credible interval. Histogram shows the distribution of observations across the 3 strata (bar height is cumulative across 3 strata). Visualisation of the marginal effect of SPEI-6 on relative risk is shown in b, for an example time series of SPEI-6 from the Mekong River Delta region (top row; Dong Thap province), under scenarios of low, intermediate and high improved water access (bottom row). Lines and ribbons show posterior marginal mean effect and 95% credible interval. Accounting for this interaction reduces predictive error under both spatiotemporal and seasonal cross-validation (Supp. Figs. 16 and 17).

References

    1. Romanello M, et al. The 2021 report of the Lancet Countdown on health and climate change: code red for a healthy future. Lancet. 2021;398:1619–1662. doi: 10.1016/S0140-6736(21)01787-6. - DOI - PMC - PubMed
    1. Mora C, et al. Over half of known human pathogenic diseases can be aggravated by climate change. Nat. Clim. Chang. 2022;12:869–875. doi: 10.1038/s41558-022-01426-1. - DOI - PMC - PubMed
    1. Baker RE, et al. Infectious disease in an era of global change. Nat. Rev. Microbiol. 2022;20:193–205. doi: 10.1038/s41579-021-00639-z. - DOI - PMC - PubMed
    1. Wilder-Smith A, et al. Epidemic arboviral diseases: priorities for research and public health. Lancet Infect. Dis. 2017;17:e101–e106. doi: 10.1016/S1473-3099(16)30518-7. - DOI - PubMed
    1. Brady OJ, Hay SI. The global expansion of dengue: how Aedes aegypti mosquitoes enabled the first pandemic arbovirus. Annu. Rev. Entomol. 2020;65:191–208. doi: 10.1146/annurev-ento-011019-024918. - DOI - PubMed

Publication types