. 2023 Dec 11;14(1):7830.
doi: 10.1038/s41467-023-43475-w.

Epilepsy-linked kinase CDKL5 phosphorylates voltage-gated calcium channel Cav2.3, altering inactivation kinetics and neuronal excitability

Affiliations

Epilepsy-linked kinase CDKL5 phosphorylates voltage-gated calcium channel Cav2.3, altering inactivation kinetics and neuronal excitability

Marisol Sampedro-Castañeda et al. Nat Commun. .

Abstract

Developmental and epileptic encephalopathies (DEEs) are a group of rare childhood disorders characterized by severe epilepsy and cognitive deficits. Numerous DEE genes have been discovered thanks to advances in genomic diagnosis, yet putative molecular links between these disorders are unknown. CDKL5 deficiency disorder (CDD, DEE2), one of the most common genetic epilepsies, is caused by loss-of-function mutations in the brain-enriched kinase CDKL5. To elucidate CDKL5 function, we looked for CDKL5 substrates using a SILAC-based phosphoproteomic screen. We identified the voltage-gated Ca2+ channel Cav2.3 (encoded by CACNA1E) as a physiological target of CDKL5 in mice and humans. Recombinant channel electrophysiology and interdisciplinary characterization of Cav2.3 phosphomutant mice revealed that loss of Cav2.3 phosphorylation leads to channel gain-of-function via slower inactivation and enhanced cholinergic stimulation, resulting in increased neuronal excitability. Our results thus show that CDD is partly a channelopathy. The properties of unphosphorylated Cav2.3 closely resemble those described for CACNA1E gain-of-function mutations causing DEE69, a disorder sharing clinical features with CDD. We show that these two single-gene diseases are mechanistically related and could be ameliorated with Cav2.3 inhibitors.


Conflict of interest statement

The authors declare no competing interests.

Figures

Fig. 1
Fig. 1. Identification and validation of Cav2.3 as substrate of CDKL5 kinase.
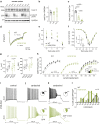
a Volcano plot of differential phosphoprotein levels between WT and Cdkl5 KO primary neurons, obtained using SILAC based quantitative proteomics (3 embryos/genotype). Each point represents one peptide; those with CDKL5 consensus motif RPXS/T are highlighted in magenta. The x axis shows log2 transformed fold change in phosphopeptide levels between genotypes and the y axis shows significance as -log10 transformed p value (one sample t test). Significance was established as indicated by the dotted lines (p < 0.01, fold change 1.5, one sample t test). b Top: Schematic depiction of Cav2.3 formed of α1E channel pore subunit and associated proteins Cavβ and α2δ. CDKL5 phosphorylation site at α1E S15/14 is highlighted in green. Bottom: Alignment of proximal N-terminus of mouse and human Cav2.3 and related human Cav2.1 and 2.2 channel proteins. *S is the site of CDKL5 phosphorylation. c Western blot of HEK293 cells stably expressing human β3/α2δ1 subunits and transiently co-transfected with human HA-α1E (Cav2.3: WT or S14A mutant) and HA-CDKL5 kinase domain (kd CDKL5: WT or K42A mutant). S14 phosphorylation (pS14 Cav2.3) was detected with a custom made phosphoantibody. Example blots derive from two gels run and processed in parallel. d Western blot of P20 cortices from WT and Cdkl5 KO mice. Example blots derive from three gels: phospho and total Cav were run and processed in parallel; control α-tubulin was obtained from a separate experiment using the same samples and loading volume. e Western blot of iPSC-derived forebrain neurons from three CDD patients and related controls (parents) at 6 weeks of differentiation. Gender and CDKL5 mutation are specified. Example blots derive from two gels run and processed in parallel. f Quantification for immunoblot in (c) (p < 0.0001 and p = 0.0006, Kruskal-Wallis ANOVA & Dunn’s test, n = 11 for each condition: 5 transfections, 2–3 technical replicates). g Quantification for immunoblot in (d) (total Cav: p = 0.25, n = 23, 6 blots, 6 mice/genotype; pCav: p < 0.0001, two tailed unpaired t test, n = 9, 3 blots, 6 mice/genotype; no technical replicates). h Quantification for WB in (e) (p = 0.0051, two tailed paired t test, n = 6, 3 control/patient pairs, 4 technical replicates). For antibodies used see Methods. Data is presented as mean ± S.E.M. All source data is provided in a Source Data File.
Fig. 2
Fig. 2. Functional characterization of phospho-Ser14 Cav2.3 in HEK 293 cells.
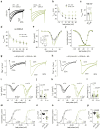
a Depolarization-evoked current responses in HEK293 cells stably expressing human β3/α2δ1 subunits and co-transfected with human Cav2.3 (WT α1E or S14A α1E) and FLAG-CDKL5 full length (WT CDKL5). Colours denote different construct combinations. Traces show steps from −10 to +30 mV from −80 mV; Ba2+ was charge carrier (b) Open channel inactivation tau (τinact) for Cav2.3 with (WT/WT, n = 13–15 recordings from −10 to +40) and without (S14A/WT, n = 11–13 recordings from −10 to +40) CDKL5 phosphorylation (*p = 0.02, 0.03 & 0.01 at +10, +20 & +40 mV Two-Way ANOVA, Fisher’s LSD). Some voltage steps were excluded as described in Methods. Data were acquired using 100 ms voltage steps from −80 mV in +10 mV increments every 10 s. c Individual data points for τinact at +20 mV (WT/WT n = 14, S14A/WT n = 11; two-tailed unpaired t test). d WT or phophomutant S14A Cav2.3 inactivation in the same cell line in absence of CDKL5 (both conditions n = 7–9; p > 0.05 Two-Way ANOVA); Ca2+ was charge carrier. e Current voltage relationship for cells in (b). Inset: comparison of current density at 0 mV (inset, two-tailed unpaired t test). f Normalised Cav2.3 current conductance and voltage dependence of inactivation for the same transfection conditions. Activation V1/2, n: WT/WT −6 ± 1 mV, 15; S14A/WT −6 ± 1 mV,12; Inactivation V1/2, n: WT/WT −61 ± 3 mV,10; S14A/WT −62 ± 2 mV,11 (p > 0.05, two tailed unpaired t tests). For inactivation protocol see Methods. Solid lines are Boltzman fits to the average data points (g) Normalised Ba2+ currents in the β3/α2δ1-cell line or (h) Ca2+ currents in the β1/α2δ1-cell line, co-transfected with α1E (WT or S14A), WT CDKL5 and muscarinic type 3 receptor (M3), in presence and absence of carbachol (CCh) 30 and 10 μM, respectively. HP = −100 mV. i IV curves and (j) CCh-induced change in current amplitude for experiment in (g) (pS14 n = 10, no pS14 n = 5, Two-Way ANOVA, Fisher’s LSD). k IV curves and (l) CCh-induced change in current amplitude for experiment in (h) (pS14 n = 7, no pS14 n = 16, Two-Way ANOVA, Fisher’s LSD). m Conductance plots for experiment in (g) and n Corresponding change in activation (V1/2: −5 ± 0.6 mV (n = 10) vs. −10 ± 1.9 mV (n = 5), two-tailed Kolmogorov-Smirnov). o Conductance plots for experiment in (h) and p corresponding change in activation (V1/2: −4 ± 0.5 mV (n = 7) vs −9 ± 1 mV (n = 16), two-tailed Welch’s t test). From (lp), ‘pS14’ refers to WT α1E/WT CDKL5; ‘no pS14’ refers to S14A α1E /WT CDKL5 and α1E WT/K42R* CDKL5 conditions pulled together. Data is presented as mean ± S.E.M or in box plots representing minimum, maximum, median, 25/75 percentile and mean (indicated by a marker). Source data are provided as a Source Data file.
Fig. 3
Fig. 3. Physiological properties and cholinergic neuromodulation of hippocampal CA1 neurons from WT and phosphomutant mice.
a WB validation of CRISPR-generated Cav2.3 Ser15Ala mutant mice using a pS15 phosphoantibody in cortical lysates from 5–6-week-old WT, Heterozygous S15A and Homozygous S15A mice. Example blots derive from two gels run and processed in parallel. b Quantification of total Cav2.3 (p > 0.05 One-Way ANOVA) and c Relative phospho-S15 Cav2.3 expression (One-Way ANOVA, Fisher’s LSD; n = 9, 3 mice/genotype, 3 technical replicates). d Normalised R-type Ca2+ current in neurons from young mice of each genotype during a step from −60 to 0 mV in presence of Na+, K+, Ca2+ and synaptic channel inhibitors. e R-type current inactivation tau (τinact) at maximal activation voltages (*p = 0.01 Two-Way Repeated Measures ANOVA, Fisher’s LSD) and f Average IV curve for all cells recorded (p > 0.05), (n = 13 neurons for both genotypes, 4–5 mice/genotype). Data for −10 mV step is shown in the inset (p = 0.06, two-tailed unpaired t test). g Membrane resting potential (Vrest, left) and input resistance (Rinput, right) of adult neurons (Vrest: WT = 14, HOM S15A n = 20; Rinput: WT n = 13, HOM S15A n = 17; 7 mice/genotype) in control conditions and after 10 μM carbachol (CCh) application (two-tailed paired t test). h Input/output curves for the same neurons (WT n = 9, HOM n = 13, *p < 0.028 Two-Way Repeated Measures ANOVA) and percentage of cells with CCh-induced depolarization block (inset, WT n = 13, HOM n = 21, two-tailed binomial test). i Representative control action potential trains evoked in WT (top) and HOM S15A (bottom) CA1 cells by 1s-long current injections. Membrane was held at −65 mV. j Same cells as (i) upon application of CCh and representative depolarising plateau potential (DPP), observed at some current injections in both genotypes; insets: fraction of cells with at least one DPP in each genotype group (WT n = 13, HOM n = 21, p > 0.05, two-tailed binomial test). k Same cells as (j) at higher stimulation illustrating sustained depolarization and AP block (top) or attenuation (bottom) towards the end of the stimulus and long-lasting large amplitude afterdepolarizations (ADP). Like DPPs, these ADPs were present at some current injections in a fraction of cells in both groups of mice (inset, WT n = 13, HOM n = 21, **p < 0.004, two-tailed binomial test). l Percentage of cells displaying sustained DPPs or ADPs upon stimulus termination at each current injection step. Non-linear fits (least squares regression) were compared using the extra sum-of-squares F test (p = 0.04 indicates the data cannot be adequately fit with a single Gaussian). Data is presented as mean ± S.E.M or in box plots representing minimum, maximum, median, 25/75 percentile and mean is indicated by a marker. Source data are provided as a Source Data file.
Fig. 4
Fig. 4. Behavioural characterization of Cav2.3 S15A mice.
a Overall home cage night-time locomotion index of WT and HOM S15A mice over a three-week period (males WT n = 5, HOM n = 4; females WT n = 4, HOM n = 5; Two-Way ANOVA, Sidak’s; sex x genotype p < 0.0001). b Accelerating rotarod performance for a separate cohort (p > 0.05, Two-Way ANOVA, Tukey’s). Animal weights were equal: WT vs HOM [grams (n)], males 28.5 (6) vs 29.3 (5), females 21.8 (8) vs 21.3 (6); p = 0.8 & p = 0.4, respectively, two-tailed unpaired t test. c Quantification of the social, non-social and total exploration times during a 10 min three-chamber sociability test in 2-phases for the same cohort as (b) (Two-Way ANOVA, Sidak’s); social novelty test: sex x genotype p = 0.04, Three-Way ANOVA. In habituation trials, chamber occupancy was equal between groups. d Left: acquisition phase of the Barnes maze test with improved performance for both groups in the first 4 training days (same cohort as (b), p > 0.05, Two-Way ANOVA, Sidak’s); right: memory assessment on probe day 5 (Two-Way ANOVA, Tukey’s); sex x genotype p = 0.01, Three-Way ANOVA. e Freezing behaviour during learning day 1 (left), associative memory test day 2 + 3 (middle) and memory extinction test days 4–7 (right), in a fear-conditioning experiment with tactile and olfactory cues; Same cohort as (b): Day 1: males US1 p = 0.08, females US1 p = 0.06, US2 p = 0.08, Two-Way ANOVA, Tukey’s; sex p = 0.03, genotype p = 0.009, Three-Way ANOVA. Day 2 + 3: Two-Way ANOVA, Fisher’s LSD; for day 2 genotype p = 0.005 Three-Way ANOVA. Day 4–7: day x genotype p = 0.04 Three-Way ANOVA. f Grouped data for both sexes in the fear conditioning test. Same cohort as (b): Day 1: genotype x US p = 0.04 Two-Way ANOVA, Sidak’s. Day 2 + 3: two tailed t-tests. Day 4–7: genotype x day p = 0.0006 Two-Way ANOVA, Sidak’s. Data is presented as mean ± S.E.M or in box plots representing minimum, maximum, median, 25/75 percentile and mean (indicated by a marker). Source data are provided as a Source Data file.
Fig. 5
Fig. 5. Electrocorticogram features and seizure propensity in Cav2.3 phosphomutant mice.
a left: two-week baseline ECoG spectral analysis and total power (inset) in WT (n = 8) and HOMS15A (n = 10) 9–12 week-old mice; corresponding coastline index (middle) and kurtosis (right) (p > 0.05, Two-Way ANOVA and two-tailed unpaired t tests). No sex differences were observed. b left: behavioural scoring of kainic acid (KA)-induced seizures (WT males n = 3, females n = 4; HOMS15A males n = 4, females n = 6; sex x genotype p = 0.006, Three-Way ANOVA) using repetitive 5 mg/kg i.p. injections (inset); right: latency to stage 5 tonic clonic seizures per gender (two-tailed unpaired t test). c Corresponding cumulative ECoG coastline during KA seizures in females (WT n = 3, HOM S15A n = 4, time x genotype p = 0.018, Two-Way ANOVA). Data is presented as mean ± S.E.M or in box plots representing minimum, maximum, median, 25/75 percentile and mean (indicated by a marker). Source data are provided as a Source Data file.

Comment in

References

    1. Guerrini R, et al. Developmental and epileptic encephalopathies: from genetic heterogeneity to phenotypic continuum. Physiol. Rev. 2023;103:433–513. doi: 10.1152/physrev.00063.2021. - DOI - PMC - PubMed
    1. Kalscheuer VM, et al. Disruption of the serine/threonine kinase 9 gene causes severe X-linked infantile spasms and mental retardation. Am. J. Hum. Genet. 2003;72:1401–1411. doi: 10.1086/375538. - DOI - PMC - PubMed
    1. Olson HE, et al. Cyclin-dependent kinase-like 5 deficiency disorder: clinical review. Pediatr. Neurol. 2019;97:18–25. doi: 10.1016/j.pediatrneurol.2019.02.015. - DOI - PMC - PubMed
    1. Van Bergen NJ, et al. CDKL5 deficiency disorder: molecular insights and mechanisms of pathogenicity to fast-track therapeutic development. Biochem. Soc. Trans. 2022;50:1207–1224. doi: 10.1042/BST20220791. - DOI - PMC - PubMed
    1. Leonard H, et al. CDKL5 deficiency disorder: clinical features, diagnosis, and management. Lancet Neurol. 2022;21:563–576. doi: 10.1016/S1474-4422(22)00035-7. - DOI - PMC - PubMed

Publication types

Supplementary concepts