. 2023 Dec 11;14(1):8204.
doi: 10.1038/s41467-023-43654-9.

Conformational plasticity of RAS Q61 family of neoepitopes results in distinct features for targeted recognition

Affiliations

Conformational plasticity of RAS Q61 family of neoepitopes results in distinct features for targeted recognition

Andrew C McShan et al. Nat Commun. .

Abstract

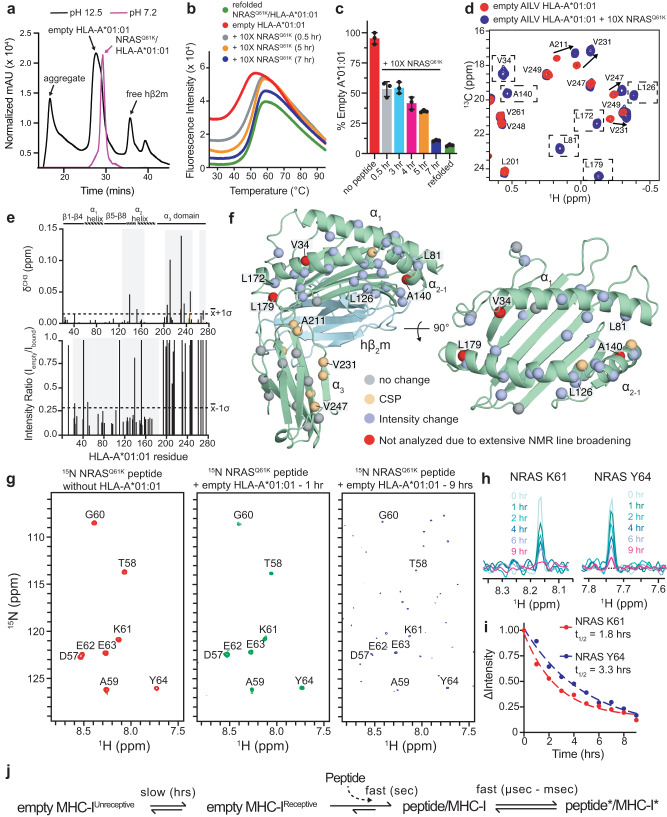
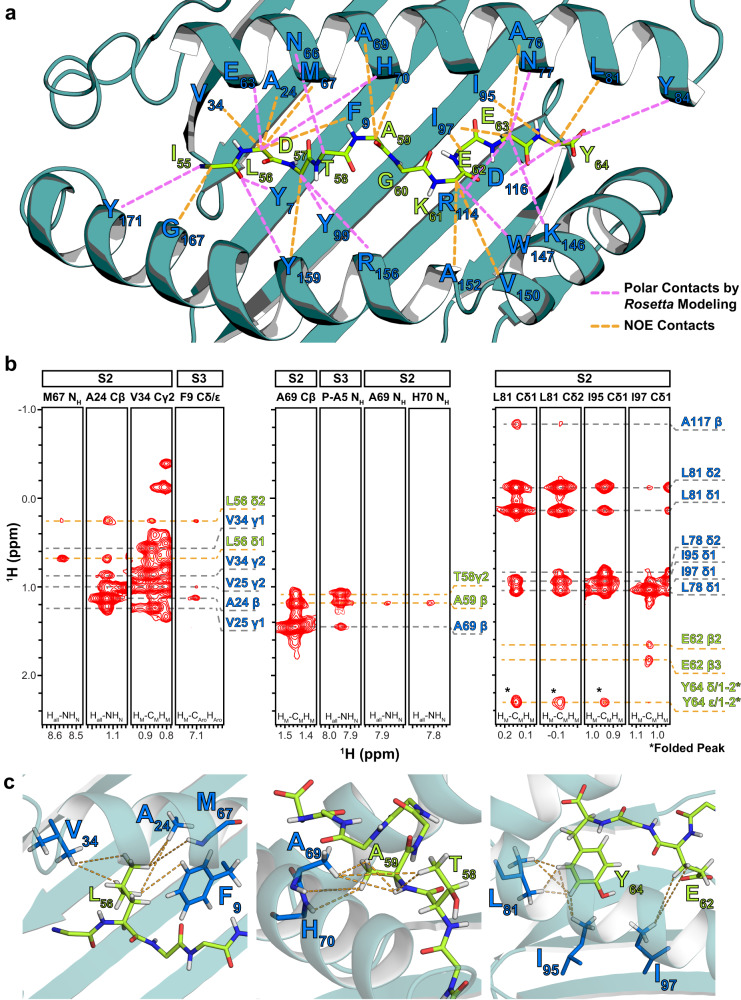
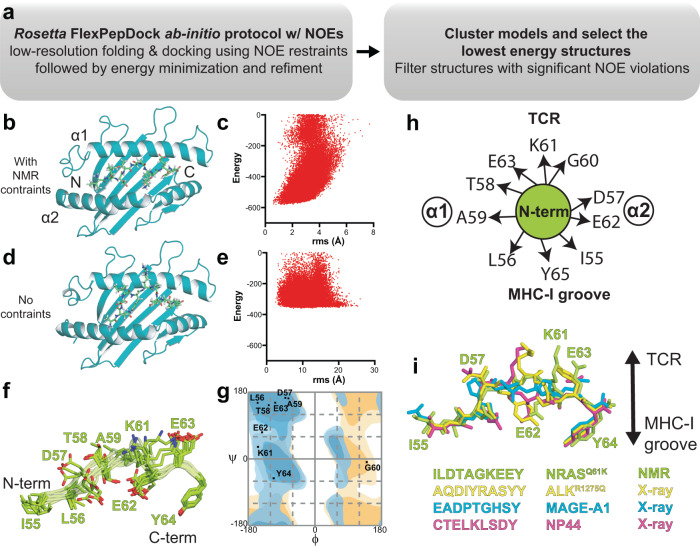
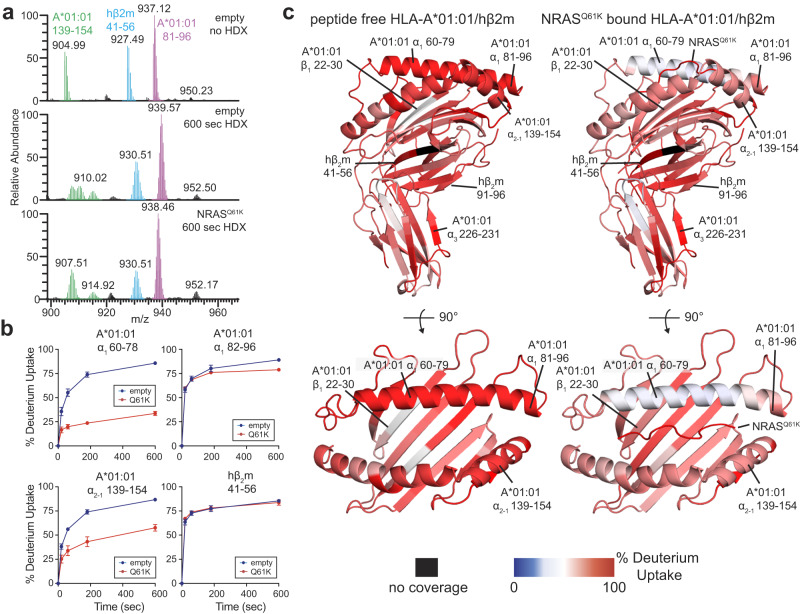
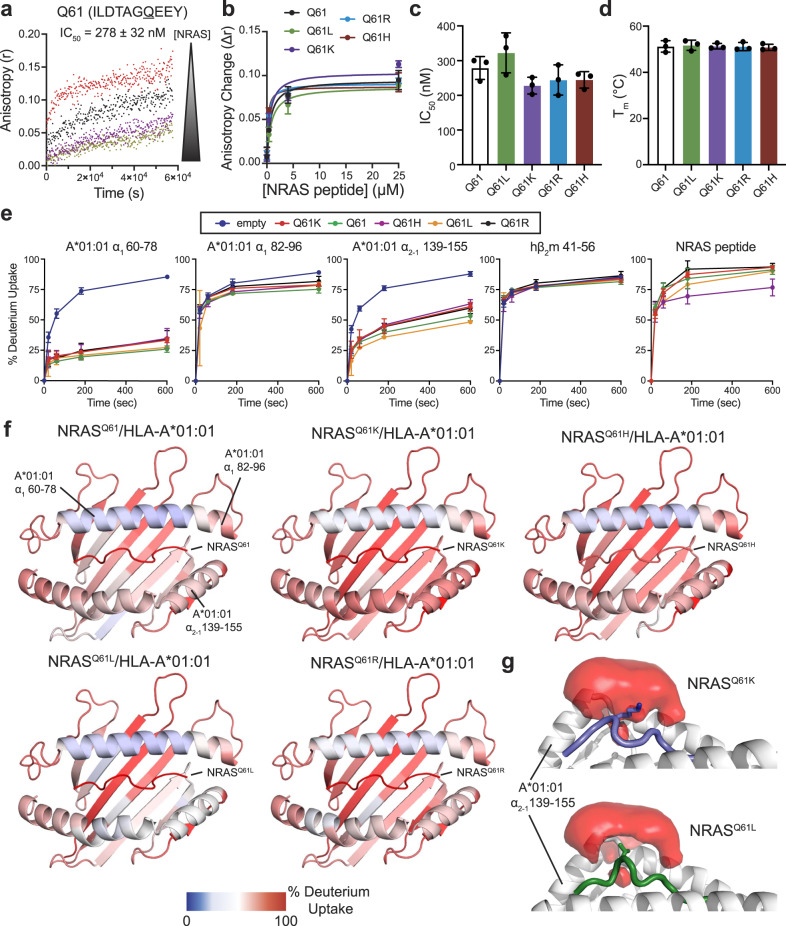
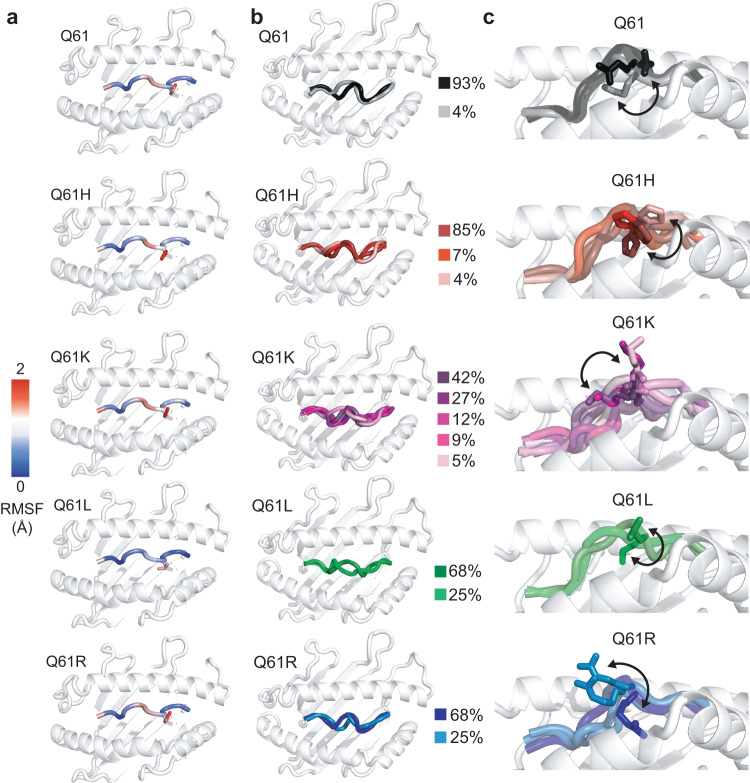
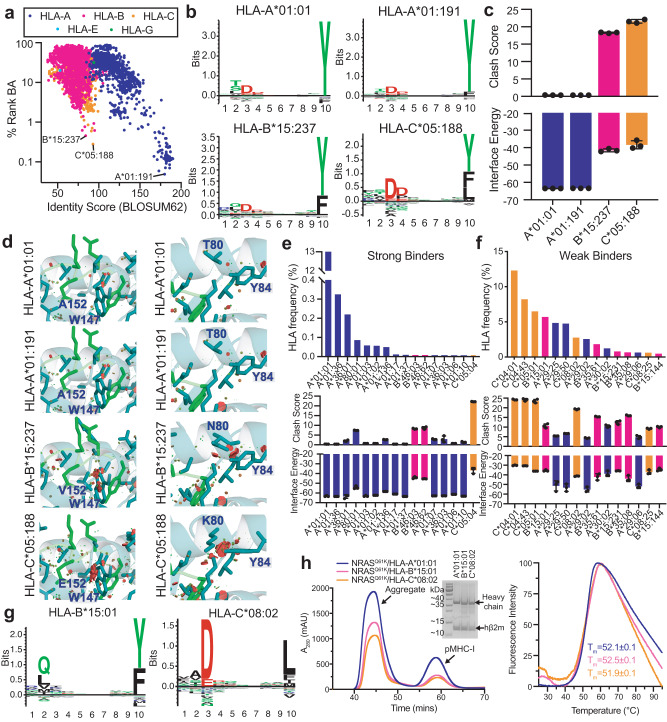
The conformational landscapes of peptide/human leucocyte antigen (pHLA) protein complexes encompassing tumor neoantigens provide a rationale for target selection towards autologous T cell, vaccine, and antibody-based therapeutic modalities. Here, using complementary biophysical and computational methods, we characterize recurrent RAS55-64 Q61 neoepitopes presented by the common HLA-A*01:01 allotype. We integrate sparse NMR restraints with Rosetta docking to determine the solution structure of NRASQ61K/HLA-A*01:01, which enables modeling of other common RAS55-64 neoepitopes. Hydrogen/deuterium exchange mass spectrometry experiments alongside molecular dynamics simulations reveal differences in solvent accessibility and conformational plasticity across a panel of common Q61 neoepitopes that are relevant for recognition by immunoreceptors. Finally, we predict binding and provide structural models of NRASQ61K antigens spanning the entire HLA allelic landscape, together with in vitro validation for HLA-A*01:191, HLA-B*15:01, and HLA-C*08:02. Our work provides a basis to delineate the solution surface features and immunogenicity of clinically relevant neoepitope/HLA targets for cancer therapy.


Conflict of interest statement

The authors declare no competing interests.

Figures

Fig. 1
Fig. 1. Conformational changes and assembly kinetics for NRASQ61K association with empty HLA-A*01:01/hβ2m.
a SEC traces of HLA-A*01:01/hβ2m following short exposure to neutral (magenta) or basic (black) phosphate buffer. b DSF of 7 μM HLA-A*01:01/hβ2m following short exposure to pH 12.5 phosphate buffer. Red curve – no peptide added. 10× excess NRASQ61K peptide was added and incubated for 0.5 (gray), 5 (orange), and 7 (blue) hrs. Green curve – refolded NRASQ61K/HLA-A*01:01/hβ2m control. c Percent empty HLA-A*01:01 determined by DSF upon incubating empty HLA-A*01:01 without or with 10× excess NRASQ61K peptide for the indicated amount of time. Refolded complex is shown for reference. Data are mean ± SD for n = 3 technical replicates. d 2D 1H-13C methyl HMQC spectra of 50 μM AILV labeled HLA-A*01:01 refolded with natural abundance hβ2m following exposure to pH 12.5 phosphate buffer (red – no peptide; blue – 10× excess NRASQ61K peptide added) recorded at 25 °C at a 1H field of 800 MHz. Dotted boxes represent methyl resonances exhibiting line broadening in the empty state. e Chemical shift perturbations (CSP, δCH3, ppm) (top) and intensity ratios (Iempty/Ibound) (bottom) for AILV methyl probes of HLA-A*01:01 with 10× excess NRASQ61K (Ibound) relative empty HLA-A*01:01 (Iempty). Dotted lines represent the average plus one standard deviation for CSP analysis or minus one standard deviation for intensity ratio analysis. Gray boxes highlighted affected regions. The protein domains of HLA-A*01:01 are shown for reference. f Mapping of HLA-A*01:01 methyl residues with resonances exhibiting either CSP or intensity changes upon binding to NRASQ61K onto the X-ray structure of HLA-A*01:01 (PDB ID 6AT9, peptide atoms removed). g 2D 1H-15N HMQC spectra of 15N labeled NRASQ61K without (red) or with empty unlabeled HLA-A*01:01/hβ2m after 1 h (green) or 9 h (blue) of incubation recorded at a 1H field of 800 MHz at 25 °C. h 1D 1H spectral slices for the amide of K61 and Y64 of 15N labeled NRASQ61K throughout incubation in panel (g). i The change in NMR signal intensity (ΔIntensity) as a function of incubation time and fitted half-life (t1/2) values for K61 and Y64. j Schematic of the timescale for different conformational changes in the MHC-I complex.
Fig. 2
Fig. 2. Intermolecular NOE contacts observed between the HLA-A*01:01 groove and NRASQ61K.
a Intermolecular NOEs observed between HLA-A*01:01 residues and NRASQ61K residues (dotted orange lines) in 3D SOFAST NOESY experiments are shown with HLA-A*01:01 groove (dark green) and peptide residues (green) labeled. Intermolecular polar contacts not observed experimentally, but observed in the final structure following high-resolution refinement using the Rosetta FlexPepDock ab-initio protocol are also shown (dotted purple lines). b Representative 1HM-1HM NOESY strips corresponding to intra- (gray dotted lines) and inter-molecular (orange dotted lines) NOE contacts, shown for regions spanning the HLA-A*01:01 groove (A/B pocket – left, B/C pocket – center, and E/F pocket – right). The top of the strip is labeled with the name of the sample used (S2 or S3) and the residue/atom name corresponding to the strip. The bottom of the strip is labeled with the NMR experiment where the NOE strip was obtained. Atoms corresponding to HLA-A*01:01 are labeled blue, while atoms corresponding to NRASQ61K are labeled green. NOE cross-peaks that are folded due to sweep width restrictions are indicated with an asterisk (*). c View of intermolecular NOE contacts (dotted lines) observed in panel B with HLA-A*01:01 (dark green) and peptide (light green) side chains shown as sticks. Our final refined structure of the complex (PDB ID 6MPP) was used to generate structure views.
Fig. 3
Fig. 3. Molecular surface features of the NRASQ61K/HLA-A*01:01 groove for TCR recognition.
a Flow chart of the combined NMR and Rosetta FlexPepDock ab-initio protocol. b, d The Rosetta FlexPepDock ab-initio protocol was performed b with and d without NMR restraints. The HLA-A*01:01 groove is shown in dark green and NRASQ61K is shown in light green. The peptide cannot properly dock into the HLA-A*01:01 groove without NMR restraints due to geometric restrictions imposed by the MHC-I pockets. c, e Energy landscape plots showing energy (Rosetta energy units) versus backbone heavy atom root mean squared deviation (r.m.s., Å) to the lowest energy structure are shown for 50,000 models of FlexPepDock ab-initio protocol performed with c NOE-derived NMR constraints (Supplementary Table 2) and e without NMR constraints. f Overlay of the ten lowest energy NRASQ61K conformations in complex with HLA-A*01:01/β2m (not shown for clarity). g Ramachandran plot showing the φ/ψ angles of each residue of NRASQ61K peptide bound to HLA-A*01:01. The φ/ψ were computed on the peptide in the lowest energy structure HLA-A*01:01 bound NRASQ61K structure using the RAMPAGE server. Blue – general amino acid favored/allowed. Orange – glycine favored/allowed. h Cartoon schematic of the side chain orientation of the NRASQ61K (bound to HLA-A*01:01) displayed to TCRs as viewed from the N-terminal end relative to the MHC-I α1/α2 helices. i Comparison of the conformation and surface features of NRASQ61K (PDB ID 6MPP) displayed by HLA-A*01:01 to TCRs with peptides taken from X-ray structures of other known HLA-A*01:01-restricted epitopic peptides (ALKR1275Q - PDB ID 6AT9, MAGE-A1 - PDB ID 3BO8, NP44 - PDB ID 4NQV).
Fig. 4
Fig. 4. Global conformational plasticity of empty vs NRASQ61K bound HLA-A*01:01/hβ2m visualized by hydrogen/deuterium exchange.
a Mass spectrometric envelopes for peptide fragments comprising residues HLA-A*01:01 81–96 (magenta), HLA-A*01:01 139–154 (green), and hβ2m 41–56 (blue) for emptied HLA-A*01:01 with no HDX (i.e., all H sample) and 600 s HDX compared with NRASQ61K bound HLA-A*01:01 at 600 s HDX. The peptide fragment masses are noted. b Kinetic graphs of % deuterium uptake (back-exchange corrected) for different peptide fragments as a function of HDX time (0, 20, 60, 180, or 600 s) shown for emptied (blue) versus NRASQ61K bound (red) HLA-A*01:01/hβ2m. Data are mean % deuterium uptake ± SD from triplicate experiments. c Structure view of average % deuterium uptake at 600 s (back-exchange corrected) for empty and NRASQ61K bound HLA-A*01:01/hβ2m plotted onto PDB IDB 6MPP without or with atoms corresponding to NRASQ61K. Color ranges from deep blue (no deuterium uptake) to red (100% deuterium uptake). Black indicates regions where peptides were not obtained. Mean % deuterium uptakes at 600 s (back-exchange corrected) were resolved to individual peptide fragments and obtained from three independent samples.
Fig. 5
Fig. 5. Affinity, stability, and conformational plasticity of cancer specific NRAS55-64 neoepitopes within the HLA-A*01:01 groove.
a Fluorescence anisotropy (r) of 25 nM TAMRA-NRASQ61K in the presence of 4 μM unlabeled NRASQ61K/HLA-A*01:01/hβ2m and varying concentrations of the specific unlabeled competitor NRAS Q61 peptide. [NRAS] shown in μM units are 0.0 (red), 0.25 (black), 4.0 (purple), 25 (yellow). The data were analyzed by global fitting using Dynafit 4 (http://www.biokin.com/dynafit). Estimated IC50 value for NRAS Q61 binding to HLA-A*01:01/hβ2m is noted. Data are mean ± SD for n = 3 independent experiments. b Comparison of anisotropy change (Δr) for different NRAS55-64 Q61 mutants as a function of competitor concentration extracted from competition fluorescence anisotropy experiments. Data are mean ± SD for n = 3 independent experiments. c Summary of fluorescence anisotropy measured IC50 values for different NRAS55-64 Q61 mutants competing for binding to NRASQ61K/HLA-A*01:01/hβ2m. Data are mean ± SD for n = 3 independent experiments. d Summary of DSF measured thermal stability values (Tm, °C) for different NRAS55-64 Q61 mutants in complex with HLA-A*01:01/hβ2m. Data are mean ± SD for n = 3 technical replicates. e Kinetic graphs of % deuterium uptake (back-exchange corrected) for different peptide fragments as a function of HDX time (0, 20, 60, 180, or 600 s) shown for emptied (blue) versus HLA-A*01:01/hβ2m bound to different NRAS Q61 mutant peptides. Data are mean % deuterium uptake  ± SD from biological triplicates. f Structure view of average % deuterium uptakes for peptide fragments of HLA-A*01:01/hβ2m bound to different NRAS Q61 mutant peptides at 600 s (back-exchange corrected) plotted onto PDB IDB 6MPP. Color ranges from deep blue (no deuterium uptake) to red (100% deuterium uptake). Mean % deuterium uptakes at 600 s (back-exchange corrected) were resolved to individual peptide fragments and obtained from biological triplicates. g Average water occupancy maps across 3 × 1 μs MD simulations for NRASQ61K/HLA-A*01:01 and NRASQ61L/HLA-A*01:01 complexes generated using VolMap tool in VMD and visualized in PyMOL v2.5.2 with isosurface contour level 0.2.
Fig. 6
Fig. 6. MD simulations of NRAS55-64 neoepitope/HLA-A*01:01 complexes highlight differences in peptide backbone and side chain conformational landscapes.
a Root mean square fluctuation (RMSF, Å) of Cα atoms (for the peptide backbone, shown as colored cartoon) and heavy atoms (for residue 61, shown as sticks) averaged across 3 × 1 μs MD simulations. b Peptide backbone clusters generated using a backbone root mean squared deviation (RMSD, Å) cut-off of 0.5 Å. The percentage of frames corresponding to each cluster relative to the total number of frames across the three replicate trajectories (3000) is noted. c Peptide side chain clusters generated from the backbone clusters in (b) using a heavy atom RMSD cut-off of 1 Å. Arrows denote movement of the side chain for residue 61. In ac the HLA-A*01:01 groove is shown in light gray cartoon for reference.
Fig. 7
Fig. 7. In silico and in vitro evaluation of the HLA binding repertoire of NRASQ61K.
a In silico prediction of NRASQ61K (ILDTAGKEEY) binding to 10,386 different HLA molecules with netMHCpan-4.1. The % rank binding affinity (BA) from netMHCpan-4.1 is compared to the BLOSUM62 identity score for all HLA alleles relative to HLA-A*01:01, calculated for HLA groove residues. The top predicted NRASQ61K binders for each HLA-A-, B-, and C- class are noted. b Decamer peptide binding motifs (generated by Seq2Logo) for the top predicted NRASQ61K binders for each HLA-A-, B-, and C- class. c Interface energy (REU) obtained from RosettaMHC models of NRASQ61K with the top predicted binders for each HLA-A-, B-, and C- classes and their MolProbity clash score. Our solved NMR structure (PDB ID 6MPP) was used as the template for modeling. Data are mean ± SD for n = 3 independent experiments. d Zoom view of RosettaMHC models of NRASQ61K with the top predicted binders for each HLA-A-, B-, and C- class. HLA residues within 3.5 Å of the peptide are shown. Van der Waals overlaps or steric clashes are represented with red/green discs. e and f Top: HLA frequency (%, obtained from the Allele Frequency Net Database for all populations) for the top predicted e strong and f weak NRASQ61K binders. Bottom: Interface energy (REU) obtained RosettaMHC models of NRASQ61K with the most frequently represented strong and weak binders in the global population and their MolProbity clash scores. PDB ID 6MPP was used as the template for modeling. Data are mean ± SD for n = 3 independent experiments. g Decamer peptide binding motifs (generated by Seq2Logo) for HLA-B*15:01 and HLA-C*08:02, which are predicted as weak binders of NRASQ61K. h Left: SEC traces of in vitro refoldings of NRASQ61K with HLA-A*01:01/hβ2m, HLA-B*15:01/hβ2m, and HLA-C*08:02/hβ2m. The SDS-PAGE gel of the purified pMHC-I complexes is also shown. Right: DSF experiments performed on the purified pMHC-I complexes with fitted thermal stability (Tm, °C) shown. Data are mean ± SD for n = 3 technical replicates.

References

    1. Rock KL, Reits E, Neefjes J. Present yourself! by MHC class I and MHC class II molecules. Trends Immunol. 2016;37:724–737. doi: 10.1016/j.it.2016.08.010. - DOI - PMC - PubMed
    1. Blum JS, Wearsch PA, Cresswell P. Pathways of antigen processing. Annu. Rev. Immunol. 2013;31:443–473. doi: 10.1146/annurev-immunol-032712-095910. - DOI - PMC - PubMed
    1. Margulies DH, et al. Chaperones and catalysts: how antigen presentation pathways cope with biological necessity. Front. Immunol. 2022;13:859782. doi: 10.3389/fimmu.2022.859782. - DOI - PMC - PubMed
    1. Serçinoğlu O, Ozbek P. Sequence-structure-function relationships in class I MHC: A local frustration perspective. PLoS ONE. 2020;15:e0232849. doi: 10.1371/journal.pone.0232849. - DOI - PMC - PubMed
    1. Robinson J, et al. Distinguishing functional polymorphism from random variation in the sequences of >10,000 HLA-A, -B and -C alleles. PLoS Genet. 2017;13:e1006862. doi: 10.1371/journal.pgen.1006862. - DOI - PMC - PubMed

Publication types