. 2023 Dec 11;14(1):8207.
doi: 10.1038/s41467-023-44040-1.

Interleukin 31 receptor α promotes smooth muscle cell contraction and airway hyperresponsiveness in asthma

Affiliations

Interleukin 31 receptor α promotes smooth muscle cell contraction and airway hyperresponsiveness in asthma

Santhoshi V Akkenepally et al. Nat Commun. .

Abstract

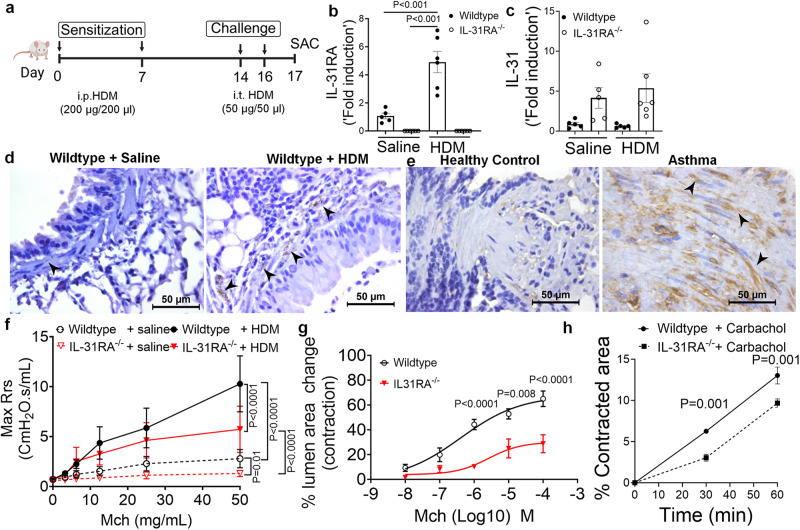
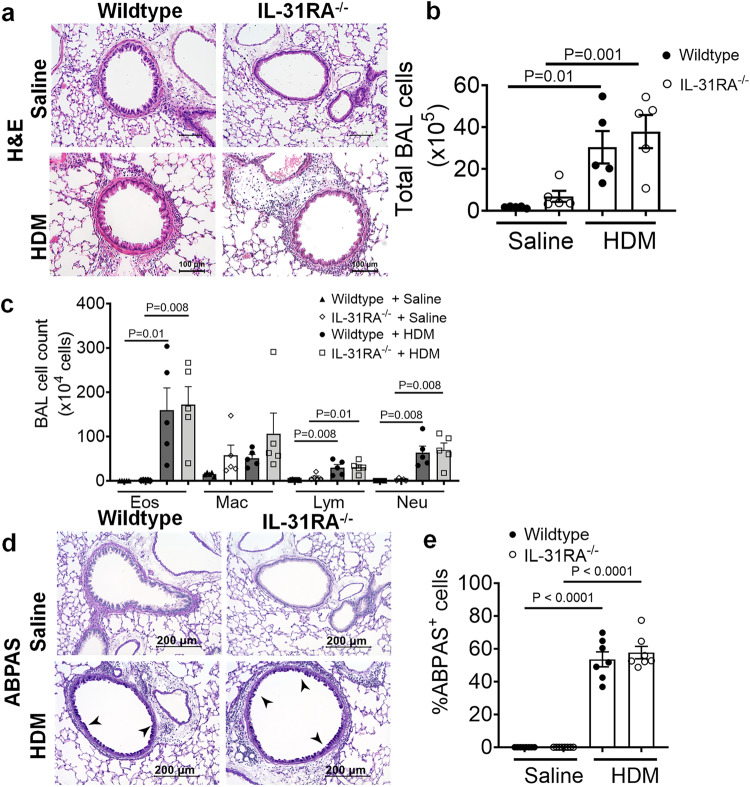
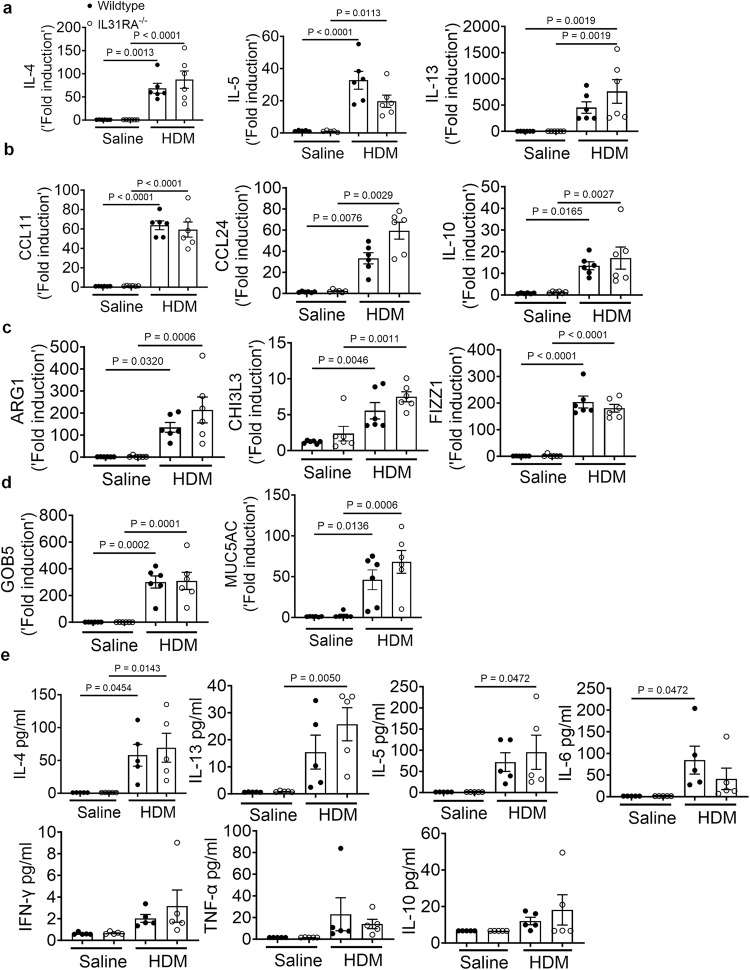
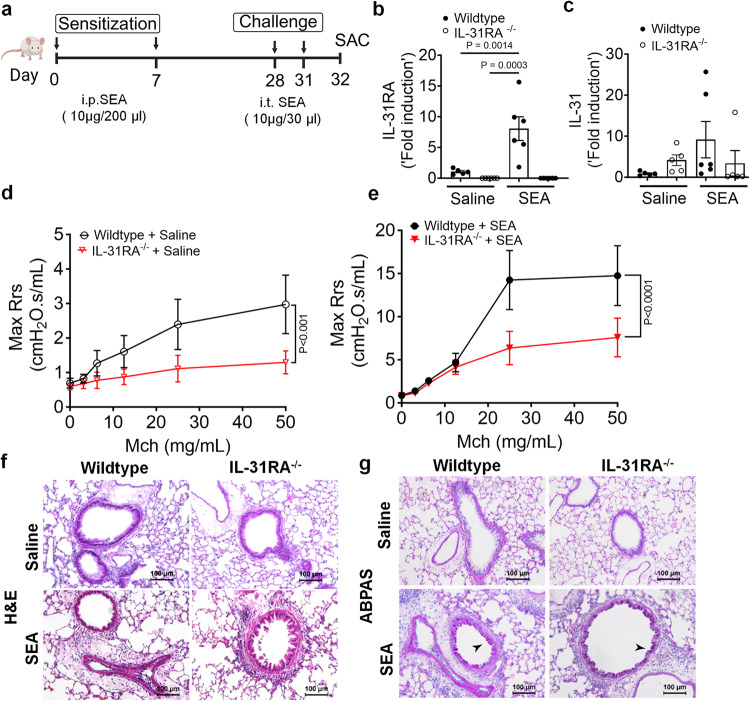
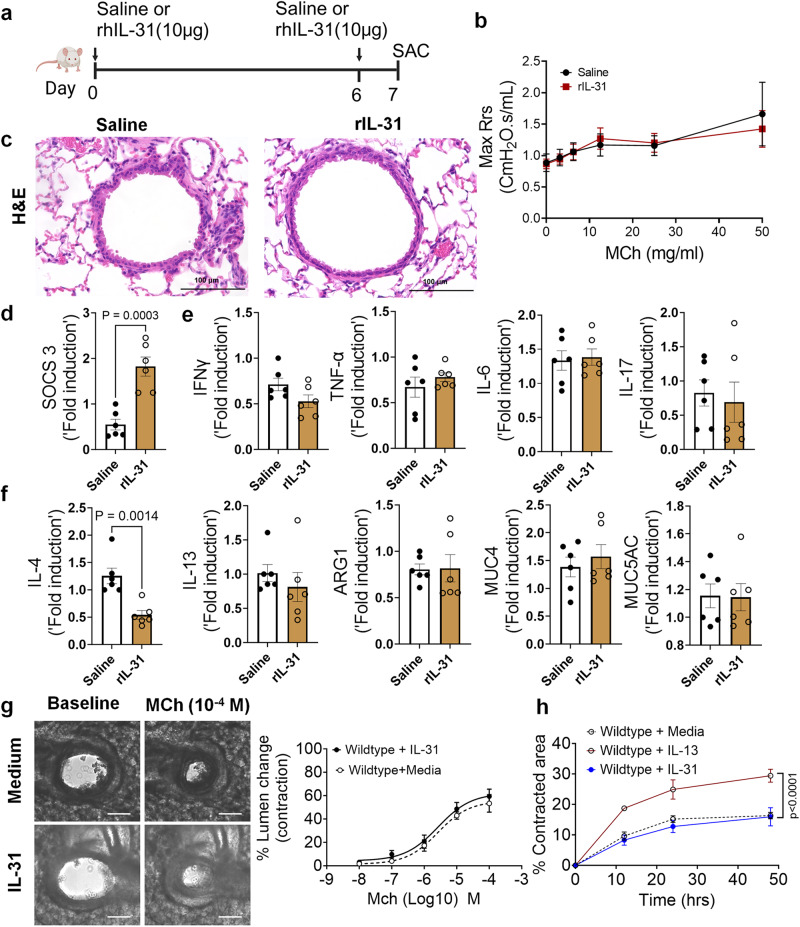
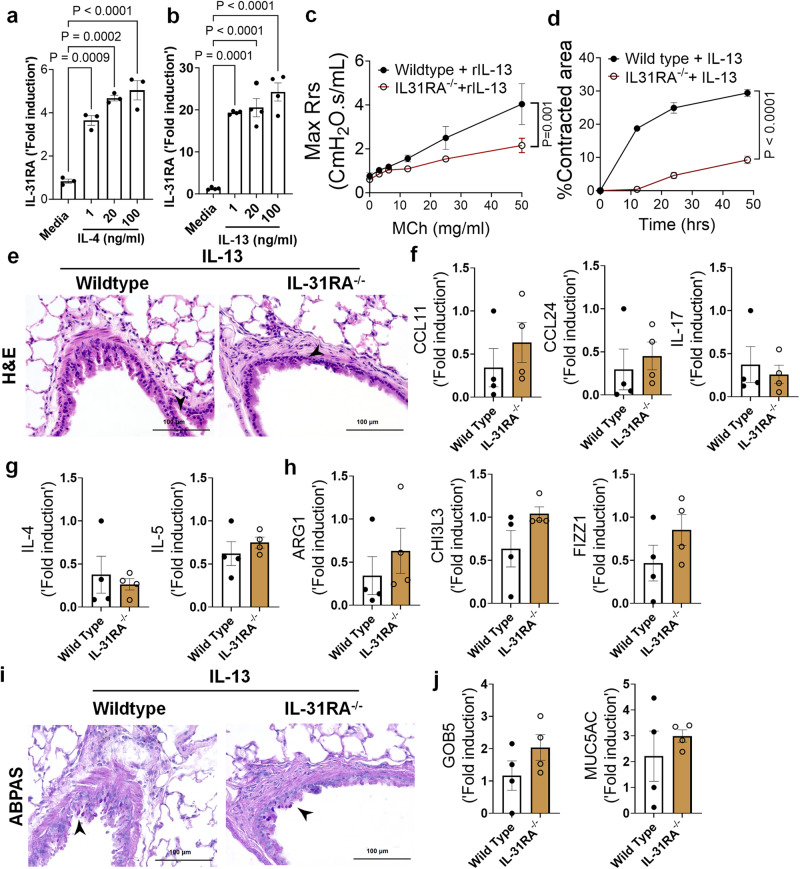
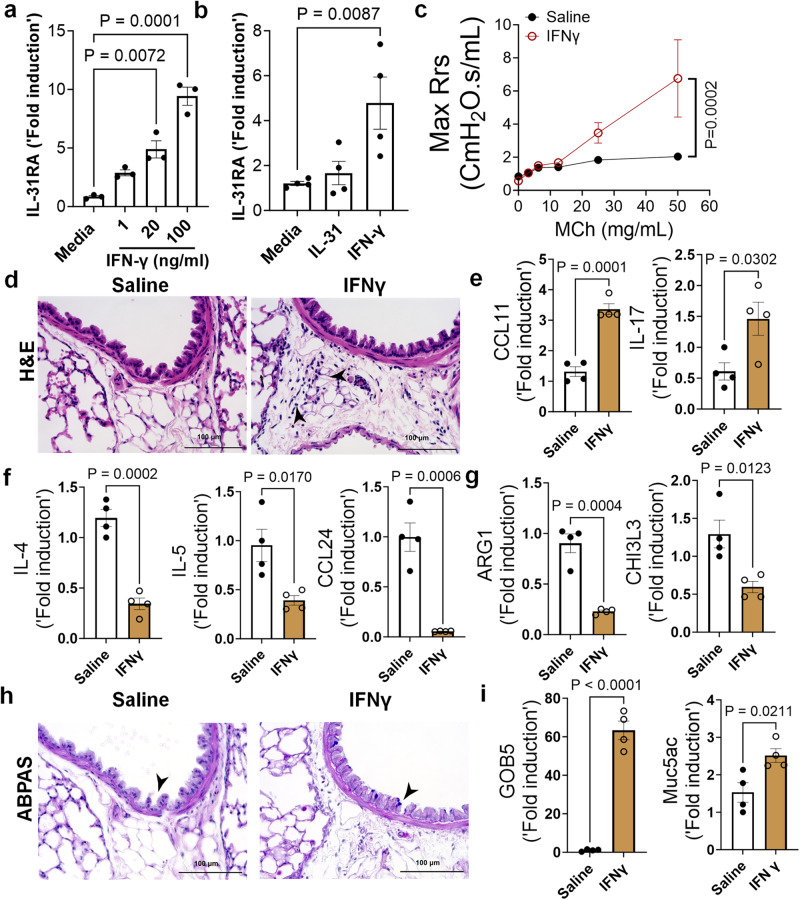
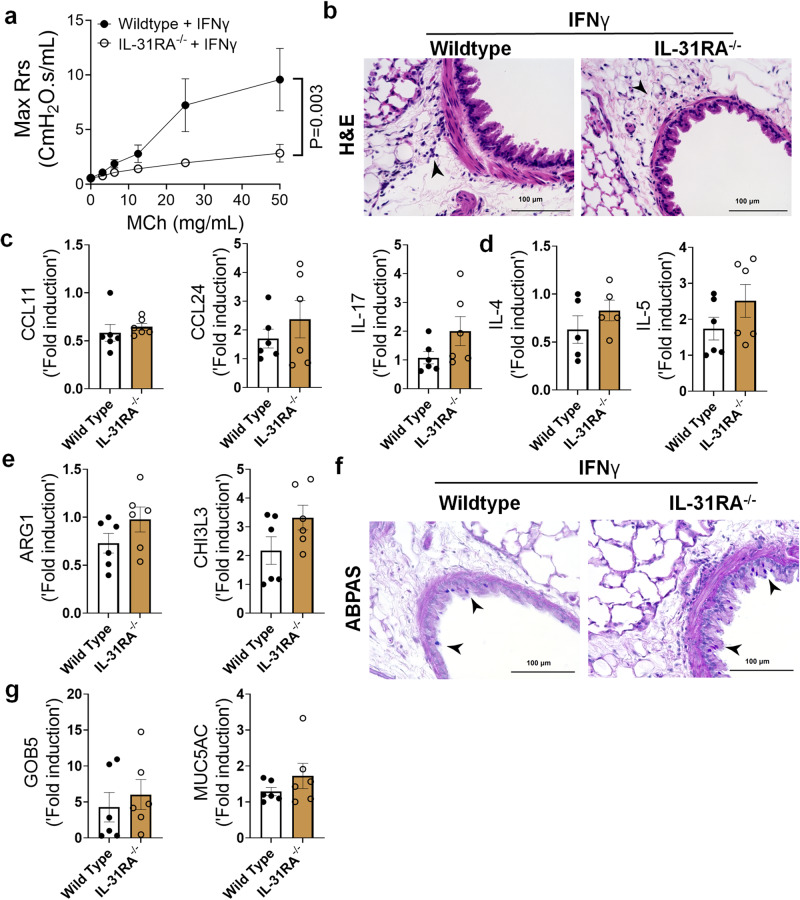
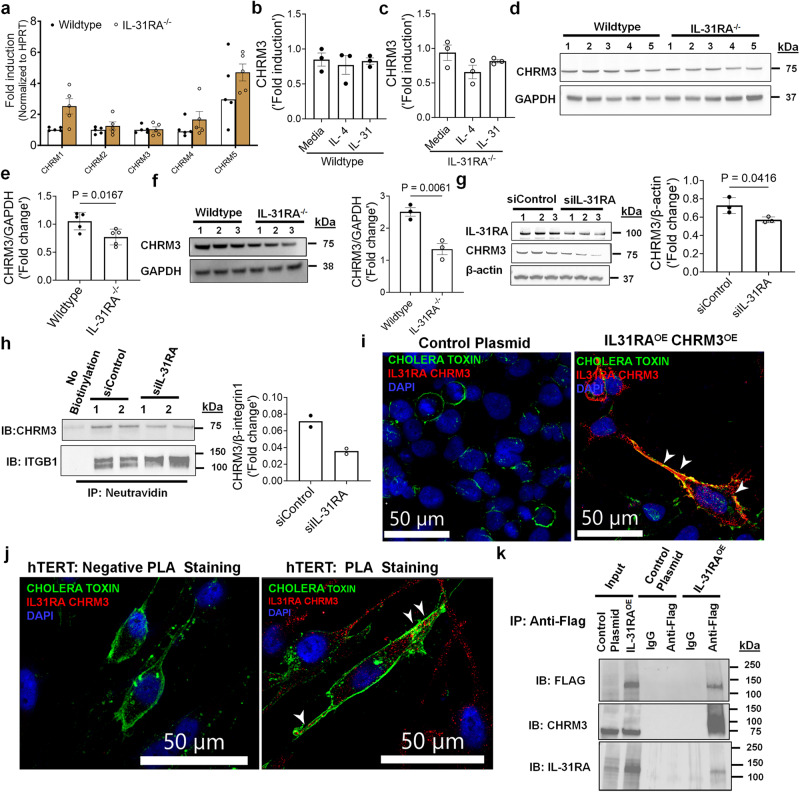
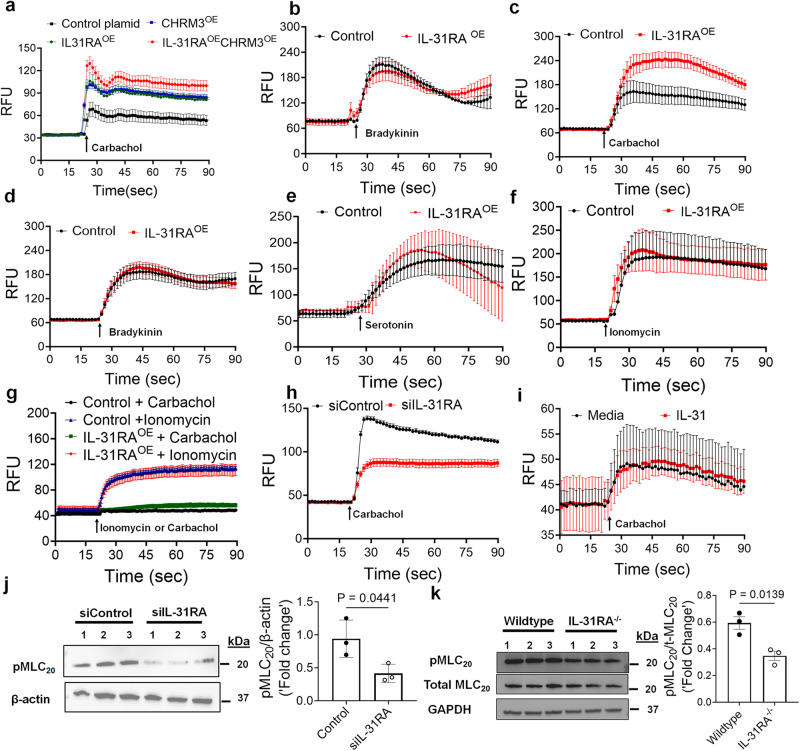
Asthma is a chronic inflammatory airway disease characterized by airway hyperresponsiveness (AHR), inflammation, and goblet cell hyperplasia. Multiple cytokines, including IFNγ, IL-4, and IL-13 are associated with asthma; however, the mechanisms underlying the effects of these cytokines remain unclear. Here, we report a significant increase in the expression of IL-31RA, but not its cognate ligand IL-31, in mouse models of allergic asthma. In support of this, IFNγ, IL-4, and IL-13 upregulated IL-31RA but not IL-31 in both human and mice primary airway smooth muscle cells (ASMC) isolated from the airways of murine and human lungs. Importantly, the loss of IL-31RA attenuated AHR but had no effect on inflammation and goblet cell hyperplasia in mice challenged with allergens or treated with IL-13 or IFNγ. We show that IL-31RA functions as a positive regulator of muscarinic acetylcholine receptor 3 expression, augmenting calcium levels and myosin light chain phosphorylation in human and murine ASMC. These findings identify a role for IL-31RA in AHR that is distinct from airway inflammation and goblet cell hyperplasia in asthma.


Conflict of interest statement

The authors declare no competing interests.

Figures

Fig. 1
Fig. 1. Loss of IL-31RA attenuates house dust mite (HDM)-induced airway hyperresponsiveness.
a Schemata of HDM-induced allergic asthma model. Image was created with biorender.com. b Quantification of IL-31RA transcripts in the lungs of wildtype (n = 5) and IL-31RA–/– (n = 5) mice treated with saline or wildtype (n = 6) and IL-31RA–/– (n = 6) mice treated with HDM. Data shown as mean ± SEM. Two-way ANOVA test was used. c Quantification of IL-31 transcripts in the lungs of wildtype (n = 5) and IL-31RA (n = 5) mice treated with saline or wildtype (n = 5) and IL-31RA (n = 6) mice treated with HDM. Data shown as mean ± SEM. Two-way ANOVA test was used. d Representative images of immunohistochemical staining for IL-31RA on lung sections from wild-type mice treated with saline (n = 4) or HDM (n = 4). Scale bar, 50 µm. e Representative images of immunohistochemical staining for IL-31RA on lung sections from healthy controls (n = 8) and asthmatics (n = 8). Arrow heads highlight the IL-31RA staining (brown) in smooth muscle cells with spindle-shaped nuclei. Scale bar, 50 µm. f Measurement of resistance with increasing doses of methacholine (MCh) in wildtype (n = 7) and IL-31RA–/– (n = 8) mice treated with saline or wildtype (n = 5) and IL-31RA–/– (n = 8) mice treated with HDM using FlexiVent. Data are shown as mean ±SEM. A two-way ANOVA test was used. g The percent of contraction of airways with increasing doses of MCh compared to the baseline area of airways between wild-type (n = 8) and IL-31RA–/– (n = 6) mice. A two-way ANOVA test was used. Data shown as mean ±SEM. h The percent contraction of collagen gels embedded with airway smooth muscle cells from wild-type (n = 3) and IL-31RA–/– (n = 3) mice in culture media and treated with carbachol (10 μM) for 60 min. Data shown as mean ± SEM. Unpaired t test was used. At least two independent experiments produced similar results. Source data are provided as a Source Data file.
Fig. 2
Fig. 2. Loss of IL31RA has no effect on house dust mite (HDM)-induced airway inflammation and goblet cell hyperplasia.
a Representative image of hematoxylin and eosin-stained lung sections from wildtype (n = 5) and IL-31RA–/– (n = 5) mice treated with saline or HDM. Images were taken at ×20 magnification, scale bar 100 µm. b, c Total bronchoalveolar lavage (BAL) cell number and the differential cell count of BAL cells of wild-type and IL-31RA-/- mice treated with saline (n = 5) or HDM (n = 5). Eos, eosinophils; Mac, macrophages; Lym, lymphocytes; and Neu, neutrophils. One-way ANOVA was used. d Representative images of Alcian blue periodic acid-Schiff (ABPAS) staining of lung sections from wildtype (n = 7) and IL-31RA–/– (n = 7) mice treated with saline or HDM. Images were taken at ×20 magnification, scale bar 100 µm. e The percent of ABPAS-positive cells normalized to total cell in the airways of wild-type and IL-31RA–/– mice treated with saline (n = 7) or HDM (n = 7). Data are shown as mean ±SEM. One-way ANOVA was used. At least two independent experiments produced similar results. Source data are provided as a Source Data file.
Fig. 3
Fig. 3. Loss of IL-31RA has no effect on Th2 responses and goblet cell hyperplasia during house dust mite (HDM)-induced allergic asthma.
a Quantification of Th2 cytokine transcripts including IL-4, IL5, and IL-13 in the whole lung tissue of wild-type and IL-31RA-/- mice treated with saline (n = 6) or HDM (n = 6) using RT-PCR. Data are shown as mean ±SEM. One-way ANOVA was used. b Quantification of chemokines and inflammatory cytokines including CCL11, CCL24, and IL-10 in the whole lungs of wild-type and IL-31RA-/- mice treated with saline (n = 6) or HDM (n = 6) using RT-PCR. Data are shown as mean ±SEM. One-way ANOVA was used. c Quantification of Th2 response-associated gene transcripts including CHI3L3, ARG1, and FIZZ1 in the total lungs of wild-type and IL-31RA–/– mice treated with saline (n = 6) or HDM (n = 6) using RT-PCR. Data are shown as mean ±SEM. One-way ANOVA was used. d Quantification of GOB5 and MUC5AC gene transcripts in the whole lungs of wild-type and IL-31RA–/– mice treated with saline (n = 6) or HDM (n = 6) using RT-PCR. Data are shown as mean ±SEM. One-way ANOVA was used. e Concentration of cytokines IL-4, IL-13, IL-5, IL-6, IFNγ, TNF-α and IL-10 in the BAL fluids of wild-type and IL-31RA–/– mice treated with saline (n = 6) or HDM (n = 6) using the cytometric bead assay LEGENDplex. Data are shown as mean ±SEM. One-way ANOVA was used. At least two independent experiments produced similar results. Source data are provided as a Source Data file.
Fig. 4
Fig. 4. Loss of IL31RA attenuates AHR but not inflammation and goblet cell hyperplasia during SEA-induced allergic asthma.
a Schemata of SEA-induced allergic asthma model. Image was created with biorender.com. b Quantification of IL-31RA transcripts in the lungs of wildtype (n = 5) and IL-31RA–/– (n = 6) mice treated with saline or wild-type (n = 6) and IL-31RA–/– (n = 6) mice treated with SEA. Data shown as mean ±SEM. Two-way ANOVA test was used. c Quantification of IL-31 transcripts in the lungs of wildtype (n = 5) and IL-31RA–/– (n = 5) mice treated with saline or wild-type (n = 6) and IL-31RA–/– (n = 5) mice treated with SEA. Data shown as mean ±SEM. Two-way ANOVA test was used. d, e Measurement of resistance with increasing doses of methacholine (MCh) in wildtype (n = 6) and IL-31RA–/– (n = 7) mice treated with saline or wildtype (n = 5) and IL-31RA–/– (n = 4) mice treated with SEA using FlexiVent. Data are shown as mean ±SEM. A two-way ANOVA test was used. f Representative images of hematoxylin and eosin-stained lung sections from wildtype (n = 5) and IL-31RA–/– (n = 5) mice treated with saline or SEA. Images were taken at ×20 magnification. Scale bar, 100 µm. g Representative images of Alcian blue periodic acid-Schiff staining of lung sections from wildtype (n = 5) and IL-31RA–/– (n = 5) mice treated with saline or SEA. Images were taken at ×20 magnification. Scale bar, 100 µm. At least two independent experiments produced similar results. Source data are provided as a Source Data file.
Fig. 5
Fig. 5. IL-31 is dispensable for the induction of AHR, inflammation, and Th2 responses.
a Schemata showing intratracheal administration of IL-31 or saline in wild-type mice. Image was created with biorender.com. b Measurement of resistance with increasing doses of methacholine (MCh) in wild-type mice treated with saline (n = 5) or IL-31 (n = 5) using FlexiVent. Data are shown as mean ±SEM.Two-way ANOVA was used. The data is representative of two independent experiments with no statistical significance between groups. c Representative images of hematoxylin and eosin-stained lung sections from wildtype mice treated with IL-31 (n = 5) or saline (n = 5). Images were captured at ×20 magnification. Scale bar, 100 µm. d Quantification of IL-31-induced SOCS3 gene expression in the whole lung tissue of wild-type mice treated with saline (n = 6) or IL-31 (n = 6). Unpaired t test was used. Data shown as mean ±SEM. e, f Quantification of inflammation-associated gene transcripts IFNγ, TNFα, IL-6, and IL-17 and Th2-associated gene transcripts including IL-4, IL-13, ARG1, MUC4, and MUC5AC in whole lungs of wild-type mice treated with saline (n = 6) or IL-31 (n = 6). Unpaired t test was used and no significance found between groups. Data shown as mean ±SEM. g Representative images of precision cut lung sections (PCLS) from wildtype mice treated with media or IL-31 (500 ng/mL) for 24 h. Airway contractility was measured in response to MCh (10-4 M) compared to baseline lumen area. The percent of airway lumen area contraction with increasing doses of MCh was calculated for media (n = 5) and IL-31-treated (n = 8) PCLS from wildtype mice. Two-way ANOVA test was used. Data shown as mean ±SEM. h The percent contraction of collagen gels embedded with airway smooth muscle cells from wild-type mice that were treated with media, IL-13 (50 ng/mL) or IL-31 (500 ng/mL). The percent contraction was measured at different time points compared to baseline. Two-way ANOVA was used. n = 4/group. Data shown as mean ±SEM. At least two independent experiments produced similar results. Source data are provided as a Source Data file.
Fig. 6
Fig. 6. Th2 cytokines upregulate IL-31RA to induce AHR with no effect on inflammation and goblet cell hyperplasia.
a, b Quantification of IL-31RA transcripts in mouse ASMC treated with increasing doses of IL-4 (n = 3) and IL-13 (n = 4) for 16 h. Two-way ANOVA test was used. Data shown as mean ±SEM. c Wildtype (n = 4) and IL-31RA–/– (n = 4) mice were treated intratracheally with IL-13 on days 0 and 6, and resistance in the lungs was measured with increasing doses of methacholine (MCh) using FexiVent. Data are shown as mean ±SEM. Two-way ANOVA test was used. d ASMC isolated from wildtype (n = 3) and IL-31RA–/– (n = 3) mice were seeded into collagen gels and treated with IL-13 to measure the contraction of collagen gels after 48 h. Unpaired t test was used. Data shown as mean ±SEM. e Representative images of hematoxylin and eosin -stained lung sections from wildtype (n = 4) and IL-31RA–/– (n = 4) mice treated with IL-13. Images were captured at ×20 magnification. Scale bar, 100 µm. f, g, h Quantification of inflammatory chemokines (CCL11, CCL24 and IL-17), Th2 cytokines (IL-4 and IL-5), and Th2 response-associated genes (ARG1, CHl3L3, and FIZZ1) in the whole lungs of wildtype (n = 4) and IL-31RA–/– (n = 4) mice treated with IL-13. Data are shown as mean ±SEM. Unpaired t test was used, and no statistical significance observed between groups. i Representative images of Alcian blue periodic acid-Schiff-stained lung sections from wildtype (n = 4) and IL-31RA–/– (n = 4) mice treated with IL-13. Images were captured at ×20 magnification. Scale bar, 100 µm. j Quantification of goblet cell hyperplasia associated genes including GOB5 and MUC5AC transcript levels in the total lungs of wildtype (n = 4) and IL-31RA–/– (n = 4) mice treated with IL-13. Data are shown as means ±SEM. Unpaired t test was used, and no statistical significance observed between groups. At least two independent experiments produced similar results. Source data are provided as a Source Data file.
Fig. 7
Fig. 7. IFNγ is a positive regulator of IL31RA expression, along with AHR, inflammation, and goblet cell hyperplasia.
a Quantification of IL-31RA transcript levels in mouse airway smooth muscle cells (ASMC) treated with increasing doses of IFNγ (n = 3) or media (n = 3) for 16 h. Data are shown as the mean ±SEM. Two-way ANOVA was used. b Quantification of IL-31RA transcript levels in human ASMCs treated with media, IL-31 (500 ng/mL) or IFNγ (50 ng/mL) for 16 h (n = 4). Data are shown as the mean ±SEM. Two -way ANOVA was used. c Wildtype mice were intratracheally treated with saline (n = 4) or IFNγ (5 µg) (n = 4) on days 0 and 6, and airway resistance with increasing doses of methacholine was measured on day 7. Data are shown as mean ±SEM. Two-way ANOVA was used. d Representative images of hematoxylin and eosin -stained lung sections from wildtype mice treated with saline (n = 4) or IFNγ (n = 4). Images were captured at ×20 magnification. Scale bar, 100 µm. e, f, g Quantification of inflammatory chemokines (CCL11 and IL-17), Th2 cytokines (IL-4, IL-5, and CCL24), and Th2 response-associated genes, including ARG1 and CHl3L3 in the lungs of wildtype mice treated with saline (n = 4) or IFNγ (n = 4). Data are shown as the mean ±SEM. Unpaired t test was used. h Representative images of Alcian blue periodic acid-Schiff-stained lung sections from wild-type mice treated with saline (n = 4) or IFNγ (n = 4). Images were captured at ×20 magnification. Scale bar, 100 µm. i Quantification of mucus-associated gene transcripts, including GOB5 and MUC5AC, in the lungs of wildtype mice treated with saline (n = 4) or IFNγ (n = 4). Data are shown as the mean ±SEM. Unpaired t test was used. At least two independent experiments produced similar results. Source data are provided as a Source Data file.
Fig. 8
Fig. 8. Loss of IL-31RA is sufficient to attenuate IFNγ-induced AHR with no effect on inflammation and goblet cell hyperplasia.
a Wildtype (n = 9) and IL-31RA–/– (n = 9) mice were treated intratracheally with IFNγ (5 μg) on days 0 and 6, and resistance was measured with increasing doses of MCh using Fexivent. Data are shown as mean ±SEM. Two-way ANOVA was used. b Representative images of hematoxylin and eosin-stained lung sections from wildtype (n = 6) and IL-31RA–/– (n = 6) mice treated with IFNγ. Images were captured at ×20 magnification. Scale bar, 100 µm. c, d, e Quantification of inflammatory cytokines (CCL11, CCL24 and IL-17), Th2 cytokines (IL-4 and IL-5), and Th2 response-associated genes including ARG1, and CHl3L3 in the lungs of wildtype (n = 6) and IL-31RA–/– (n = 6) mice treated with IFNγ. Data are shown as mean ±SEM. Unpaired t test was used, and no statistical signification observed between groups. f Representative images of Alcian blue periodic acid-Schiff-stained lung sections from wildtype (n = 6) and IL-31RA–/– (n = 6) mice treated with IFNγ. Images were captured at ×20 magnification. Scale bar, 100 µm. g Quantification of mucus-associated genes including GOB5 and MUC5AC transcript levels in the lungs of wildtype (n = 6) and IL-31RA–/– (n = 6) mice treated with IFNγ. Data are shown as means ±SEM. Unpaired t test was used, and no statistical signification observed between groups. At least two independent experiments produced similar results. Source data are provided as a Source Data file.
Fig. 9
Fig. 9. The post-transcriptional regulation of CHRM3 expression by IL-31RA.
a Quantification of CHRMs transcripts in the lungs of wildtype (n = 5) and IL-31RA–/– (n = 5) mice using RT-PCR. Data shown as mean ±SEM. Two-way ANOVA was used. b, c Quantification of CHRM3 transcripts in ASMC isolated from wildtype (n = 3) and IL-31RA–/– (n = 3) mice and treated with media, IL-4 (10 ng/mL) or IL-31 (500 ng/mL) for 16 h. Data shown as mean ±SEM. Two-way ANOVA was used. d, e The total lung lysates of HDM-treated wildtype (n = 5) and IL-31RA–/– (n = 5) mice were immunoblotted with antibodies against CHRM3 and GAPDH. Data are shown as mean ± SEM. Unpaired t test was used. f ASMC isolated from wildtype (n = 3) and IL-31RA–/– (n = 3) mice were lysed and immunoblotted with antibodies against CHRM3 and GAPDH. Data are shown as mean ±SEM. Unpaired t test was used. g hTERT cells were transiently transfected with IL-31RA-specific (n = 3) or control siRNA (n = 3) for 72 h. Cell lysates were immunoblotted with antibodies against IL-31RA, CHRM3 and β-actin. Bar graph shows CHRM3 protein levels normalized to β-actin. Unpaired t test was used. Data are shown as means ± SEM. h Cell surface proteins were biotinylated, and affinity purified using neutravidin to measure cell surface levels of IL-31RA and CHRM3 in hTERT cells transfected with IL31RA-specific (n = 2) or control siRNA (n = 2) for 72 h. hTERT cells without biotinylation were used as a negative control. CHRM3 protein levels were normalized to ITGB1. i HEK293 cell were transiently transfected with overexpressing plasmids for CHRM3 and IL-31RA or empty control plasmids for 48 h. Cells were treated with antibodies against IL-31RA and CHRM3 and the IL-31RA-CHRM3 complex formation was visualized using hybridization probes at an excitation λex 594 nm (Red). The plasma membrane was stained with cholera toxin subunit b conjugated with Alexa Fluor 488 (Green) and the nuclei with DAPI (Blue). The white arrowheads highlight colocalization between the cholera toxin and puncta of the IL-31RA-CHRM3 complex. Images were captured at ×40 magnification. Scale bar, 50 µm. j hTERT cells were treated with antibodies against IL-31RA and CHRM3 or isotype IgG (negative PLA staining). The IL-31RA-CHRM3 complex formation was visualized as described in Fig. 9i. k HEK293T cells transiently transfected with a control plasmid or FLAG-tagged IL-31RAOE plasmid for 72 h. Total cell lysates and eluted fractions were immunoblotted with anti-Flag, anti-IL31RA and anti-CHRM3 antibodies. At least two independent experiments produced similar results. Source data are provided as a Source Data file.
Fig. 10
Fig. 10. The positive regulation of agonist-induced calcium elevation and MLC phosphorylation by the IL-31RA-CHRM3 axis.
a Intracellular calcium levels were measured using Fluo-4 AM dye in HEK293T cells transiently transfected with control or overexpressing plasmids for CHRM3 and/or IL-31RA plasmids for 72 h and treated with 10 µM carbachol (n = 4). b Intracellular calcium levels were measured using Fluo-4 AM dye in HEK293T cells transiently transfected with control or overexpressing plasmid for IL-31RA for 72 h and treated with 50 µM bradykinin (n = 3). c, d, e, f Intracellular calcium levels were measured using Fluo-4 AM dye in hTERT cells transiently transfected with control or overexpressing plasmid for IL-31RA for 72 h and cells treated with 10 µM carbachol (n = 8), 10 µM bradykinin (n = 8), 100 µM serotonin (n = 4) or 10 µM ionomycin (n = 4). g hTERT cell line 72 (CHRM3LOW) was transiently transfected with control or IL-31RA overexpression plasmids for 72 h and intracellular calcium levels were measured in cells treated with 10 µM carbachol (n = 5) or 10 µM ionomycin (n = 3) using Fluo 4 AM dye. Data are shown as means ± SEM. h Intracellular calcium levels were measured using Fluo-4 AM dye in hTERT cells transiently transfected with IL-31RA-specific or control siRNA for 72 h and treated with 10 µM carbachol (n = 8). i hTERT cells were transiently transfected with IL-31RA overexpressing plasmid for 48 h and treated with IL-31 (500 ng/mL) or media for another 24 h. Media or IL-31 treated cells were stimulated with 10 µM carbachol (n = 4) and intracellular calcium levels were measured using Fluo-4 AM dye. Data are shown as means ± SEM. j hTERT cells were transiently transfected with IL-31RA-specific or control siRNA for 72 h and treated with 10 µM carbachol (n = 3) for 10 min. Cell lysates were immunoblotted with antibodies against phospho-MLC, and β-actin. Data are shown as means ±SEM. Unpaired t test was used. k ASMC isolated from wildtype and IL-31RA–/– mice were treated with 10 µM carbachol (n = 3) for 10 min and cell lysates were immunoblotted with antibodies against phospho-MLC, total-MLC and GAPDH. Data are shown as means ±SEM. Unpaired t test was used. At least two independent experiments produced similar results. Source data are provided as a Source Data file.

Update of

References

    1. Belova A, Fann N, Haskell J, Hubbell B, Narayan T. Estimating lifetime cost of illness. An application to asthma. Ann. Am. Thorac. Soc. 2020;17:1558–1569. doi: 10.1513/AnnalsATS.201910-729OC. - DOI - PubMed
    1. Czira A, et al. A systematic literature review of burden of illness in adults with uncontrolled moderate/severe asthma. Respir. Med. 2022;191:106670. doi: 10.1016/j.rmed.2021.106670. - DOI - PubMed
    1. Reddel HK, et al. An official American Thoracic Society/European Respiratory Society statement: asthma control and exacerbations: standardizing endpoints for clinical asthma trials and clinical practice. Am. J. Respir. Crit Care Med. 2009;180:59–99. doi: 10.1164/rccm.200801-060ST. - DOI - PubMed
    1. Papi A, Brightling C, Pedersen SE, Reddel HK. Asthma. Lancet. 2018;391:783–800. doi: 10.1016/S0140-6736(17)33311-1. - DOI - PubMed
    1. Scichilone N, Battaglia S, La Sala A, Bellia V. Clinical implications of airway hyperresponsiveness in COPD. Int. J. Chron. Obstruct. Pulmon Dis. 2006;1:49–60. - PMC - PubMed

Publication types