. 2023 Dec 11;14(1):8211.
doi: 10.1038/s41467-023-44113-1.

UniKP: a unified framework for the prediction of enzyme kinetic parameters

Affiliations

UniKP: a unified framework for the prediction of enzyme kinetic parameters

Han Yu et al. Nat Commun. .

Abstract

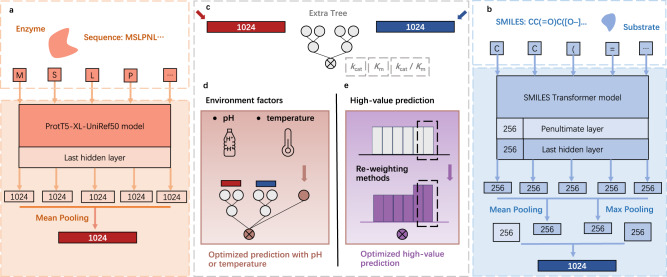
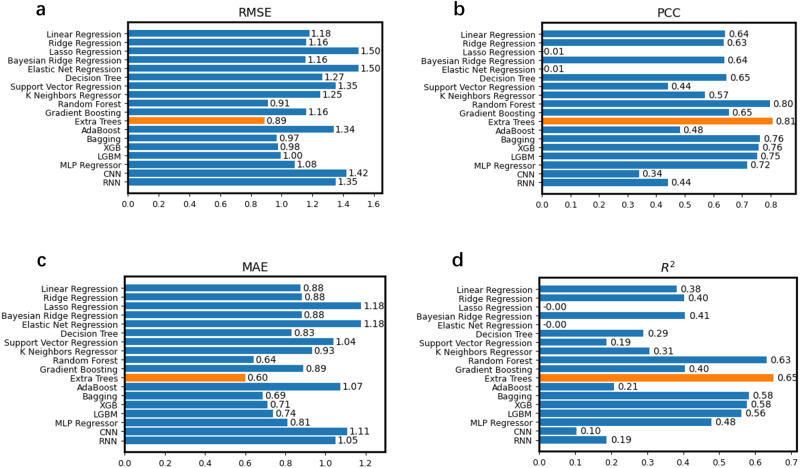
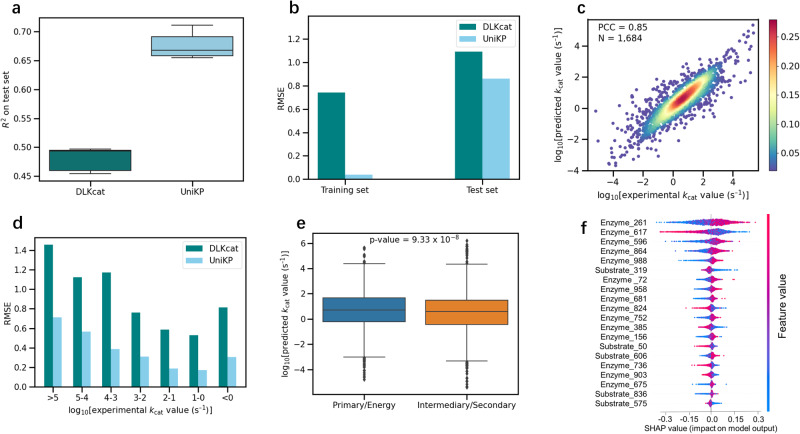
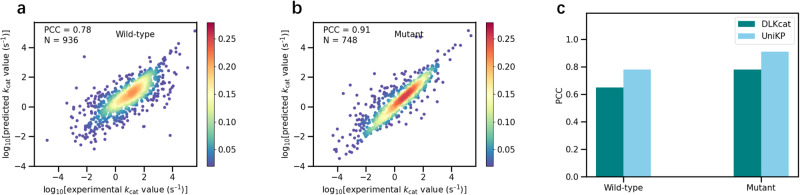
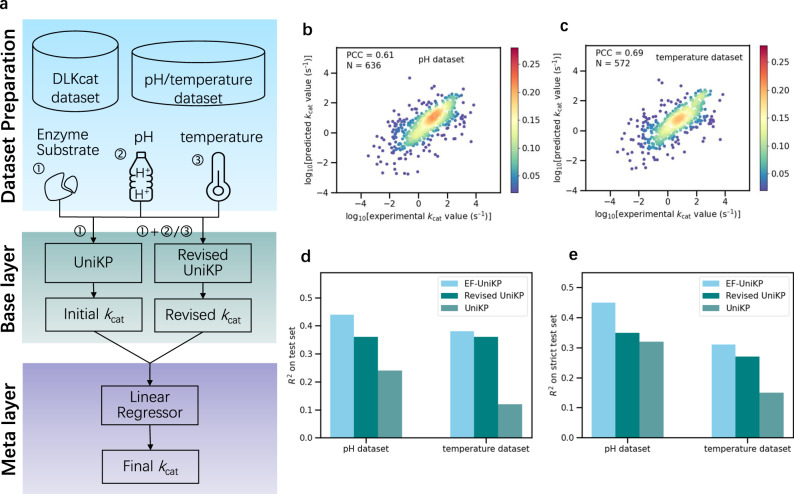
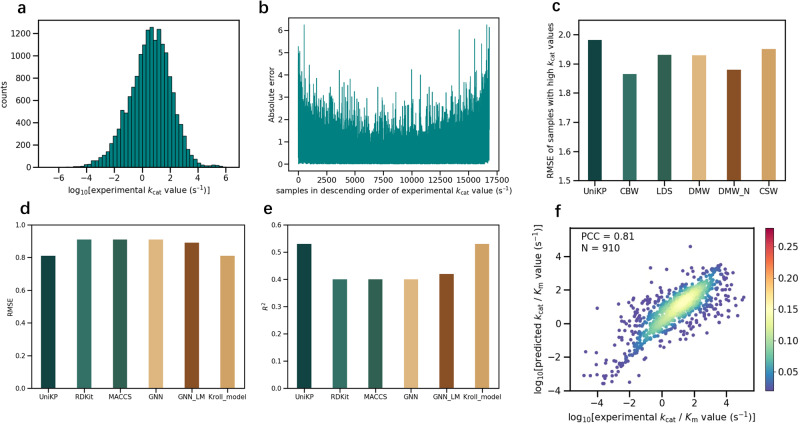
Prediction of enzyme kinetic parameters is essential for designing and optimizing enzymes for various biotechnological and industrial applications, but the limited performance of current prediction tools on diverse tasks hinders their practical applications. Here, we introduce UniKP, a unified framework based on pretrained language models for the prediction of enzyme kinetic parameters, including enzyme turnover number (kcat), Michaelis constant (Km), and catalytic efficiency (kcat / Km), from protein sequences and substrate structures. A two-layer framework derived from UniKP (EF-UniKP) has also been proposed to allow robust kcat prediction in considering environmental factors, including pH and temperature. In addition, four representative re-weighting methods are systematically explored to successfully reduce the prediction error in high-value prediction tasks. We have demonstrated the application of UniKP and EF-UniKP in several enzyme discovery and directed evolution tasks, leading to the identification of new enzymes and enzyme mutants with higher activity. UniKP is a valuable tool for deciphering the mechanisms of enzyme kinetics and enables novel insights into enzyme engineering and their industrial applications.


Conflict of interest statement

X.L. has a financial interest in Demetrix and Synceres. J.D.K. has a financial interest in Amyris, Lygos, Demetrix, Napigen, Maple Bio, Apertor Labs, Zero Acre Farms, Berkeley Yeast, and Ansa Biotechnology. The remaining authors declare no competing interests.

Figures

Fig. 1
Fig. 1. The overview of UniKP.
a Enzyme sequence representation module: Information about enzymes was encoded using a pretrained language model, ProtT5-XL-UniRef50. Each amino acid was converted into a 1024-dimensional vector on the last hidden layer, and the resulting vectors were summed and averaged by mean pooling, generating a 1024-dimensional vector to represent the enzyme. b Substrate structure representation module: Information about substrates was encoded using a pretrained language model, SMILES Transformer model. The substrate structure was converted into a simplified molecular-input line-entry system (SMILES) representation and input into a pretrained SMILES transformer to generate a 1024-dimensional vector. This vector was generated by concatenating the mean and max pooling of the last layer, along with the first outputs of the last and penultimate layers. c Machine learning module: An explainable Extra Trees model took the concatenated representation vector of both the enzyme and substrate as input and generated a predicted kcat, Km or kcat / Km value. d EF-UniKP: A framework that considers environmental factors to generate an optimized prediction. It is validated on two representative datasets: pH and temperature datasets. e Various re-weighting methods were used to adjust the sample weight distribution to generate an optimized prediction for high-value prediction task.
Fig. 2
Fig. 2. Performance comparison of different models.
Comparison of Root Mean Square Error (RMSE) (a), Pearson Correlation Coefficient (PCC) (b), Mean Absolute Error (MAE) (c), and R2 (Coefficient of Determination) (d) values between experimentally measured kcat values and predicted kcat values of 16 diverse machine learning models and 2 deep learning models. The kcat values of all samples were predicted independently using 5-fold cross-validation. Each bar in the graph represents the models’ performance with respect to this metric. The “Extra Trees” model is highlighted in yellow, while other models are depicted in blue. The corresponding numerical values for each bar are provided on the right side. Source data are provided as a Source Data file.
Fig. 3
Fig. 3. High accuracy of UniKP in enzyme kcat prediction.
a Comparison of average coefficient of determination (R²) values for DLKcat and UniKP after five rounds of random test set splitting (n = 1684). b Comparison of the root mean square error (RMSE) between experimentally measured kcat values and predicted kcat values of DLKcat and UniKP for training (n = 15,154) and test sets (n = 1684). Dark bars represent RMSE of DLKcat and light bars for UniKP. c Scatter plot illustrating the Pearson coefficient correlation (PCC) between experimentally measured kcat values and predicted kcat values of UniKP for the test set (N = 1684), showing a strong linear correlation. The color gradient represents the density of data points, ranging from blue (0.02) to red (0.28). d Comparison of RMSE between experimentally measured kcat values and predicted kcat values of DLKcat and UniKP in various experimental kcat numerical intervals. Dark bars represent RMSE of DLKcat and light bars for UniKP. e Enzymes with significantly different kcat values between primary central and energy metabolism, and intermediary and secondary metabolism. An independent two-sided t-test to determine whether the means of two independent samples differ significantly. Primary central and energy metabolism (n = 3098) and intermediary and secondary metabolism (n = 4201) were examined in this analysis. f Shapley additive explanations (SHAP) analysis for the top 20-feature Extra Trees model. The impact of each feature on kcat values is illustrated through a swarm plot of their corresponding SHAP values. The color of the dot represents the relative value of the feature in the dataset (high-to-low depicted as red-to-blue). The horizontal location of the dots shows whether the effect of that feature value contributed positively or negatively in that prediction instance (x-axis). In each box plot (a, e), the central band represents the median value, the box represents the upper and lower quartiles and the whiskers extend up to 1.5 times the interquartile range beyond the box range. Source data are provided as a Source Data file.
Fig. 4
Fig. 4. UniKP markedly discriminates kcat values of enzymes and their mutants.
Scatter plot illustrating the Pearson coefficient correlation (PCC) between experimentally measured kcat values and predicted kcat values of UniKP for wild type enzymes (a) (N = 936) and mutated enzymes (b) (N = 748). The color gradient represents the density of data points, ranging from blue (0.02) to red (0.28). c PCC values of wild-type and mutated enzymes on the test set of DLKcat and UniKP. Dark bars represent PCC values of DLKcat and light bars for UniKP. Source data are provided as a Source Data file.
Fig. 5
Fig. 5. A two-layer framework considering environmental factors.
a A two-layer framework called EF-UniKP that consists of a base layer and a meta layer. The base layer contains two models, namely UniKP and Revised UniKP. The UniKP takes the concatenated representation vector of the enzyme and substrate as input, while the Revised UniKP uses a concatenated representation vector of the enzyme and substrate, combined with the pH or temperature value. Both models are trained using the Extra Trees algorithm. The meta layer of this framework includes a linear regressor that uses the predicted kcat values from both the UniKP and Revised UniKP to predict the final kcat value. Scatter plot illustrating the Pearson coefficient correlation (PCC) between experimentally measured kcat values and predicted kcat values of Revised UniKP for pH set (b) (N = 636) and temperature set (c) (N = 572). The color gradient represents the density of data points, ranging from blue (0.02) to red (0.28). d Coefficient of determination (R2) values between experimentally measured kcat values and predicted kcat values on pH and temperature test sets of EF-UniKP, Revised UniKP and UniKP. Light bars represent R2 of EF-UniKP, dark bars for Revised UniKP and darkish bars for UniKP. e R2 values between experimentally measured kcat values and predicted kcat values on more strict pH and temperature test sets of EF-UniKP, Revised UniKP and UniKP. These are the samples in the test set where at least either the substrate or enzyme was not included in the training set, resulting in 62 and 61 samples for pH and temperature, respectively. Light bars represent R2 of EF-UniKP, dark bars for Revised UniKP and darkish bars for UniKP. Source data are provided as a Source Data file.
Fig. 6
Fig. 6. Enhancing high kcat prediction through re-weighting methods and unified framework for Km and kcat / Km predictions.
a The distribution of kcat values in the kcat dataset. All samples are divided into 50 bins. b The absolute error between experimentally measured kcat values and predicted kcat values of each sample. The kcat values of all samples were predicted independently using five-fold cross-validation. c Root mean square error (RMSE) between experimentally measured kcat values and predicted kcat values of 149 samples with kcat values higher than 4 (logarithm value) using various re-weighting methods and the initial UniKP. d, e RMSE, coefficient of determination (R2) between experimentally measured Km values and predicted Km values on Km test set. f Scatter plot illustrating the Pearson coefficient correlation (PCC) between experimentally measured kcat / Km values and predicted kcat / Km values of UniKP for kcat / Km dataset (N = 910). The color gradient represents the density of data points, ranging from blue (0.02) to red (0.28). Source data are provided as a Source Data file.

References

    1. Kuchner O, Arnold FH. Directed evolution of enzyme catalysts. Trends Biotechnol. 1997;15:523–530. doi: 10.1016/S0167-7799(97)01138-4. - DOI - PubMed
    1. Adadi R, Volkmer B, Milo R, Heinemann M, Shlomi T. Prediction of Microbial Growth Rate versus Biomass Yield by a Metabolic Network with Kinetic Parameters. PLoS Comput. Biol. 2012;8:e1002575. doi: 10.1371/journal.pcbi.1002575. - DOI - PMC - PubMed
    1. Currin A, Swainston N, Day PJ, Kell DB. Synthetic biology for the directed evolution of protein biocatalysts: navigating sequence space intelligently. Chem. Soc. Rev. 2015;44:1172–1239. doi: 10.1039/C4CS00351A. - DOI - PMC - PubMed
    1. Briggs GE, Haldane JBS. A note on the kinetics of enzyme action. Biochem. J. 1925;19:338. doi: 10.1042/bj0190338. - DOI - PMC - PubMed
    1. Nilsson A, Nielsen J, Palsson BO. Metabolic Models of Protein Allocation Call for the Kinetome. Cell Systems. 2017;5:538–541. doi: 10.1016/j.cels.2017.11.013. - DOI - PubMed

Publication types