Meta-Analysis
. 2024 Feb;29(2):464-482.
doi: 10.1038/s41380-023-02340-4. Epub 2023 Dec 11.

Retina as a potential biomarker in schizophrenia spectrum disorders: a systematic review and meta-analysis of optical coherence tomography and electroretinography

Affiliations
Meta-Analysis

Retina as a potential biomarker in schizophrenia spectrum disorders: a systematic review and meta-analysis of optical coherence tomography and electroretinography

Hiroshi Komatsu et al. Mol Psychiatry. 2024 Feb.

Abstract

Introduction: Abnormal findings on optical coherence tomography (OCT) and electroretinography (ERG) have been reported in participants with schizophrenia spectrum disorders (SSDs). This study aims to reveal the pooled standard mean difference (SMD) in retinal parameters on OCT and ERG among participants with SSDs and healthy controls and their association with demographic characteristics, clinical symptoms, smoking, diabetes mellitus, and hypertension.

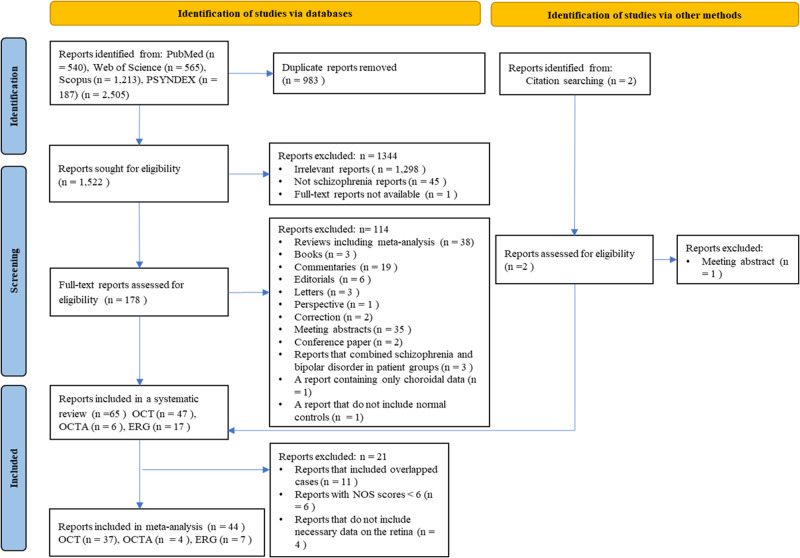
Methods: Using PubMed, Scopus, Web of Science, and PSYNDEX, we searched the literature from inception to March 31, 2023, using specific search terms. This study was registered with PROSPERO (CRD4202235795) and conducted according to PRISMA 2020.

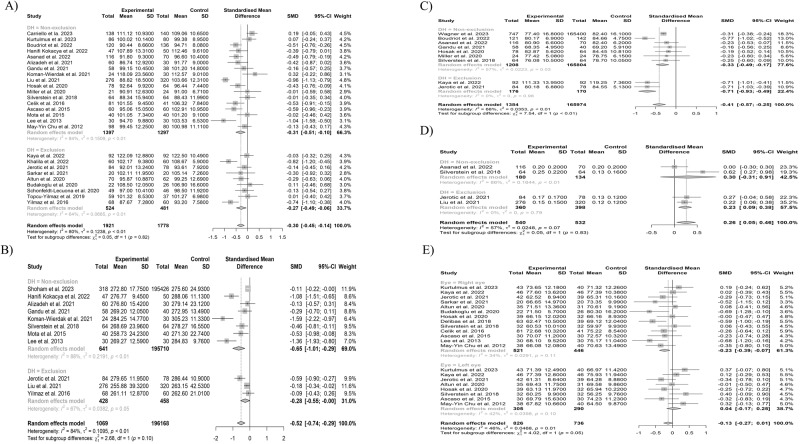
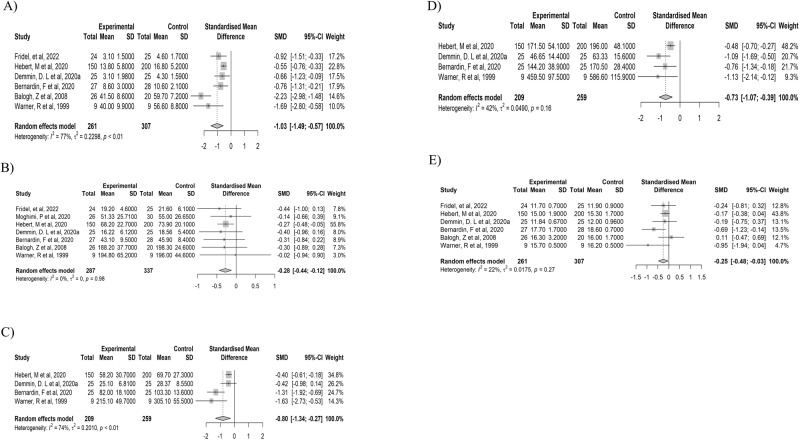
Results: We included 65 studies in the systematic review and 44 in the meta-analysis. Participants with SSDs showed thinning of the peripapillary retinal nerve fiber layer (pRNFL), macular ganglion cell layer- inner plexiform cell layer, and retinal thickness in all other segments of the macula. A meta-analysis of studies that excluded SSD participants with diabetes and hypertension showed no change in results, except for pRNFL inferior and nasal thickness. Furthermore, a significant difference was found in the pooled SMD of pRNFL temporal thickness between the left and right eyes. Meta-regression analysis revealed an association between retinal thinning and duration of illness, positive and negative symptoms. In OCT angiography, no differences were found in the foveal avascular zone and superficial layer foveal vessel density between SSD participants and controls. In flash ERG, the meta-analysis showed reduced amplitude of both a- and b-waves under photopic and scotopic conditions in SSD participants. Furthermore, the latency of photopic a-wave was significantly shorter in SSD participants in comparison with HCs.

Discussion: Considering the prior report of retinal thinning in unaffected first-degree relatives and the results of the meta-analysis, the findings suggest that retinal changes in SSDs have both trait and state aspects. Future longitudinal multimodal retinal imaging studies are needed to clarify the pathophysiological mechanisms of these changes and to clarify their utility in individual patient monitoring efforts.


Conflict of interest statement

The authors declare no competing interests.

Figures

Fig. 1
Fig. 1. Flow diagram of the systematic review and meta-analysis according to PRISMA 2020.
PRISMA preferred reporting items for systematic reviews and meta-analyses, OCT optical coherence tomography, OCTA optical coherence tomography angiography, ERG electroretinography, NOS Newcastle-Ottawa Scale.
Fig. 2
Fig. 2. Results of the meta-analysis of pRNFL average thickness, macular average thickness, mGCL-IPL, and optic cup volume.
A pRNFL average. B Macular average thickness. C Macular GCL-IPL. D Optic cup volume. Horizontal bars indicate 95% confidence intervals (95% CIs). Total indicates the total number of participants’ eyes for which the mean and standard deviation were calculated. SMD standardized mean difference, SD standard deviation, pRNFL peripapillary retinal nerve fiber layer, mGCL-IPL macular ganglion cell layer-inner plexiform layer.
Fig. 3
Fig. 3. Results of the subgroup analysis.
A The results of the subgroup analysis between the studies in which diabetes mellitus and hypertension were excluded (exclusion) and not excluded (non-exclusion) in pRNFL average thickness. B The results of the subgroup analysis between exclusion and non-exclusion in macular average thickness. C The results of the subgroup analysis between exclusion and non-exclusion in mGCL-IPL. D The results of the subgroup analysis between exclusion and non-exclusion in optic cup volume. E The results of the subgroup analysis between right and left eyes in pRNFL temporal thickness. Horizontal bars indicate 95% confidence intervals (95% CIs). Total indicates the total number of participants’ eyes for which the mean and standard deviation were calculated. SMD standardized mean difference, SD standard deviation, pRNFL peripapillary retinal nerve fiber layer, mGCL-IPL macular ganglion cell layer-inner plexiform layer.
Fig. 4
Fig. 4. Results of the meta-analysis of fERG in the photopic and scotopic conditions.
A The a-wave amplitude of photopic fERG. B The b-wave amplitude of photopic fERG. C The a-wave amplitude of scotopic fERG. D The b-wave amplitude of scotopic fERG. E The a-wave latency of photopic fERG. Horizontal bars indicate 95% confidence intervals (95% CIs). Total indicates the total number of participants for which the mean and standard deviation were calculated. fERG flash electroretinography, SMD standardized mean difference, SD standard deviation.

References

    1. Komatsu H, Takeuchi H, Kikuchi Y, Ono C, Yu Z, Iizuka K, et al. Ethnicity-Dependent Effects of Schizophrenia Risk Variants of the OLIG2 Gene on OLIG2 Transcription and White Matter Integrity. Schizophr Bull. 2020;46:1619–28. doi: 10.1093/schbul/sbaa049. - DOI - PMC - PubMed
    1. Mauschitz MM, Lohner V, Koch A, Stöcker T, Reuter M, Holz FG, et al. Retinal layer assessments as potential biomarkers for brain atrophy in the Rhineland Study. Sci Rep. 2022;12:2757. doi: 10.1038/s41598-022-06821-4. - DOI - PMC - PubMed
    1. Mutlu U, Bonnemaijer PWM, Ikram MA, Colijn JM, Cremers LGM, Buitendijk GHS, et al. Retinal neurodegeneration and brain MRI markers: the Rotterdam Study. Neurobiol Aging. 2017;60:183–91. doi: 10.1016/j.neurobiolaging.2017.09.003. - DOI - PubMed
    1. Pan J, Zhou Y, Xiang Y, Yu J. Retinal nerve fiber layer thickness changes in Schizophrenia: A meta-analysis of case-control studies. Psychiatry Res. 2018;270:786–91. doi: 10.1016/j.psychres.2018.10.075. - DOI - PubMed
    1. Lizano P, Bannai D, Lutz O, Kim LA, Miller J, Keshavan M. A Meta-analysis of Retinal Cytoarchitectural Abnormalities in Schizophrenia and Bipolar Disorder. Schizophr Bull. 2020;46:43–53. doi: 10.1093/schbul/sbz029. - DOI - PMC - PubMed

Publication types