. 2024 May;8(5):544-560.
doi: 10.1038/s41551-023-01131-0. Epub 2023 Dec 11.

Screening for lipid nanoparticles that modulate the immune activity of helper T cells towards enhanced antitumour activity

Affiliations

Screening for lipid nanoparticles that modulate the immune activity of helper T cells towards enhanced antitumour activity

Yining Zhu et al. Nat Biomed Eng. 2024 May.

Abstract

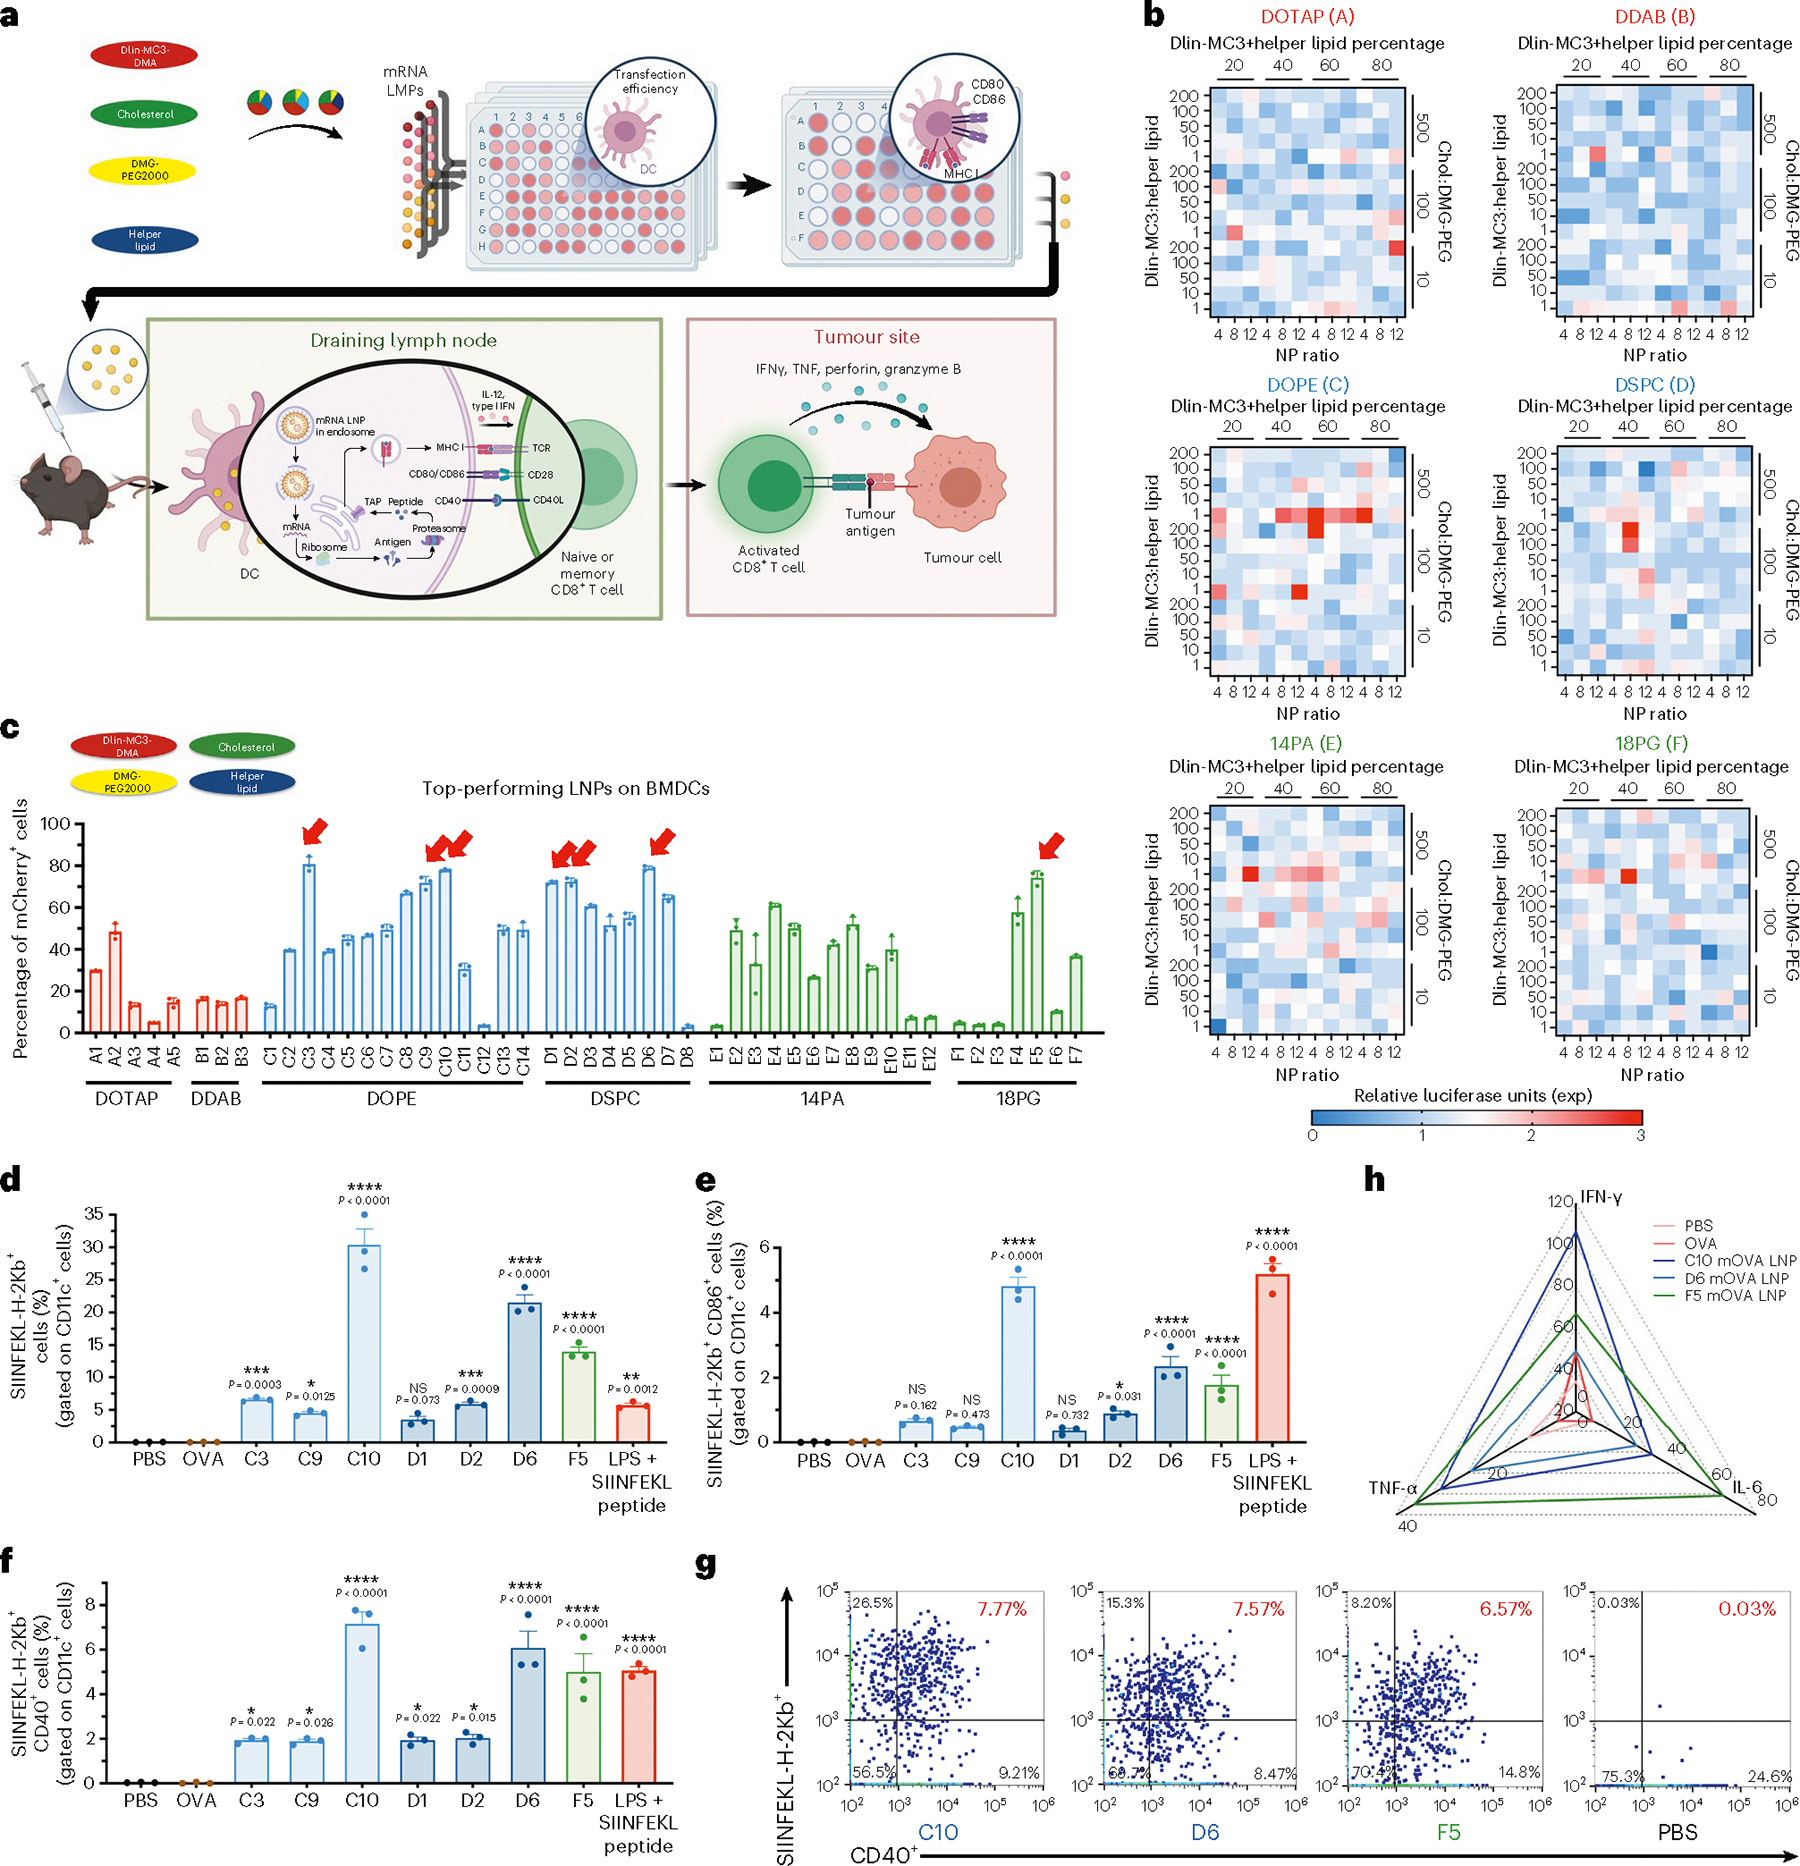
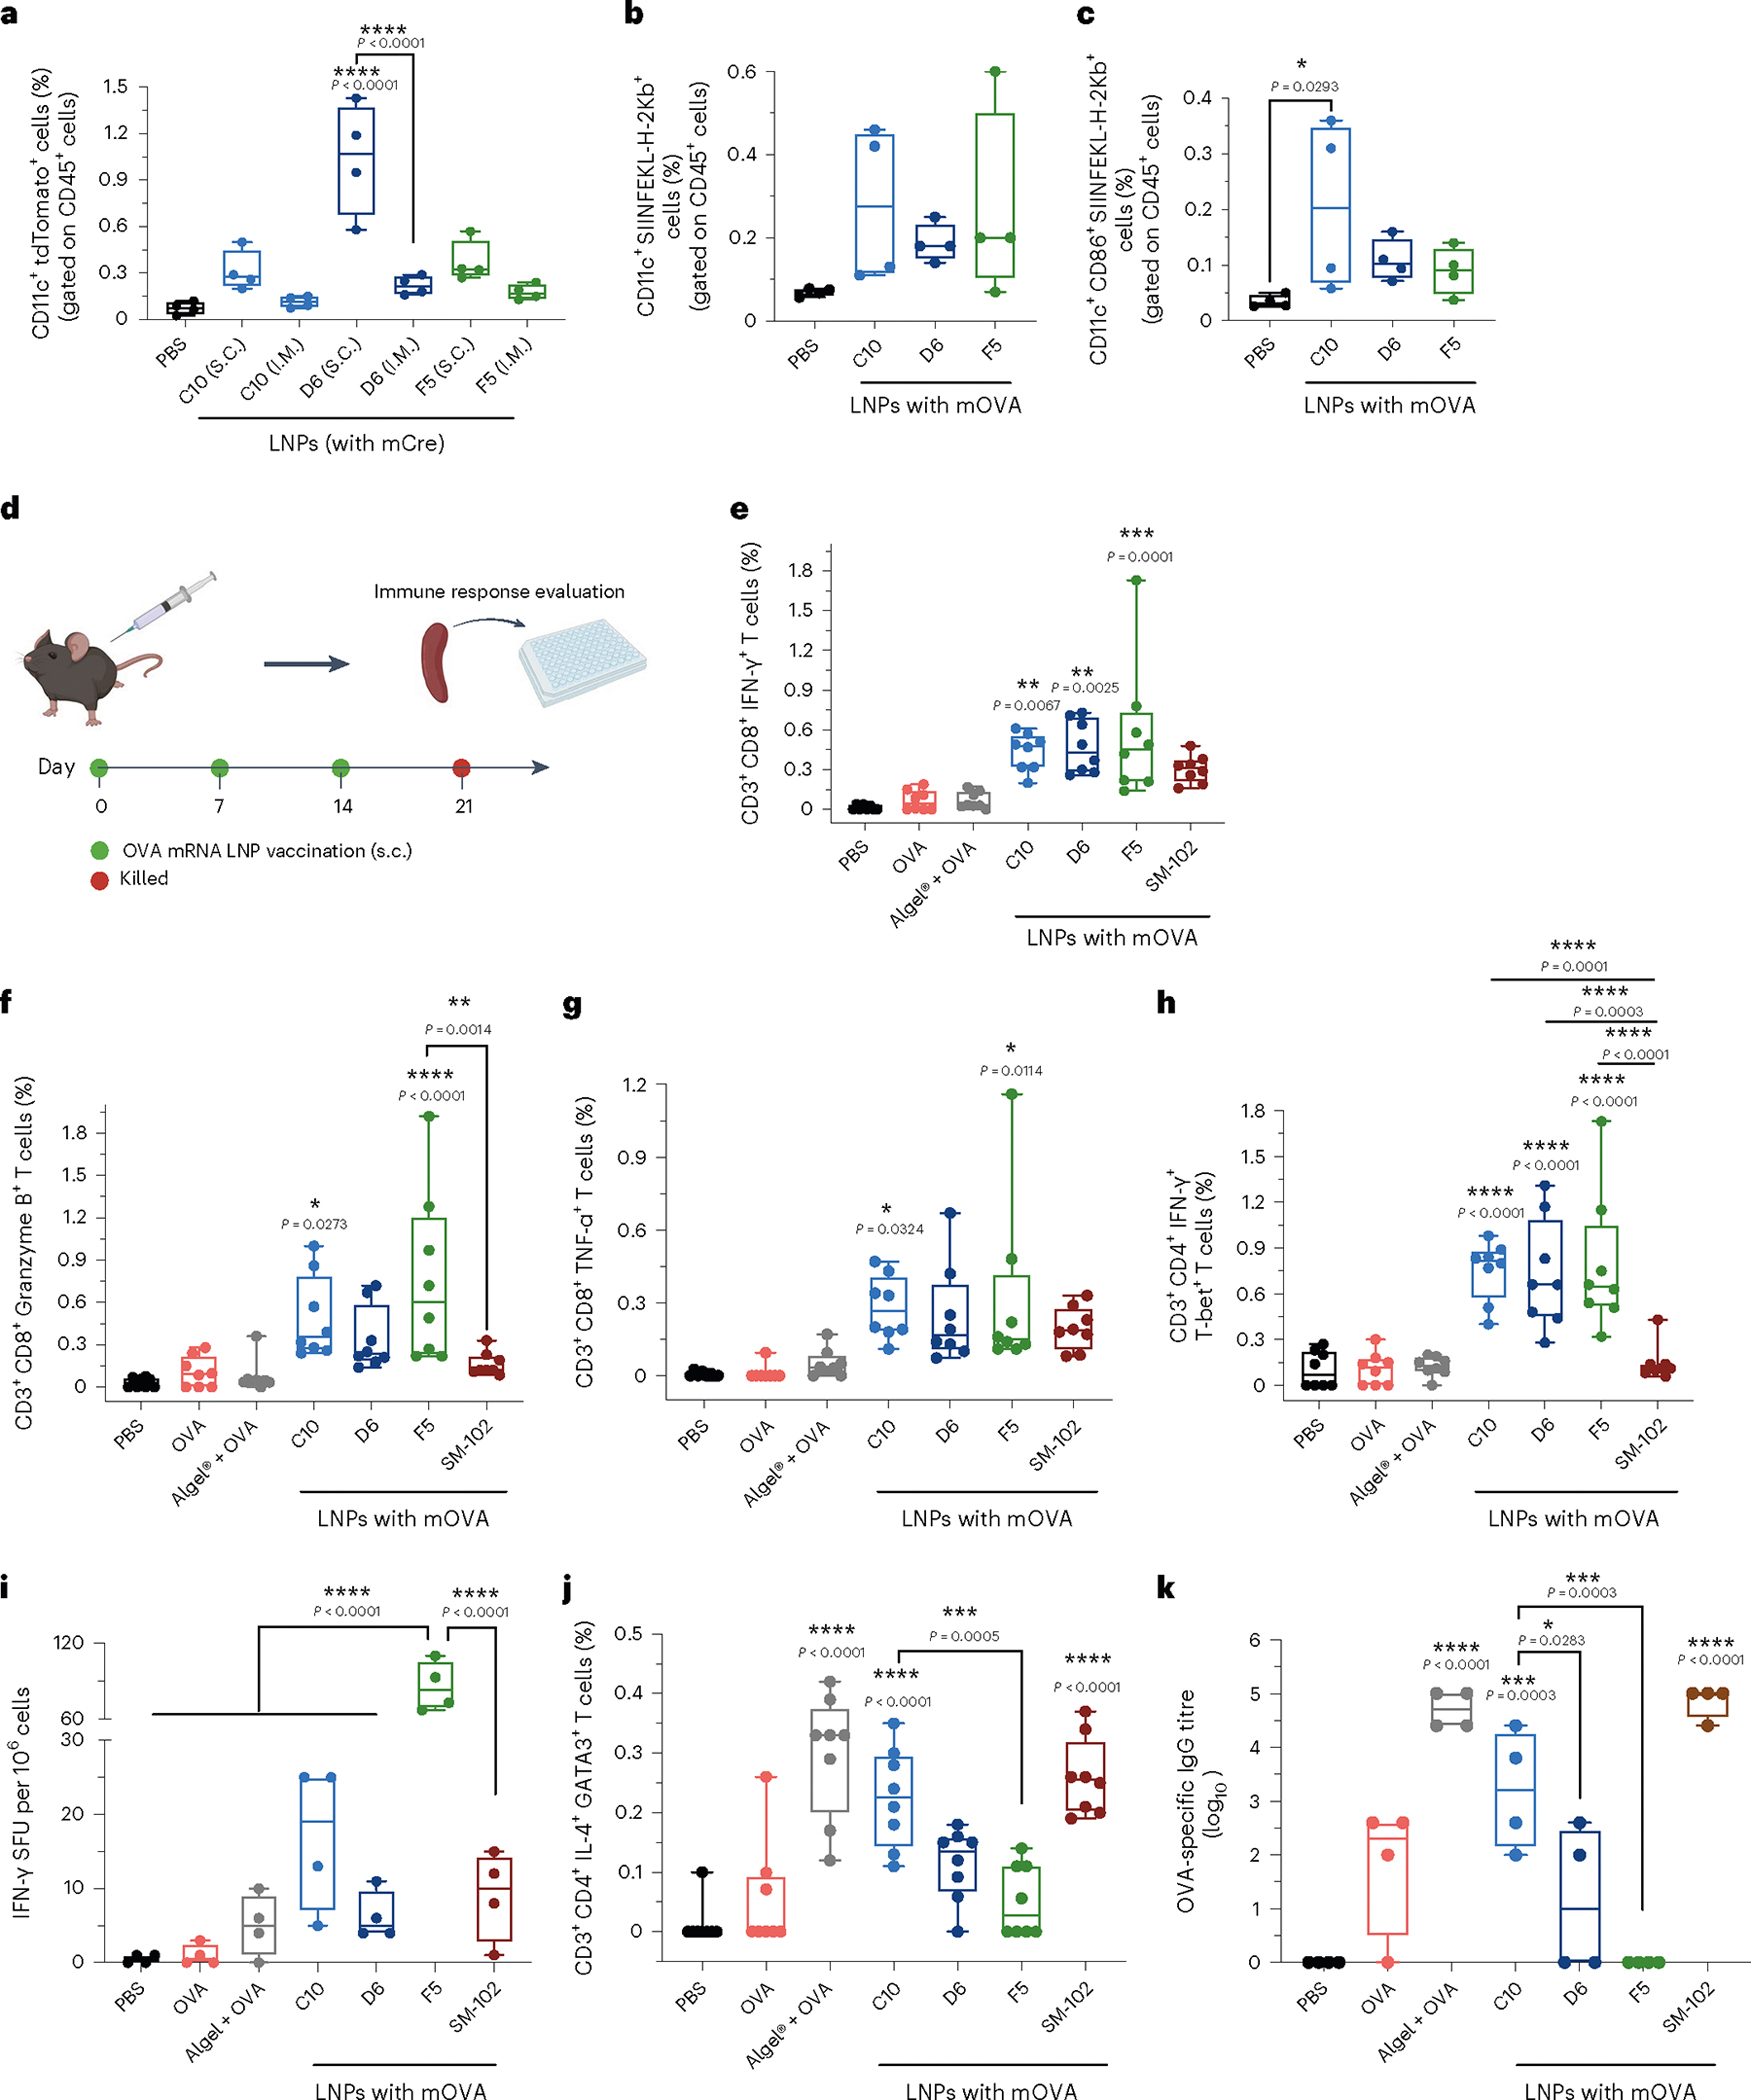
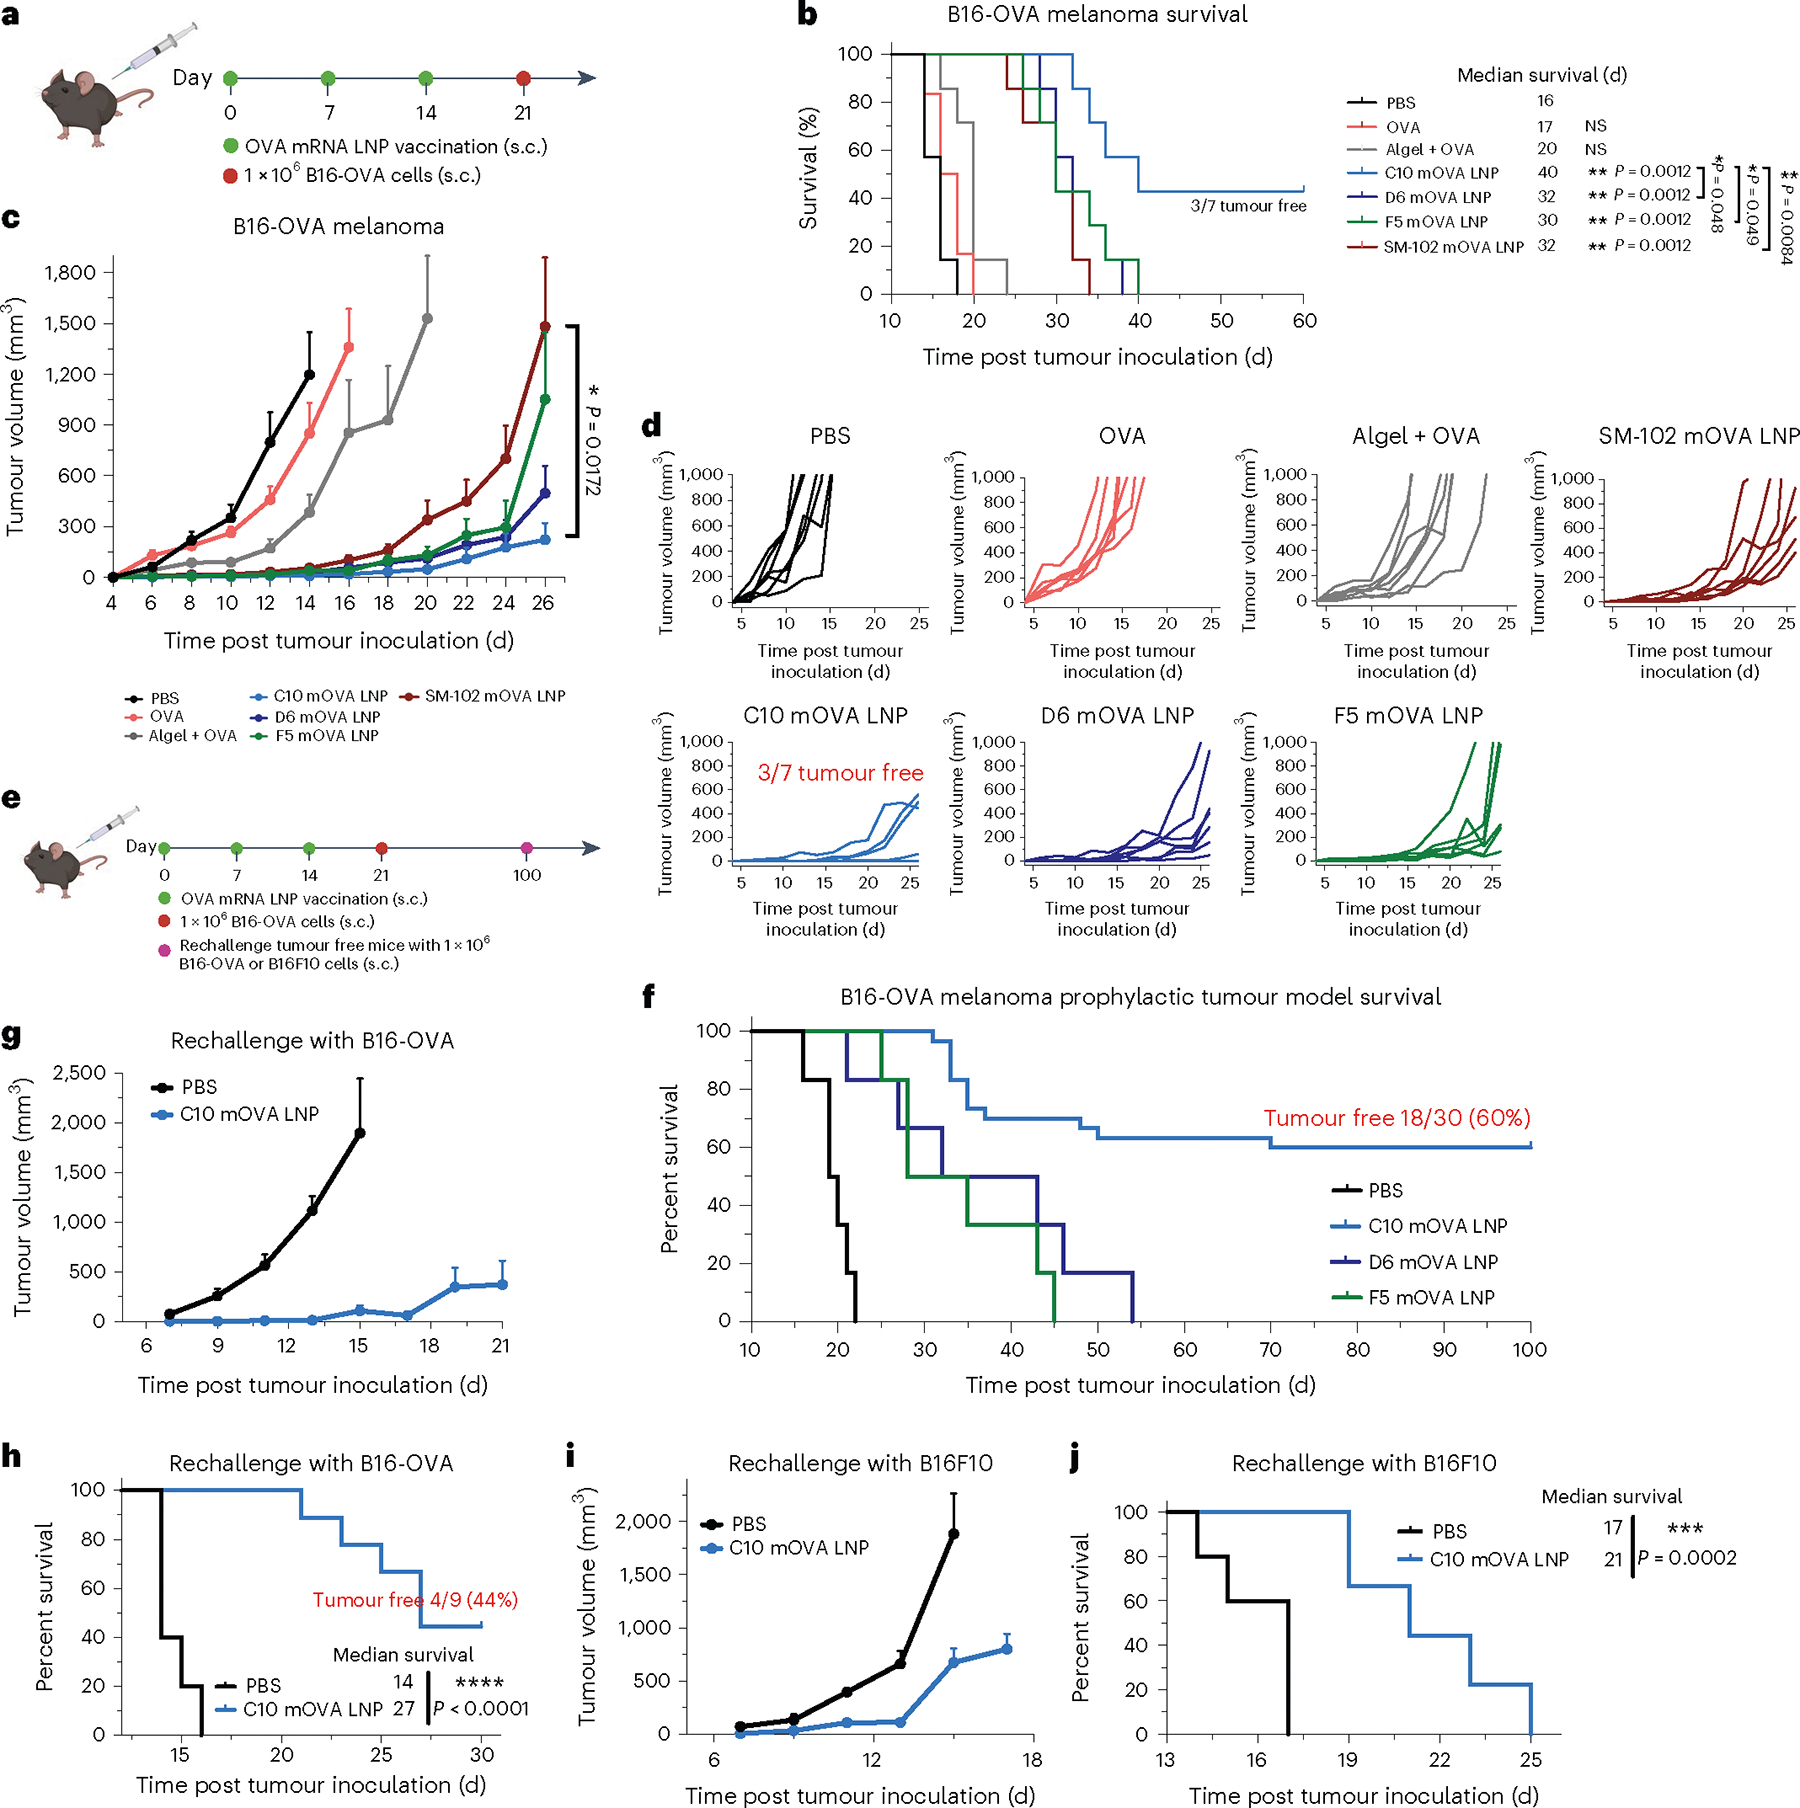
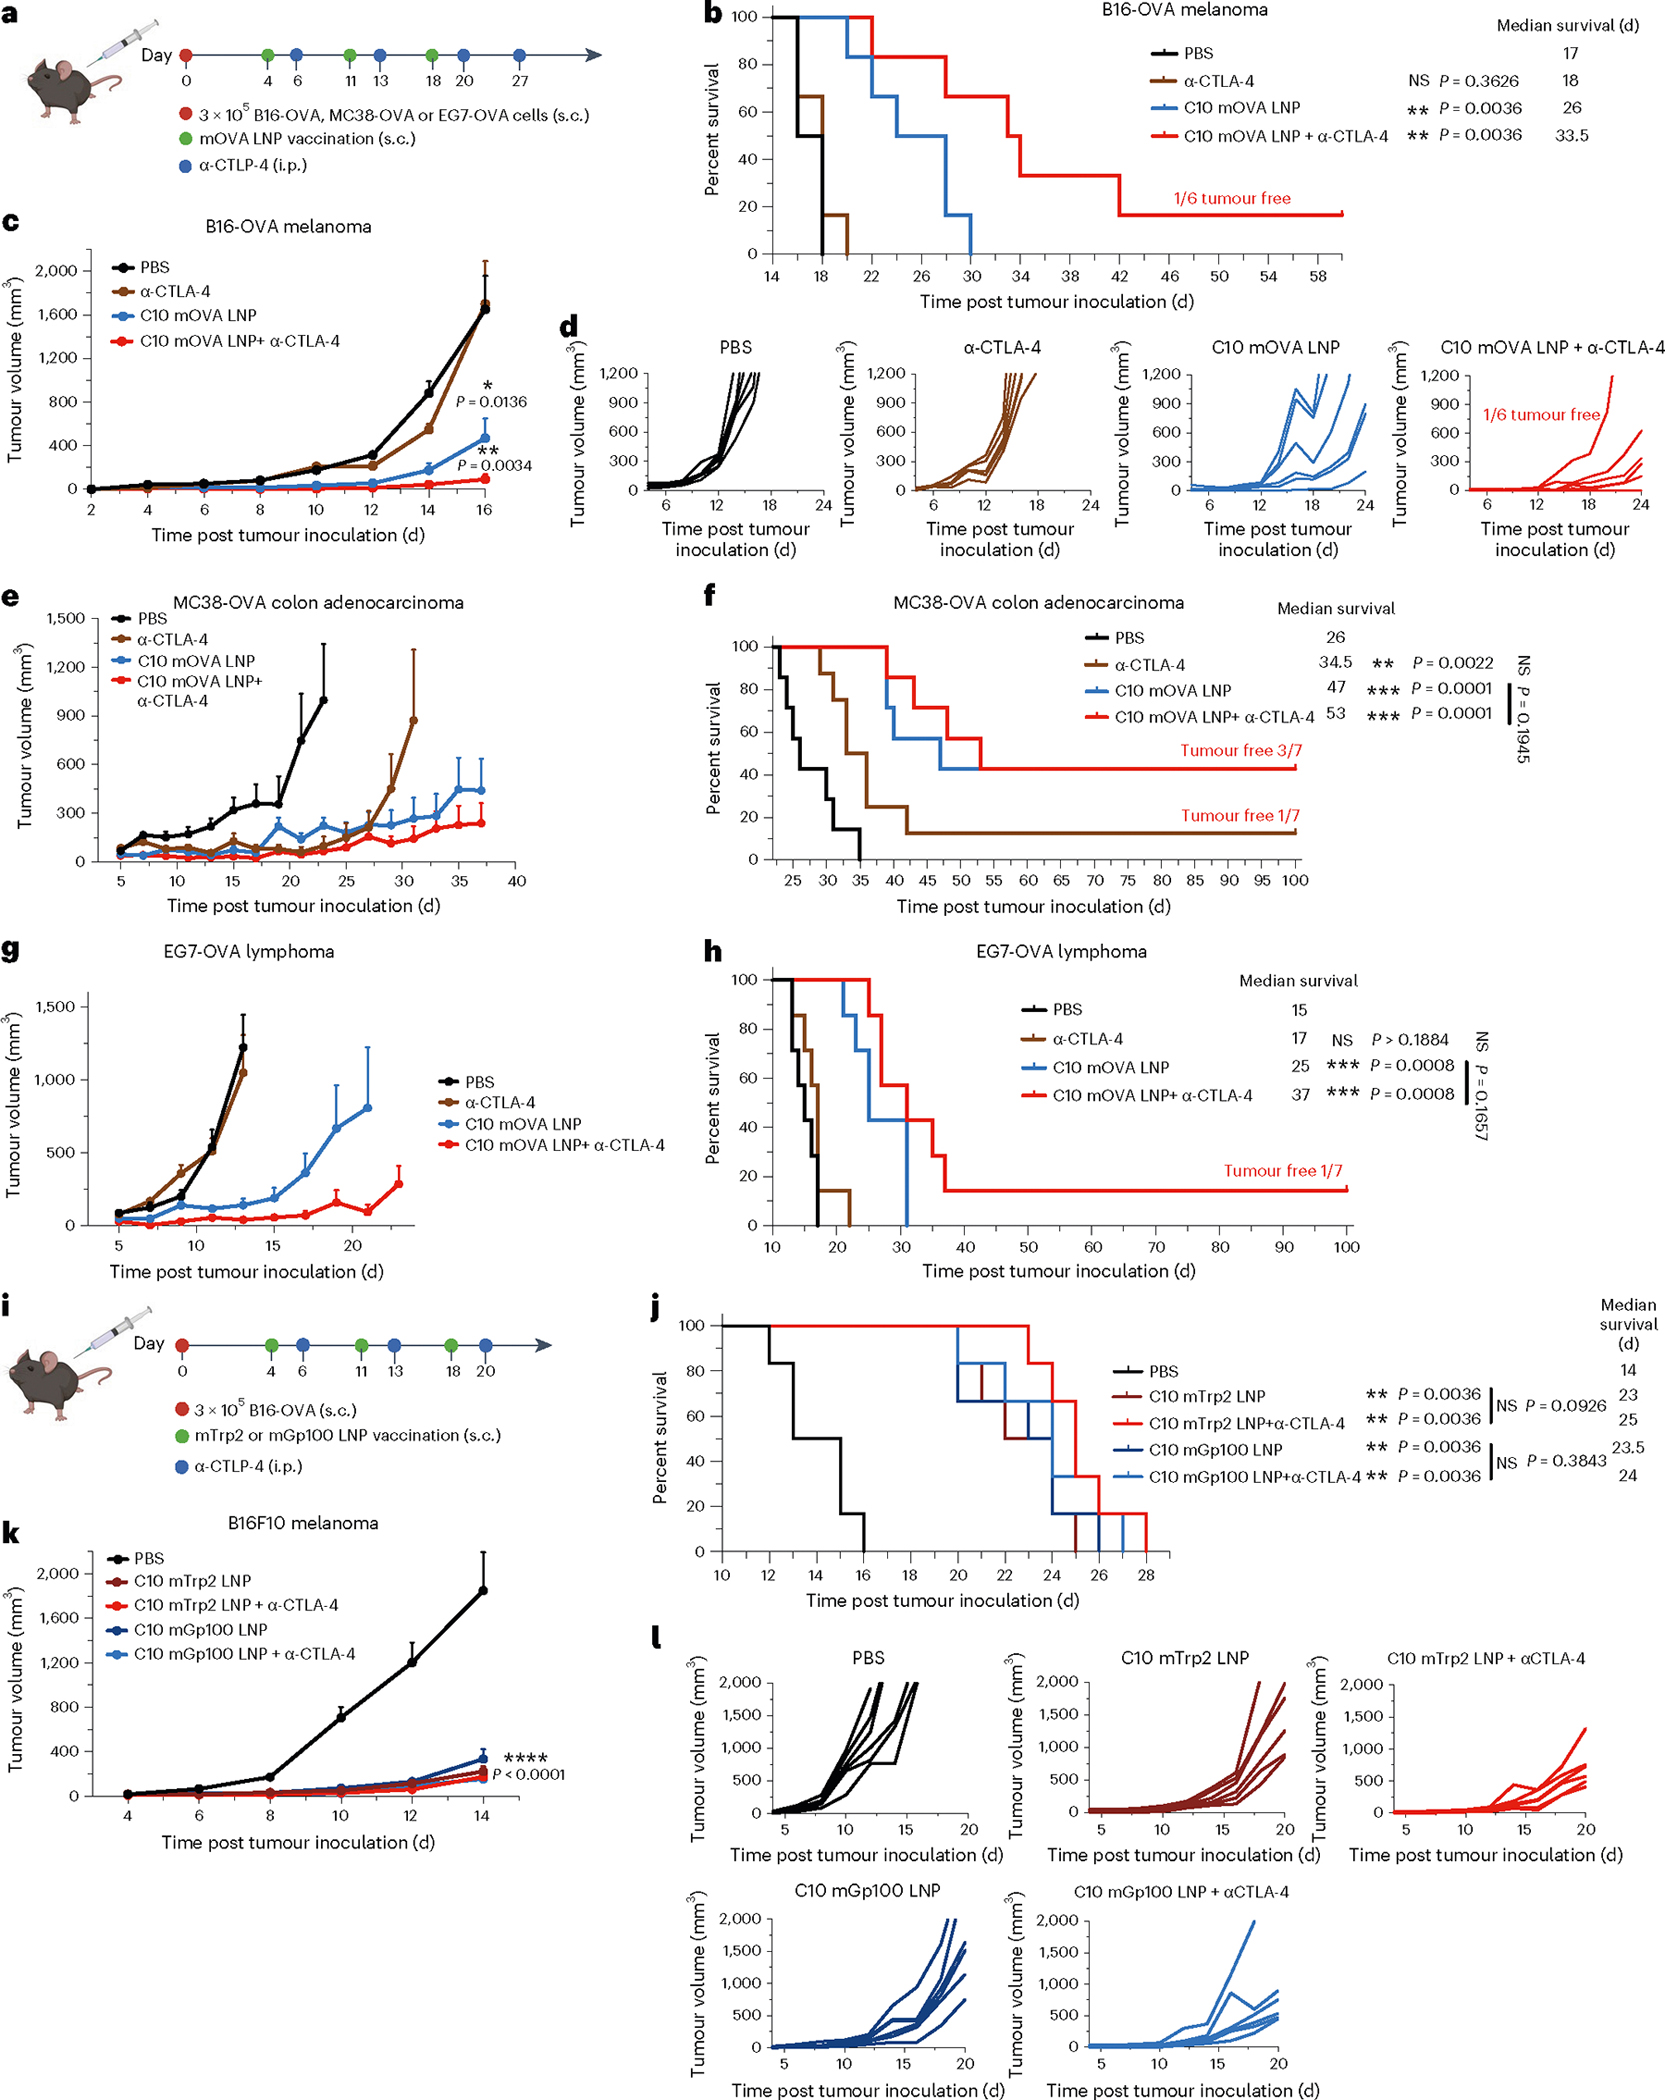
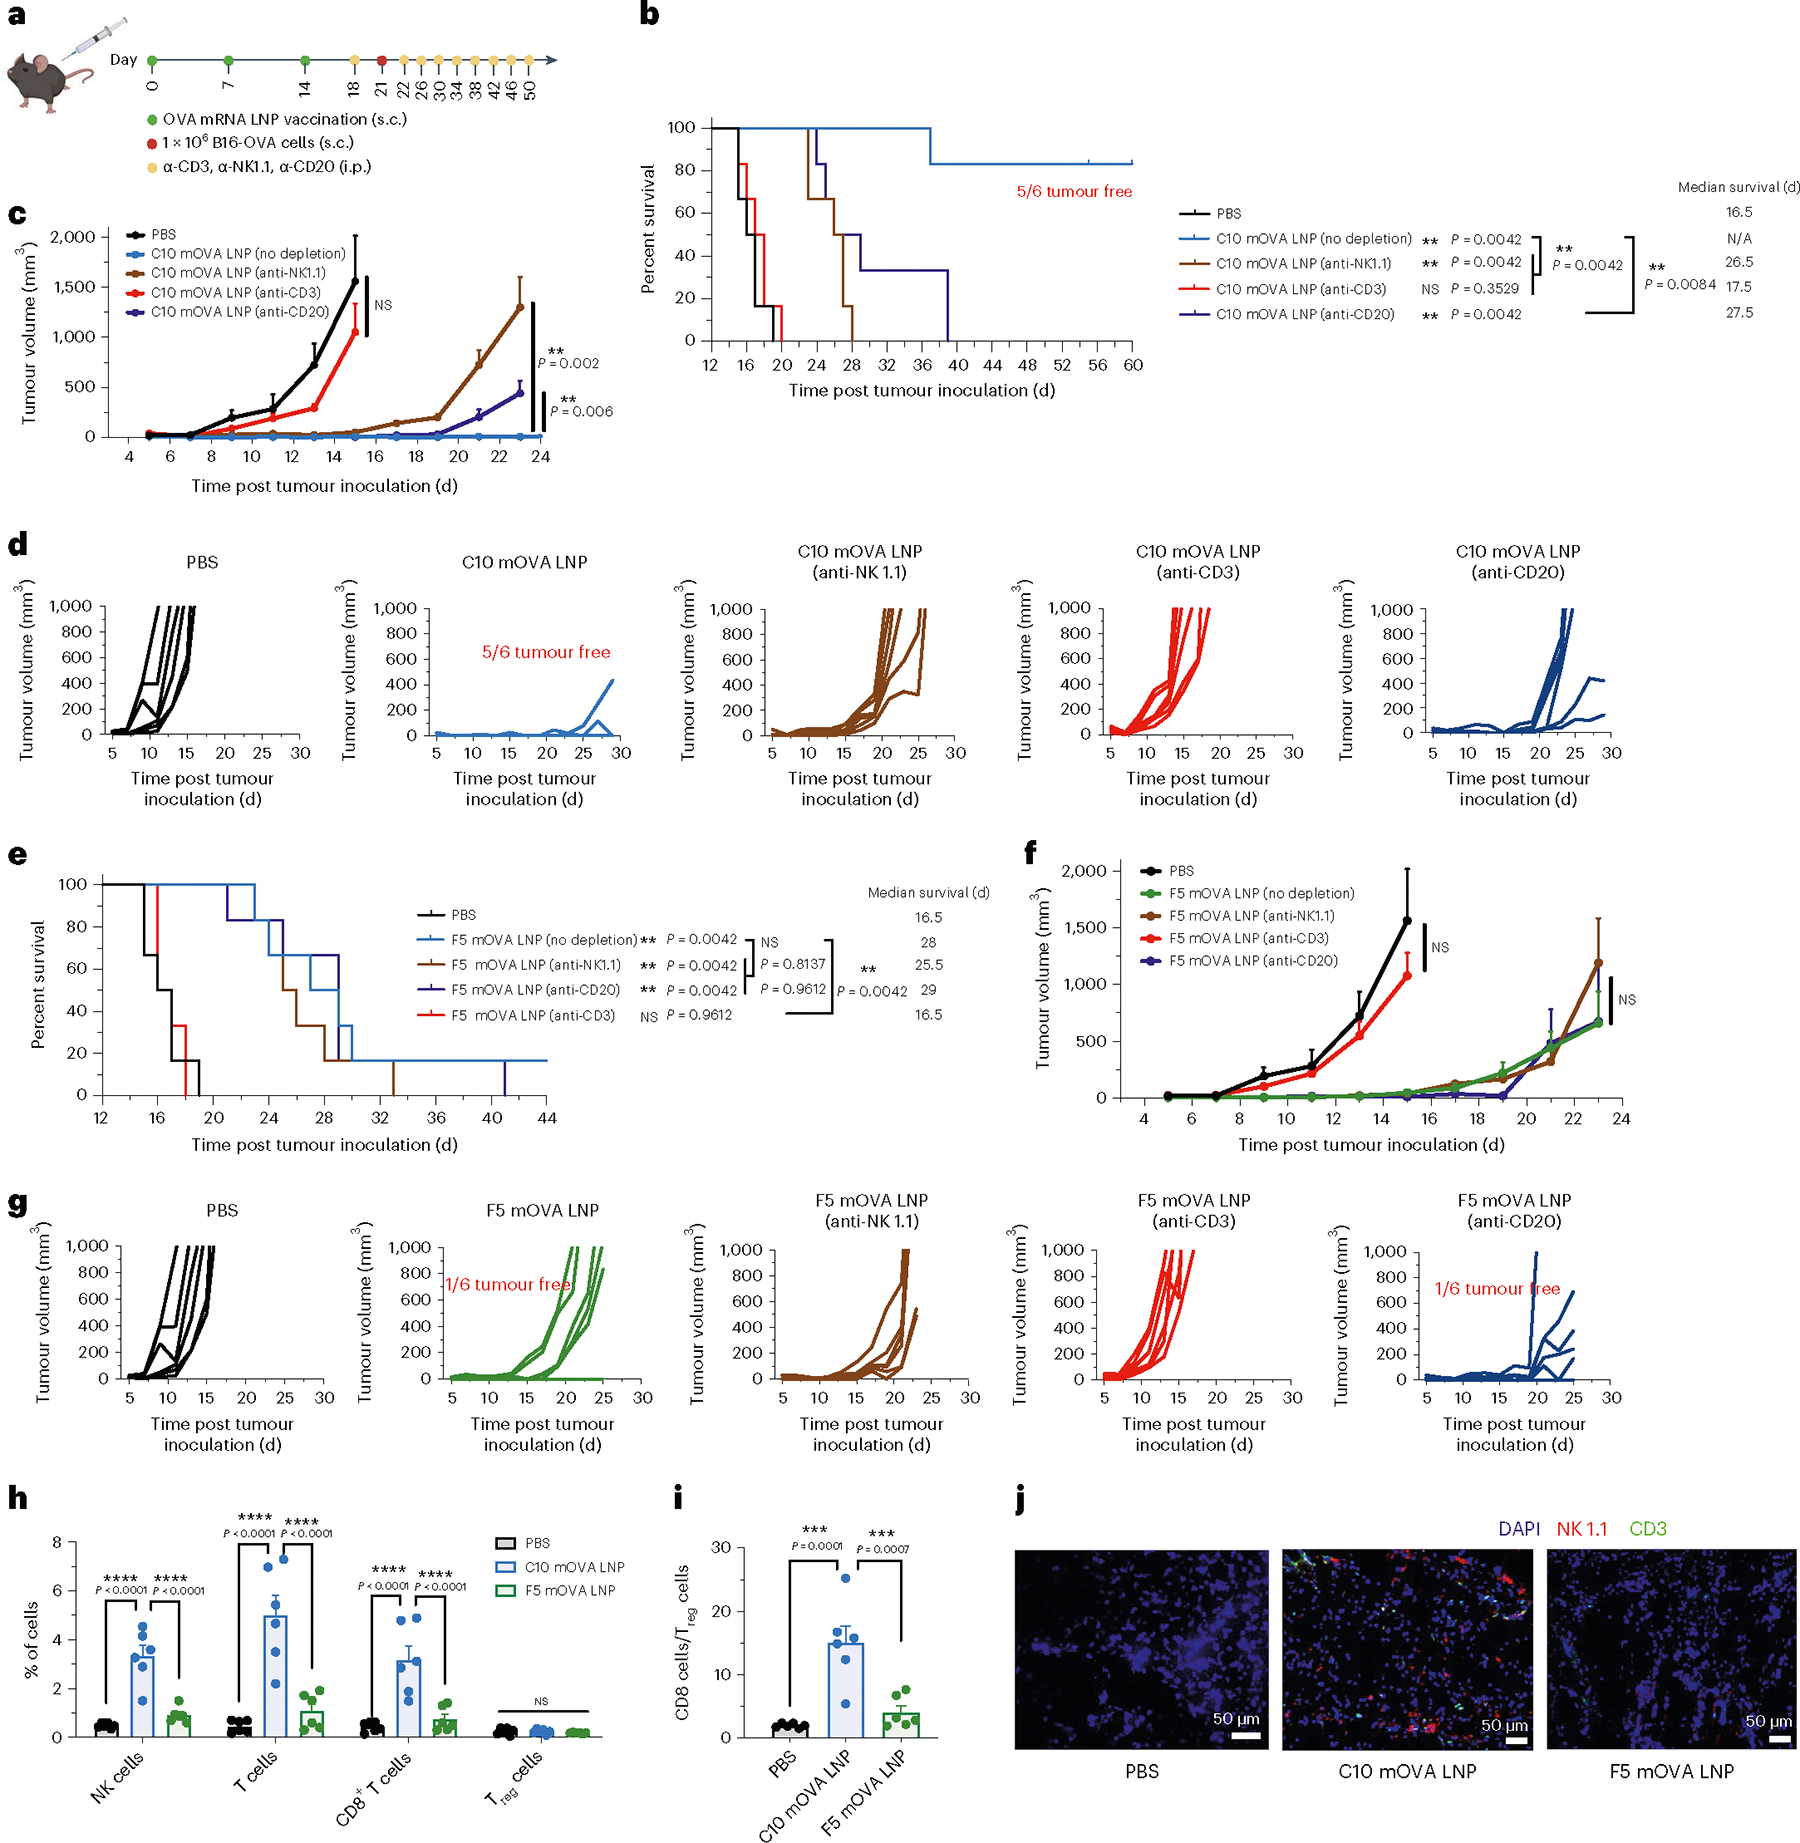
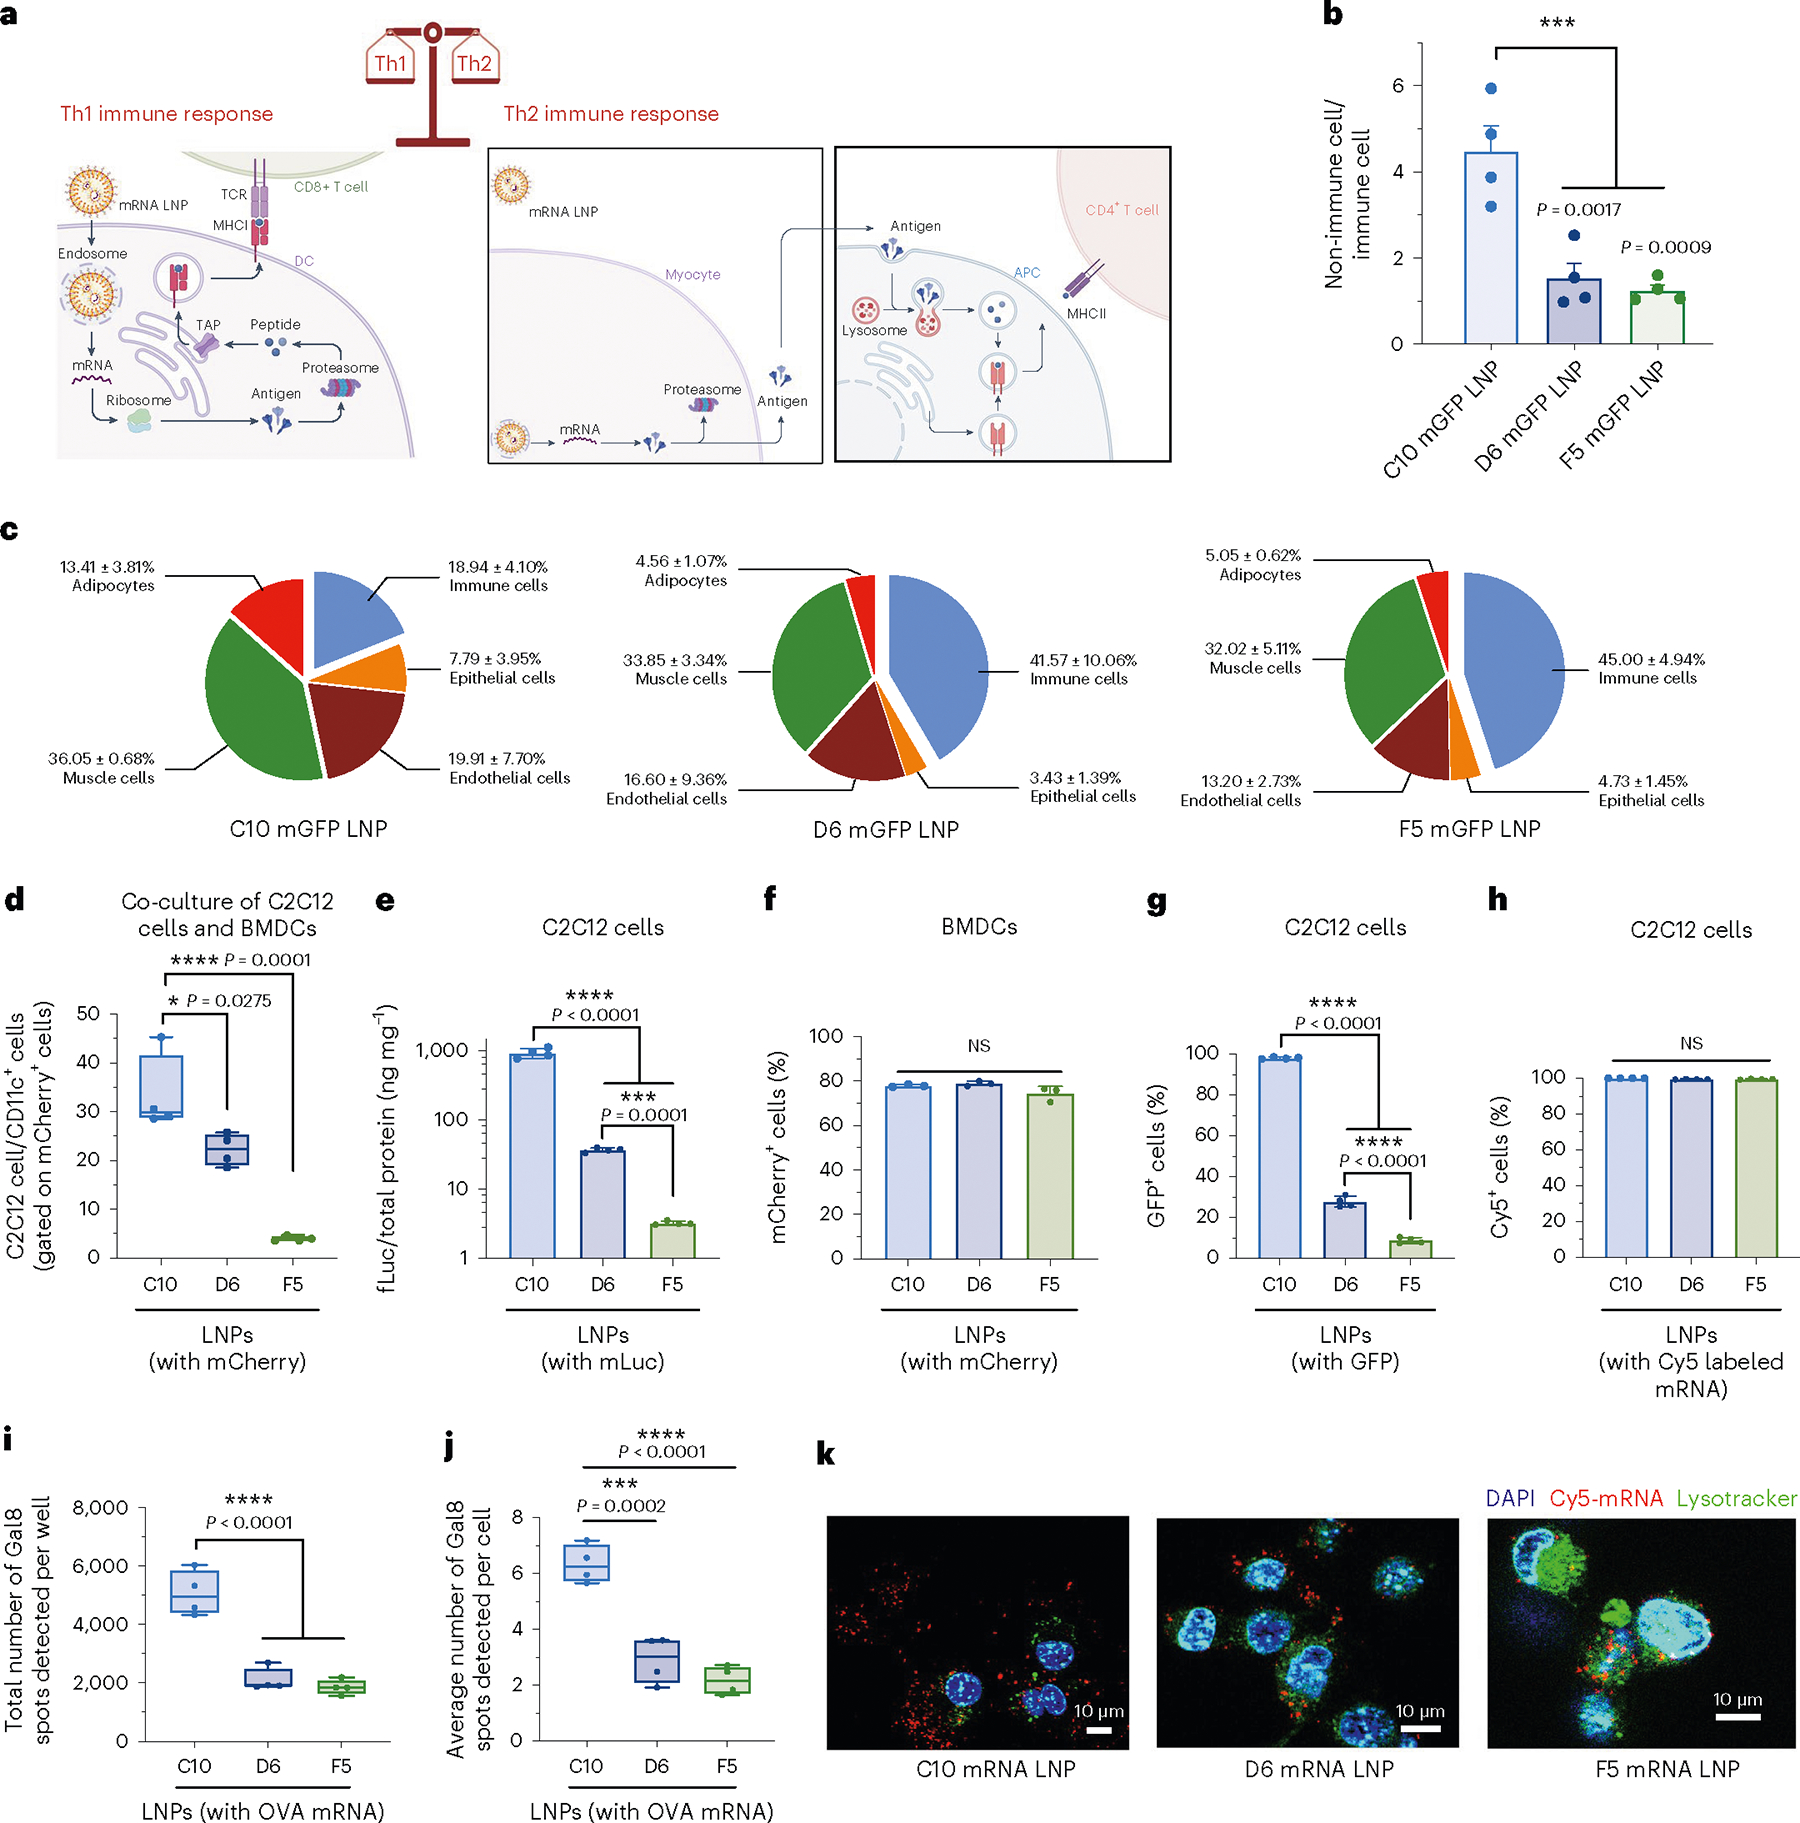
Lipid nanoparticles (LNPs) can be designed to potentiate cancer immunotherapy by promoting their uptake by antigen-presenting cells, stimulating the maturation of these cells and modulating the activity of adjuvants. Here we report an LNP-screening method for the optimization of the type of helper lipid and of lipid-component ratios to enhance the delivery of tumour-antigen-encoding mRNA to dendritic cells and their immune-activation profile towards enhanced antitumour activity. The method involves screening for LNPs that enhance the maturation of bone-marrow-derived dendritic cells and antigen presentation in vitro, followed by assessing immune activation and tumour-growth suppression in a mouse model of melanoma after subcutaneous or intramuscular delivery of the LNPs. We found that the most potent antitumour activity, especially when combined with immune checkpoint inhibitors, resulted from a coordinated attack by T cells and NK cells, triggered by LNPs that elicited strong immune activity in both type-1 and type-2 T helper cells. Our findings highlight the importance of optimizing the LNP composition of mRNA-based cancer vaccines to tailor antigen-specific immune-activation profiles.


Conflict of interest statement

Competing interests

H.-Q.M., Y.Z., J.M, R.S, L.C., I.V. and S.K.R. are co-inventors of a pending patent application (PCT/US2023/016938, filed in March 2023) covering the LNP formulation described in this paper. The patent was filed through Johns Hopkins Technology Ventures and is managed by it. The other authors declare no competing interests.

Figures

Extended Data Fig. 1 |
Extended Data Fig. 1 |. Secretion levels of cytokines within the supernatant of BMDCs after 24 h of incubation.
Secretion levels of IL-6 (a), TNF-α (b) and IFN-γ (c), within the supernatant of BMDCs after 24 h incubation with the three mOVA-loaded LNPs were measured by ELISA. Data are represented as the mean ± s.e.m. Data were analyzed using one-way ANOVA and Dunnett’s multiple comparisons test. *P < 0.05, **P < 0.01, ***P < 0.001; NS, not significant; BMDC, bone marrow derived dendritic cell; ELISA, enzyme-linked immunoassay.
Extended Data Fig. 2 |
Extended Data Fig. 2 |. IL-6 and TNF-α secretion levels from antigenstimulated splenocytes.
Splenocytes were isolated from vaccinated mice and restimulated in vitro with OVA and SIINFEKL peptide (100 μg ml−1 OVA and 2 μg ml−1 SIINFEKL) for 72 h. Secretion levels of IL-6 (a) and TNF-α (b) within the supernatant of were measured by ELISA. ‘Algel+OVA’ stands for Alhydrogel®+OVA group. Data represent the mean ± s.e.m. from a representative experiment (n = 4 biologically independent samples) of two independent experiments. Data were analyzed using one-way ANOVA and Dunnett’s multiple comparisons test. *P < 0.05, **P < 0.01, ***P < 0.001, ****P < 0.0001; NS, not significant; BMDC, bone marrow derived dendritic cell; ELISA, enzyme-linked immunoassay.
Extended Data Fig. 3 |
Extended Data Fig. 3 |. Titres of OVA-specific IgG subclass antibody in blood-serum samples collected on day 21 following immunization.
IgG1 (a) and IgG2a (b) antibodies in blood serum on day 21 were determined by ELISA. ‘Algel+OVA’ stands for Alhydrogel®+OVA group. Data represent the mean ± s.e.m. from a representative experiment (n = 4 biologically independent samples) of two independent experiments. Data were analyzed using one-way ANOVA and Dunnett’s multiple comparisons test. ****P < 0.0001; ELISA, enzyme-linked immunoassay.
Extended Data Fig. 4 |
Extended Data Fig. 4 |. Cytokine levels in the local injection site measured at 4 h or 24 h post-administration of the top-performing LNPs.
ELISA was employed to quantify the cytokine levels, including IFN-γ (a), TNF-α (b), and IL-4 (c), at the local injection site using OVA-encoding mRNA after the administration of three formulations (C10, D6, and F5) at 4 h and 24 h. The local injection sites were collected, homogenized, and subjected to tissue lysis to extract the proteins. The resulting lysate was centrifuged to separate the insoluble cellular debris. The protein concentration in each sample was determined using the BCA assay and normalized accordingly. Data represent the mean ± s.e.m. with n = 4 biologically independent samples. Data were analyzed using one-way ANOVA and Tukey’s multiple comparisons test. *P < 0.05; ***P < 0.001; NS, not significant.
Fig. 1 |
Fig. 1 |. In vitro screening of mRNA lipid nanoparticles for the transfection and induction of antigen presentation and maturation in DCs.
a, Schematic of the screening method and the therapeutic mechanism of mRNA LNP vaccination against a solid tumour. In vitro transfection efficiency was assessed for 1,080 LNP formulations with different helper lipids and component ratios. The top-performing formulations were then tested on BMDCs for transfection and antigen presentation, and in vivo immune responses induced by selected LNPs were assessed. LNPs transfect tissue-resident DCs following s.c. injection, or drain into the neighboring lymph nodes where they transfect APCs including DCs. These APCs translate and process the mRNA into peptides presented on major histocompatibility complex molecules on the cell surface. The lipids also trigger activation pathways that promote co-stimulatory molecule expression and cytokine release. T cells activated by the APCs proliferate and travel to the tumour site to kill cancer cells in an antigen-specific manner. TAP, transporter associated with antigen processing; TCR, T cell receptor; TNF-α, tumour necrosis factor α. b, DC2.4 cells were treated with fLuc mRNA LNPs (1 μg ml−1). The relative luciferase expression after 24 h incubation with fLuc mRNA LNPs is shown in a heat map. c, BMDCs were treated with the 49 top-performing LNPs packaged with mCherry mRNA. The percentage of mCherry+ cells gated on CD11c+ cells after 24 h incubation with mRNA LNPs is shown. LNP formulation details are shown in pie charts with DLin-MC3-DMA in red, cholesterol in green, DMG-PEG2000 in yellow and helper lipids in blue. The top seven formulations, indicated by red arrows, were selected for further study. df, Antigen presentation (d), with maturation levels of BMDCs (e,f) were analysed by flow cytometry after 24 h incubation with the seven mOVA-loaded LNPs, PBS, free OVA, or LPS and SIINFEKL peptide. The percentages of SIINFEKL-H-2Kb+ cells (d), additionally positive for CD86 (e) or CD40 (f) gated on CD11c+ cells are shown. g, Representative flow cytometry analysis of SIINFEFL-H-2Kb and CD40 expression on BMDCs treated with the three top-performing LNPs. h, Secretion levels of IFN-γ, TNF-α and IL-6 within the supernatant of BMDCs after 24 h incubation with the three mOVA-loaded LNPs were measured by ELISA and are shown in a radar chart. Data represent the mean ± s.e.m. from a representative experiment (n = 3 (bg), n = 4 (h) biologically independent samples) of two independent experiments. Data were analysed using one-way ANOVA and Dunnett’s multiple comparisons test against the PBS control group. *P < 0.05, **P < 0.01, ***P < 0.001, ****P < 0.0001; NS, not significant.
Fig. 2 |
Fig. 2 |. In vivo assessments of lymph-node-cell transfection and immune activation by the top 3 LNP formulations.
a, Ai9 mice were administered the top 3 LNPs loaded with mCre via i.m. and s.c. injections (10 μg mCre per mouse). Transfection of immune cells in draining lymph nodes was analysed by flow cytometry. Percentages of cells positive for tdTomato as well as CD11c gated on CD45+ cells are shown. Gating strategy is shown in Supplementary Fig. 4. b,c, C57BL/6 mice were administered PBS or C10, D6 or F5 LNPs loaded with mOVA via s.c. injection. DC antigen presentation (b), with maturation levels (c) in the draining lymph nodes were analysed using flow cytometry after 3 d following a single dosage of mRNA LNPs. Cells positive for CD11c and SIINFEKL-H-2Kb (b), as well as CD86 (c) are shown. Gating strategy is shown in Supplementary Fig. 6. d, Timeline for the immune activation experiment. C57BL/6 mice were given three s.c. injections, 1 week apart, of PBS, free OVA protein, or C10, D6 or F5 LNPs loaded with mOVA (10 μg OVA protein or 10 μg mOVA per injection). Mice were killed 1 week after the final injection, and their splenocytes and lymphocytes were isolated for analysis. eh, C57BL/6 mice were administered with PBS, free OVA protein, OVA protein mixed with aluminum hydroxide gel (Alhydrogel) (1:1), or C10, D6, F5 or SM-102 LNPs loaded with mOVA via s.c. injection (10 μg OVA protein or 10 μg mOVA per injection). Splenocytes were restimulated in vitro with OVA and SIINFEKL peptide (100 μg ml−1 OVA and 2 μg ml−1 SIINFEKL) for 6 h and assessed via flow cytometry and intracellular cytokine staining to determine the percentages of CD3+CD8+IFN-γ+ (e), CD3+CD8+Granzyme B+ (f), CD3+CD8+TNFα+ (g) and CD3+CD4+IFNγ+T-bet+ (h) cells. i, Frequency of IFN-γ-producing cells in spot-forming unit (SFU) among restimulated splenocytes, assessed via ELISpot. j, Percentage of restimulated splenocytes positive for CD3, CD4, IL-4 and GATA-3, assessed by flow cytometry and ICS and representing Th2 cells. Gating strategy is shown in Supplementary Figs. 7–12 and 14. k, Titres of OVA-specific IgG antibodies in blood serum on day 21, determined by ELISA. Data represent the mean ± s.e.m. from a representative experiment (n = 4 (ac,i,k) biologically independent samples of two independent experiments, n = 8 (eh,j) biologically independent samples of three independent experiments). Data were analysed using one-way ANOVA and Tukey’s multiple comparisons test for ac, and ek. For boxplots, the box extends from the 25th to the 75th percentiles and the line in the middle of the box is plotted at the median. *P < 0.05, **P < 0.01, ***P < 0.001, ****P < 0.0001.
Fig. 3 |
Fig. 3 |. Antitumour efficacy of top mRNA LNP formulations as prophylactic vaccines.
ad, Schematic and results of a prophylactic vaccination model for OVA-expressing melanoma in C57BL/6 mice. Mice were given three s.c. injections (10 μg mOVA per injection), 1 week apart, of PBS, free OVA protein, OVA protein mixed with Alhydrogel (1:1) or mOVA-loaded C10, D6, F5 or SM-102 LNPs before s.c. inoculation of OVA-expressing melanoma (B16-OVA) cells (a). Survival curves (b), average tumour volume (c) and individual tumour volume (d) over time are shown. ej, Schematic and results of a prophylactic vaccination and rechallenge model for B16-OVA in C57BL/6 mice. Mice were vaccinated as described above before s.c. inoculation of OVA-expressing melanoma (B16-OVA) cells. After 100 d, the tumourfree mice were rechallenged with either B16-OVA or B16F10 cells, and mice at a similar age were included as a control group injected with PBS (e). Survival curves (f,h,j) and average tumour volume (g,i) are shown. In bd, data represent mean ± s.e.m. from a representative experiment (n = 7 biologically independent samples) of two independent experiments. In f, data represent mean ± s.e.m.; n = 30 for the C10 mOVA LNP group and for other groups, n = 6 biologically independent samples. In gj, data represent mean ± s.e.m.; n = 9 biologically independent samples for the C10 mOVA LNP group and n = 5 for the PBS control group. Differences between treatment groups were analysed using one-way ANOVA and Tukey’s multiple comparisons test. Survival curves were compared using log-rank Mantel–Cox test, and the stack of P values were corrected using the Holm-Šídák method for multiple comparisons with α set at 0.05. *P < 0.05, **P < 0.01, ***P < 0.001, ****P < 0.0001.
Fig. 4 |
Fig. 4 |. Antitumour efficacy of the top mRNA LNP formulations as therapeutic vaccines.
ah, Schematic and results of a therapeutic vaccination model for B16-OVA, MC38-OVA and EG7-OVA in C57BL/6 mice. Mice were inoculated s.c. with B16-OVA, MC38-OVA or EG7-OVA cells and then given three s.c. injections, 1 week apart, of mOVA-loaded C10 (10 μg mOVA per injection) or PBS. Two groups received a repeated anti-CTLA-4 mAb (100 μg per i.p. injection) treatment alone or in combination with the LNPs (a). Survival curves (b,f,h), average tumour volumes (c,e,g) and individual tumour volumes (d) are shown. i–l, Schematic and results of a therapeutic vaccine against melanoma-associated antigens for melanoma in C57BL/6 mice. Mice were inoculated s.c. with B16F10 cells and then given three s.c. injections, 1 week apart, of PBS or C10 LNP loaded with mRNA encoding Trp2 (mTrp) or Gp100 (mGp100) (10 μg mRNA per injection). Two groups received the anti-CTLA-4 mAb (100 μg per i.p. injection) treatment in combination with LNP treatment (i). Survival curves (j), average tumour volumes (k) and individual tumour volumes (l) are shown. Data represent mean ± s.e.m. with n = 7 (eh) and n = 6 (ad, il) biologically independent samples. Differences between treatment groups were analysed using one-way ANOVA and Tukey’s multiple comparison tests. Survival curves were compared using log-rank Mantel–Cox test and P values were corrected using the Holm-Šídák method for multiple comparisons with α set at 0.05. *P < 0.05, **P < 0.01, ***P < 0.001, ****P < 0.0001; αCTLA-4, anti-CTLA-4 mAb.
Fig. 5 |
Fig. 5 |. A coordinated attack by T cells and NK cells was responsible for long-term protection.
ag, Schematic and results of cell depletion experiments in the prophylactic vaccination model for OVA-expressing melanoma in C57BL/6 mice. Mice were given three s.c. injections, 1 week apart, of PBS or mOVA-loaded C10 or F5 LNPs (10 μg mOVA per injection) before s.c. inoculation of B16-OVA cells, and antibody for cell depletion were injected every 4 d (i.p., 200 μg per mice) (a). Survival curves (b,e), average tumour volumes (c,f) and individual tumour volumes (d,g) over time are shown (n = 6 biologically independent mice per group). h, Tumour-infiltrating immune cells including NK cells, T cells, CD8+ T cells and Treg cells were determined by flow cytometry on day 22 post tumour inoculation (n = 6 per group). i, Ratio of CD8+ T cell percentage to CD4+FoxP3+CD25+ Treg cell percentage on day 22 post tumour inoculation (n = 6 per group). j, Immunofluorescent analysis of CD3 T cell and NK-cell infiltration of tumour section on day 22 post tumour inoculation. Blue, DAPI; green, CD3; red, NK 1.1. Data represent the mean ± s.e.m. Differences between treatment groups were analysed using one-way ANOVA and Tukey’s multiple comparisons test. Survival curves were compared using log-rank Mantel–Cox test and P values were corrected using the Holm-Šídák method for multiple comparisons with α set at 0.05. **P < 0.01, ***P < 0.001, ****P < 0.0001.
Fig. 6 |
Fig. 6 |. Local transfection, cellular uptake and endosomal escape of mRNA LNPs.
a, Schematic of different immune responses induced by mRNA LNPs. Transfected APCs translate, process and present antigen epitopes on MHC-I molecules to CD8+ T cells, while transfected non-APCs such as myocytes translate and release antigen for APCs to internalize and present antigen epitopes on MHC-II molecules to helper T cells. Some exogenous antigens are uptaken and presented on MHC-I molecules by the cross-presentation pathway. b,c, Makeup of transfected cells at the injection sites at 24 h post injection with GFP mRNA (mGFP)-loaded C10, D6 and F5 formulations. Flow cytometry was used to determine the ratios of non-immune and immune cells (b) and the relative abundance of each cell type (c). Immune cells, CD45+; epithelial cells, CD326+; endothelial cells, CD31+; muscle cells, desmin+; adipocytes, CD45CD31CD36+. dh, In vitro evaluation of transfection or uptake efficiency by formulations C10, D6 and F5 in C2C12 cells and BMDCs. Flow cytometry was used to determine the ratios of mCherry mRNA-transfected C2C12 cells to transfected BMDCs in in vitro co-culture (d), transfection efficiency of LNPs containing fLuc mRNA in pure C2C12 cell culture (e), transfection efficiency of LNPs containing mCherry mRNA in pure BMDCs (f), transfection efficiency of LNPs containing mGFP in pure C2C12 cells (g) and uptake efficiency of LNPs containing Cy5-labelled mRNA in C2C12 cells (h). i,j, Quantitative Cellomics HCA of endosomal escape by different LNPs using C2C12-Gal8-GFP cells. Total number of Gal8 spots per well (i) or average number of Gal8 spots per cell as an indication of endosomal escape level (j). k, LysoTracker was used to identify the co-localization of fluorescent labelled lysosomes (Lysotracker) and LNPs containing Cy5-labelled mRNA in C2C12 cells in vitro. Data represent the mean ± s.e.m. from a representative experiment (n = 4 biologically independent samples for bj) of two independent experiments. For boxplots, the box extends from the 25th to the 75th percentiles and the line in the middle of the box is plotted at the median. *P < 0.05, ***P < 0.001, ****P < 0.0001.

References

    1. Huang Q, Zeng J & Yan J COVID-19 mRNA vaccines. J. Genet. Genomics 48, 107–114 (2021). - PMC - PubMed
    1. Huang S, Zhu Y, Zhang L & Zhang Z Recent advances in delivery systems for genetic and other novel vaccines. Adv. Mater. 34, e2107946 (2022). - PubMed
    1. Wouters OJ et al. Challenges in ensuring global access to COVID-19 vaccines: production, affordability, allocation, and deployment. Lancet 397, 1023–1034 (2021). - PMC - PubMed
    1. Sahin U et al. BNT162b2 vaccine induces neutralizing antibodies and poly-specific T cells in humans. Nature 595, 572–577 (2021). - PubMed
    1. Wang Z et al. mRNA vaccine-elicited antibodies to SARS-CoV-2 and circulating variants. Nature 592, 616–622 (2021). - PMC - PubMed

MeSH terms

LinkOut - more resources