. 2024 Jun;47(3):897-915.
doi: 10.1007/s13402-023-00903-9. Epub 2023 Dec 12.

CSGALNACT2 restricts ovarian cancer migration and invasion by modulating MAPK/ERK pathway through DUSP1

Affiliations

CSGALNACT2 restricts ovarian cancer migration and invasion by modulating MAPK/ERK pathway through DUSP1

Mingjun Ma et al. Cell Oncol (Dordr). 2024 Jun.

Abstract

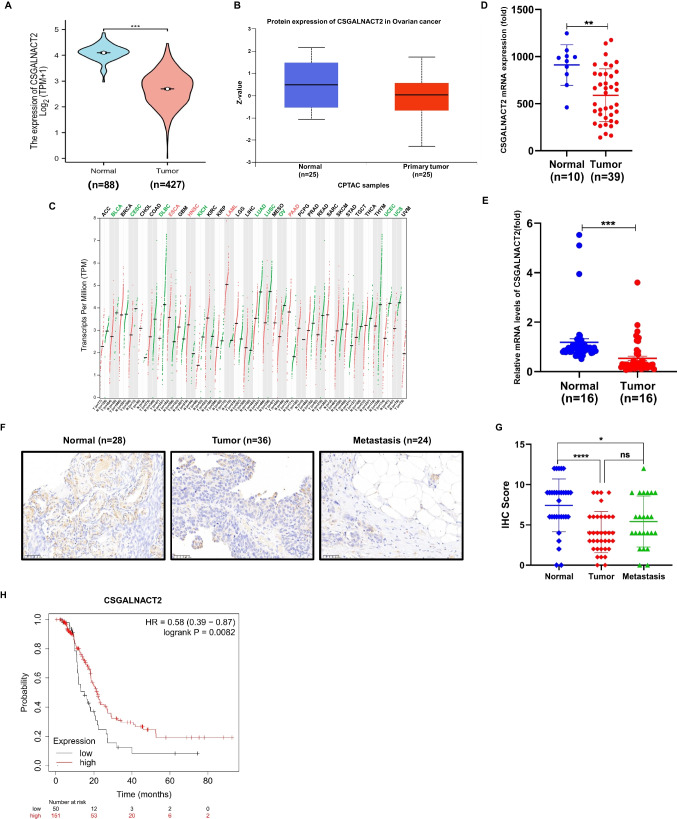
Purpose: Ovarian cancer is one of the leading causes of cancer-related death among women. CSGALNACT2 is a vital Golgi transferase and is related to a variety of human diseases. However, its expression pattern and function in ovarian cancer remain uncertain.

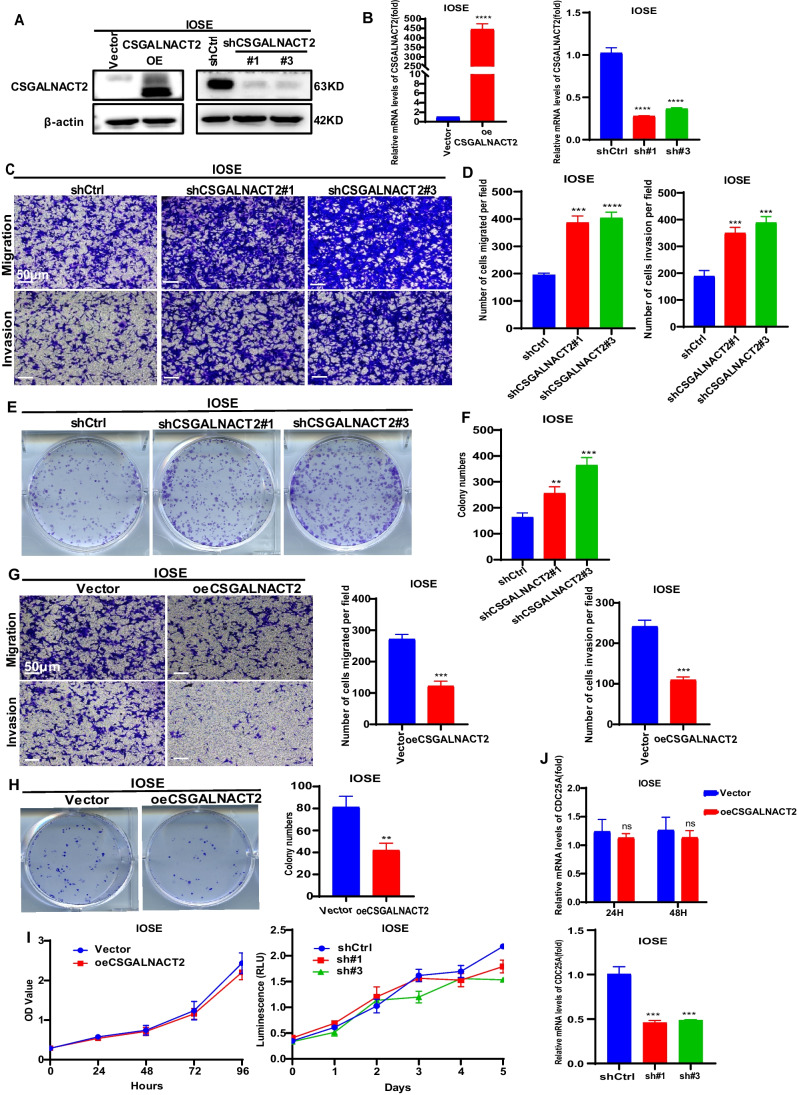
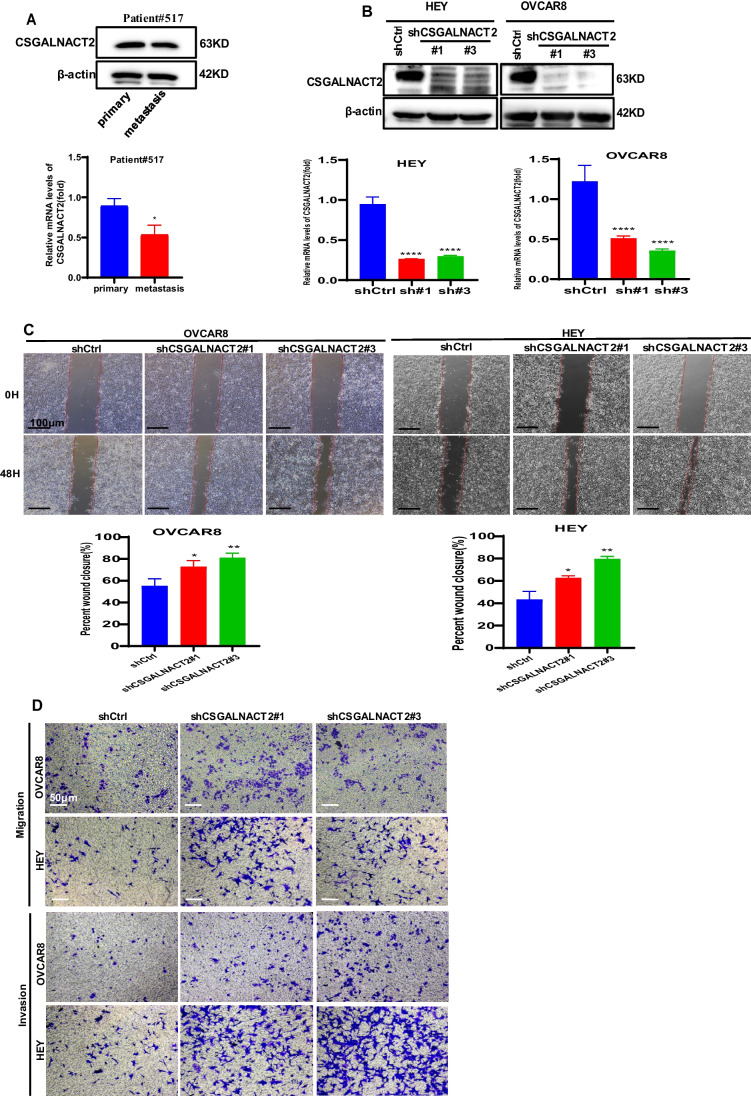
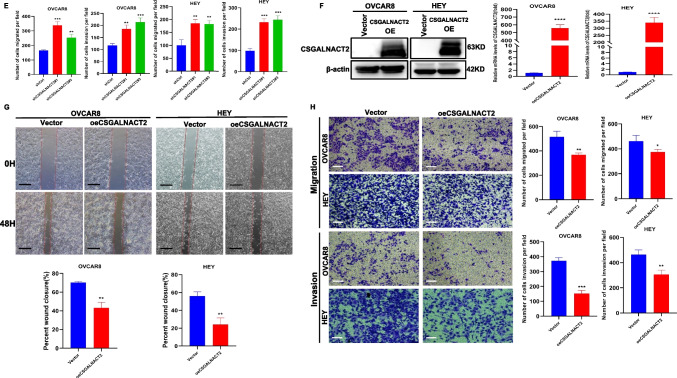
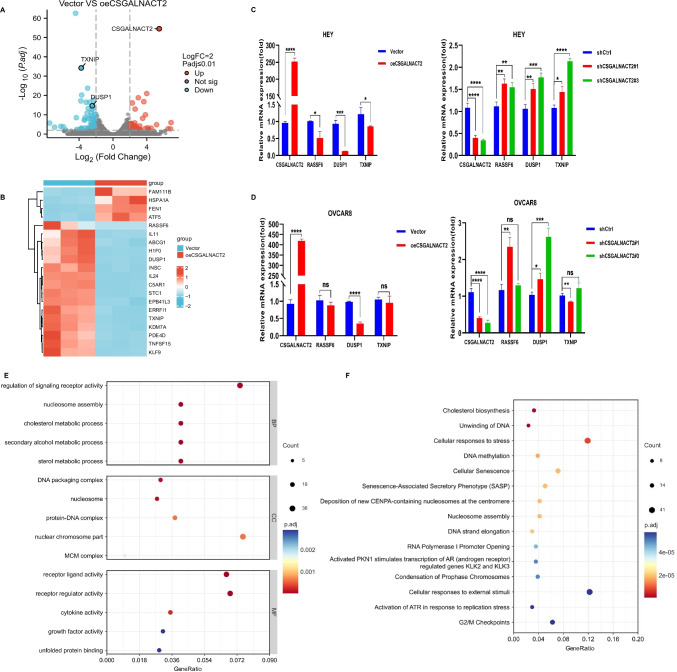
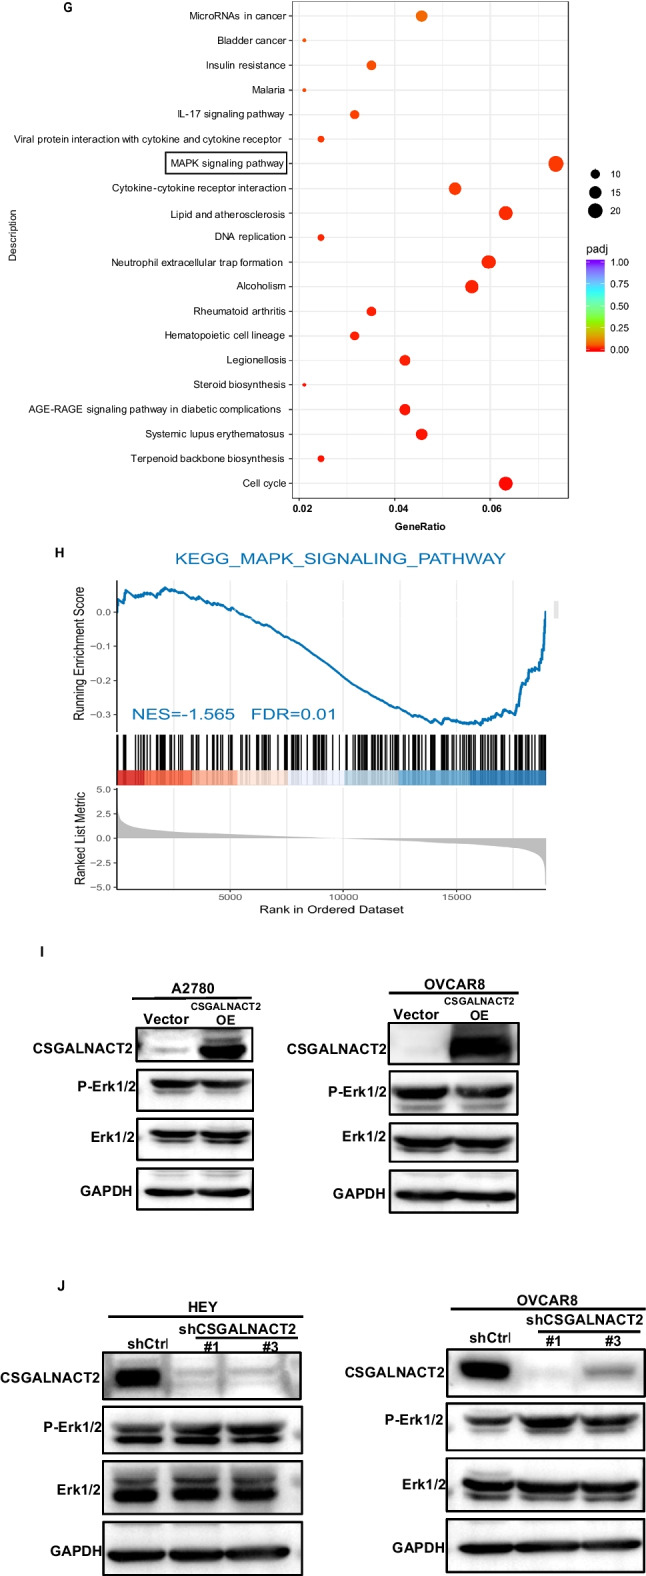
Methods: The Cancer Genome Atlas and GEPIA databases were used to assess the expression of CSGALNACT2 in ovarian cancer patients. RNA-seq, qRT-PCR, and IHC were used to verify the expression of CSGALNACT2 in ovarian cancer tissues. Then, in vivo and in vitro experiments were conducted to evaluate the role of CSGALNACT2 in the progression of ovarian cancer. RNA-seq and GSEA were used to reveal the potential biological function and oncogenic pathways of CSGALNACT2.

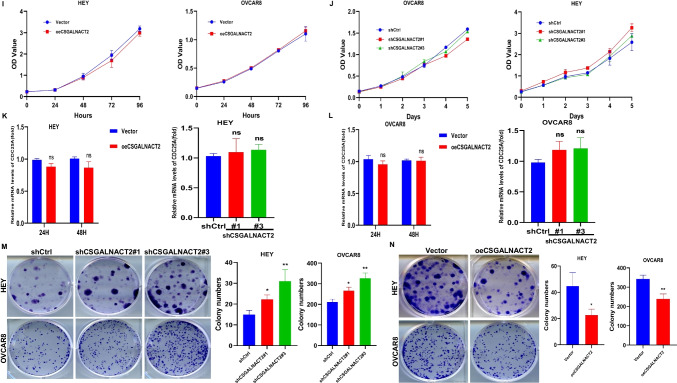
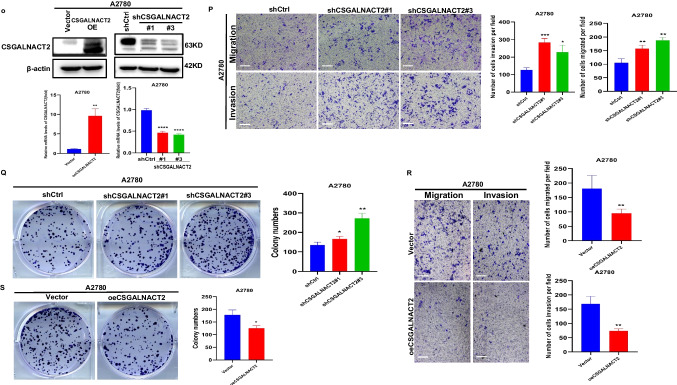
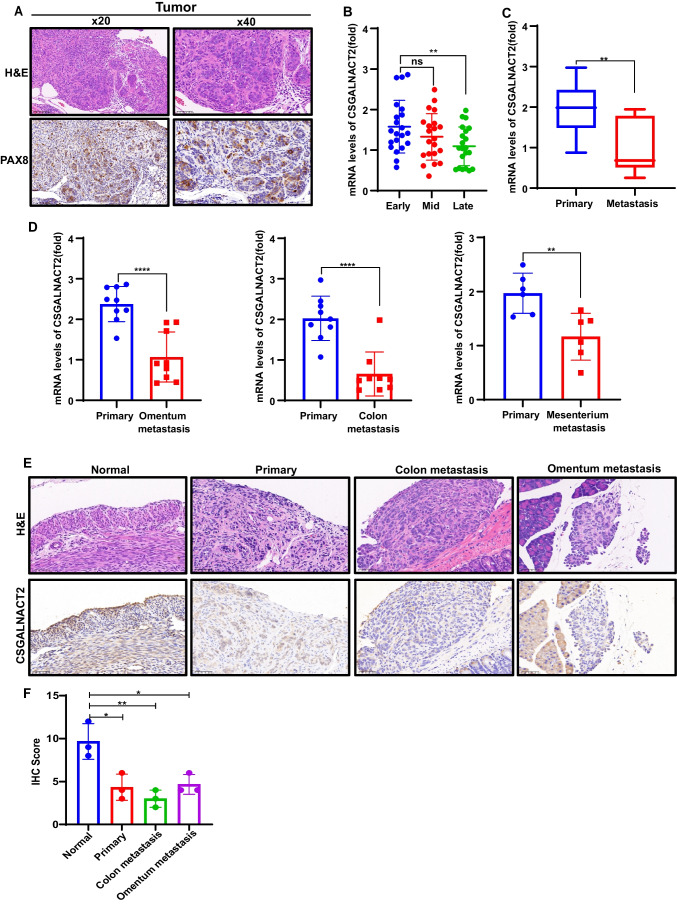
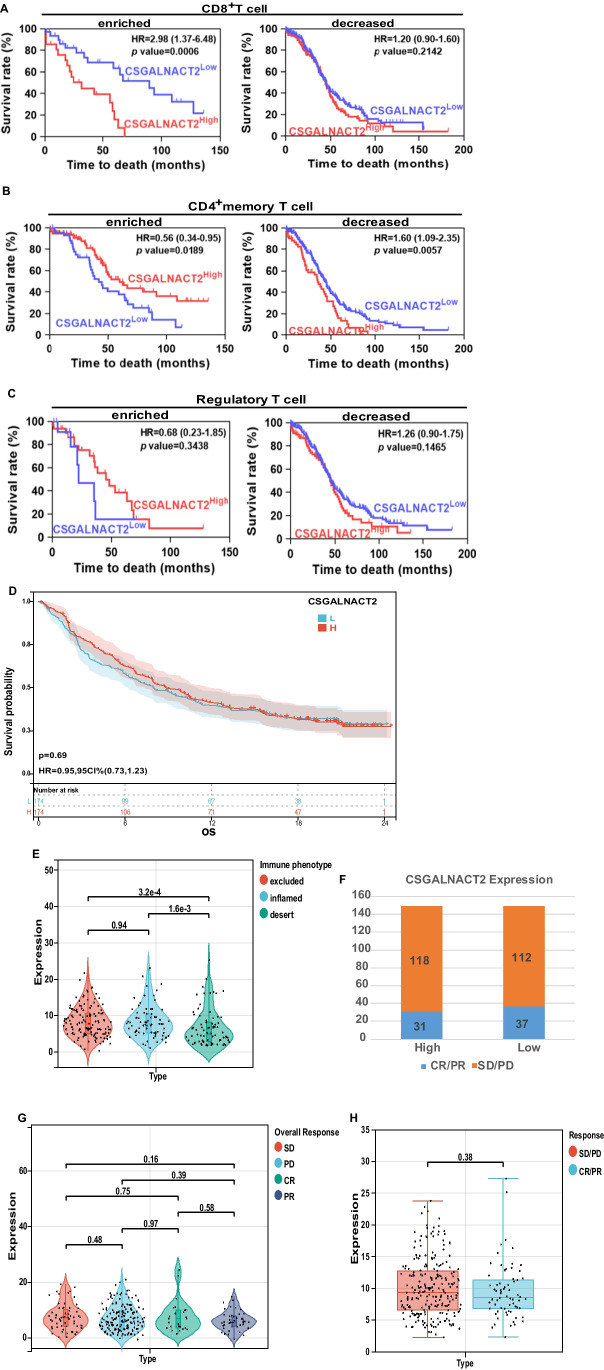
Results: We demonstrated that the mRNA expression and protein level of CSGALNACT2 were significantly downregulated in ovarian cancer and ovarian cancer metastatic tissues. CSGALNACT2 can significantly inhibit the migration, invasion, and clonogenic growth of ovarian cancer in vitro and is progressively lost during ovarian cancer progression in vivo. CSGALNACT2 suppresses ovarian cancer migration and invasion via DUSP1 modulation of the MAPK/ERK pathway through RNA-seq, KEGG analysis, and Western blotting. Moreover, CSGALNACT2 expression was correlated with immune cell infiltration and had prognostic value in different immune cell-enriched or decreased ovarian cancer. In addition, patients with CSGALNACT2 downregulation are less likely to benefit from immunotherapy.

Conclusion: As an ovarian cancer suppressor gene, CSGALNACT2 inhibits the development of ovarian cancer, and it might be used as a prognostic biomarker in patients with ovarian cancer.

Keywords: CSGALNACT2; DUSP1; MAPK/ERK pathway; Migration and invasion; Ovarian cancer.


Conflict of interest statement

The authors have declared that no conflict of interest exists.

Figures

Fig. 1
Fig. 1
CSGALNACT2 was down-regulated and associated with a better prognosis in ovarian cancer. A The expression of CSGALNACT2 in TCGA-OV from the UALCAN database (https://ualcan.path.uab.edu/). B The protein level of CSGALNACT2 in CPTAC from the UALCAN database. C CSGALNACT2 gene expression level from GEPIA2.0 (http://gepia2.cancer-pku). It includes 426 TCGA-OV samples and 88 GTEx normal samples. D RNA-seq was used to detect relative expressions of CSGALNACT2 in 10 normal and 39 tumor tissues of ovarian cancer. E qRT-PCR was performed to detect relative levels of CSGALNACT2 in normal and tumor tissues (n = 16) of ovarian cancer. F The protein level of CSGALNACT2 in normal ovarian epithelial tissues, ovarian cancer, and ovarian cancer metastatic tissues detected by immunohistochemical (IHC) staining. All micrographs (× 40; scale bar, 50 mm) were imaged from one representative case. G IHC scores between normal ovarian epithelial tissues, ovarian cancer, and ovarian cancer metastatic tissues. H Kaplan–Meier analysis of CSGALNACT2 on progression-free-survival (PFS) of ovarian cancer patients with Paclitaxel treatment from Kaplan–Meier plotter (https://kmplot.com/). *p ≤ 0.05, ***p ≤ 0.001
Fig. 2
Fig. 2
CSGALNACT2 inhibited the migration, invasion, and clonogenicity of normal Ovarian epithelial cell lines. A-B CSGALNACT2 overexpression and knockdown efficiency validation in IOSE cells by Western blotting and qRT-PCR. C-D Transwell assays detected the migration and invasion ability of cells after the knockdown of CSGALNACT2. Scale bar = 50 μm. E–F Stable knockdown of CSGALNACT2 promoted clonogenic growth in IOSE cell lines. G Transwell assays detected the migration and invasion ability of cells after overexpression of CSGALNACT2. Scale bar = 50 μm. H Colony formation assays were used to detect the proliferation ability of cells after overexpression of CSGALNACT2. I-J CCK-8 assays and the CDC25A expression were used to detect changes in cell proliferation after overexpression or knockdown of CSGALNACT2 in IOSE cells. **, P ≤ 0.01; ***, P ≤ 0.001; ****, P ≤ 0.0001; ns, not statistically
Fig. 3
Fig. 3
CSGALNACT2 is required for the suppression of cell mobility, metastasis, and clonogenic growth in ovarian cancer cells. A Protein and mRNA expressions of CSGALNACT2 in primary and metastatic cell lines of ovarian cancer patients were analyzed by Western Blotting and qRT-PCR. The expression of β-actin is an internal loading control. B Knockdown efficiencies of CSGALNACT2 in HEY and OVCAR8 cells were analyzed by Western blotting and qRT-PCR. shCtrl: cells infected with scrambled shRNA virus; shCSGALNACT2: cells infected with shCSGALNACT2 virus. C Wound-healing assays after CSGALNACT2 knockdown by shRNA in OVCAR8 and HEY cells. Scale bar = 100 μm. D-E Effects of CSGALNACT2 inhibition on cancer cell migration and invasion for OVCAR8 and HEY cells were analyzed; scale bar = 50 μm. And quantification of migrated and invaded cells of CSGALNACT2-silenced cells was presented as mean ± S.D. F Protein and mRNA expression of CSGALNACT2 in CSGALNACT2-overexpressed HEY and OVCAR8 cells was examined by Western blotting and qRT-PCR. G Wound-healing assays after CSGALNACT2 overexpression in OVCAR8 and HEY cells. Scale bar = 100 μm. H The transwell migration and invasion assays of CSGALNACT2 overexpression in OVCAR8 and HEY cells were determined and quantified. Results presented as the mean ± S.D. Scale bar = 50 μm. I-J CCK-8 assays were used to detect changes in cell proliferation after overexpression or knockdown of CSGALNACT2 in OVCAR8 and HEY cells. K-L The expression of proliferation marker CDC25A in cell proliferation after overexpression or knockdown of CSGALNACT2 in OVCAR8 and HEY cells by qRT-PCR. M–N Colony formation assays were used to detect the proliferation ability of cells after overexpression or knockdown of CSGALNACT2 in OVCAR8 and HEY cells. O CSGALNACT2 overexpression and knockdown efficiency validation in A2780 cells by Western blotting and qRT-PCR. P Transwell assays after CSGALNACT2 knockdown in A2780 cells. Scale bar = 50 μm. Q Colony formation assays were used to detect the proliferation ability of cells after the knockdown of CSGALNACT2. R-S Transwell and colony formation assays were used to detect the migration, invasion, and proliferation ability of A2780 cells after overexpression or knockdown of CSGALNACT2. Scale bar = 50 μm. *, P ≤ 0.05; **, P ≤ 0.01; ***, P ≤ 0.001; ****, P ≤ 0.0001; no asterisks, P not calculated
Fig. 3
Fig. 3
CSGALNACT2 is required for the suppression of cell mobility, metastasis, and clonogenic growth in ovarian cancer cells. A Protein and mRNA expressions of CSGALNACT2 in primary and metastatic cell lines of ovarian cancer patients were analyzed by Western Blotting and qRT-PCR. The expression of β-actin is an internal loading control. B Knockdown efficiencies of CSGALNACT2 in HEY and OVCAR8 cells were analyzed by Western blotting and qRT-PCR. shCtrl: cells infected with scrambled shRNA virus; shCSGALNACT2: cells infected with shCSGALNACT2 virus. C Wound-healing assays after CSGALNACT2 knockdown by shRNA in OVCAR8 and HEY cells. Scale bar = 100 μm. D-E Effects of CSGALNACT2 inhibition on cancer cell migration and invasion for OVCAR8 and HEY cells were analyzed; scale bar = 50 μm. And quantification of migrated and invaded cells of CSGALNACT2-silenced cells was presented as mean ± S.D. F Protein and mRNA expression of CSGALNACT2 in CSGALNACT2-overexpressed HEY and OVCAR8 cells was examined by Western blotting and qRT-PCR. G Wound-healing assays after CSGALNACT2 overexpression in OVCAR8 and HEY cells. Scale bar = 100 μm. H The transwell migration and invasion assays of CSGALNACT2 overexpression in OVCAR8 and HEY cells were determined and quantified. Results presented as the mean ± S.D. Scale bar = 50 μm. I-J CCK-8 assays were used to detect changes in cell proliferation after overexpression or knockdown of CSGALNACT2 in OVCAR8 and HEY cells. K-L The expression of proliferation marker CDC25A in cell proliferation after overexpression or knockdown of CSGALNACT2 in OVCAR8 and HEY cells by qRT-PCR. M–N Colony formation assays were used to detect the proliferation ability of cells after overexpression or knockdown of CSGALNACT2 in OVCAR8 and HEY cells. O CSGALNACT2 overexpression and knockdown efficiency validation in A2780 cells by Western blotting and qRT-PCR. P Transwell assays after CSGALNACT2 knockdown in A2780 cells. Scale bar = 50 μm. Q Colony formation assays were used to detect the proliferation ability of cells after the knockdown of CSGALNACT2. R-S Transwell and colony formation assays were used to detect the migration, invasion, and proliferation ability of A2780 cells after overexpression or knockdown of CSGALNACT2. Scale bar = 50 μm. *, P ≤ 0.05; **, P ≤ 0.01; ***, P ≤ 0.001; ****, P ≤ 0.0001; no asterisks, P not calculated
Fig. 4
Fig. 4
CSGALNACT2 expression is reduced during the metastasis of ovarian cancer in vivo. A H&E staining (top) and Immunohistochemistry (IHC) (bottom) of tissues. Immunohistochemistry (IHC) using specific antibodies targeting PAX8 (IHC Score = 12). The scale bar represents 100 μm (Left panels). The scale bar represents 50 μm (Right panels). B The mRNA expression levels of CSGALNACT2 in different stages of ovarian cancer primary by qRT-PCR. C-D The expression of CSGALNACT2 in ovarian primary and different metastatic lesions was detected by qRT-PCR. E–F H&E staining (top) and Immunohistochemistry (IHC) (bottom) of tissues. The expression levels of CSGALNACT2 in primary ovarian lesions and different metastatic lesions of each group were detected by immunohistochemical staining. Scale bar = 50 μm
Fig. 5
Fig. 5
CSGALNACT2 suppresses ovarian cancer migration and invasion via DUSP1 modulation of MAPK/ERK pathway. A Volcano plot of the distribution of differentially expressed genes (DEGs) by RNA-seq in HEY cell lines with stable overexpression of CSGALNACT2. Red and blue dots represented statistically significant up- and down-regulated CSGALNACT2, respectively. B Heatmap showed the 20 DEGs with the most significant up- and down-regulation in the upregulated CSGALNACT2 group compared with the control group. C-D qRT-PCR analyzed the expression of core genes, such as RASSF6, DUSP1, TXNIP in HEY cells C and OVCAR8 cells D with up- and down-regulated CSGALNACT2. *, P ≤ 0.05; **, P ≤ 0.01; ***, P ≤ 0.001; ****, P ≤ 0.0001; ns, not statistically. E The correlation of GO biological process, molecular function, and CSGALNACT2 was analyzed by GSEA via RNA-Seq data. F Reactome analysis of the relationship between various reactions and biological pathways and CSGALNACT2 expression via RNA-Seq data. G-H The correlation of KEGG pathways and CSGALNACT2 was analyzed by GSEA via RNA-Seq data. I-J MAPK signaling pathway related proteins (p-Erk1/2, Erk1/2) were detected by western blotting in HEY, OVCAR8 and A2780 cells
Fig. 5
Fig. 5
CSGALNACT2 suppresses ovarian cancer migration and invasion via DUSP1 modulation of MAPK/ERK pathway. A Volcano plot of the distribution of differentially expressed genes (DEGs) by RNA-seq in HEY cell lines with stable overexpression of CSGALNACT2. Red and blue dots represented statistically significant up- and down-regulated CSGALNACT2, respectively. B Heatmap showed the 20 DEGs with the most significant up- and down-regulation in the upregulated CSGALNACT2 group compared with the control group. C-D qRT-PCR analyzed the expression of core genes, such as RASSF6, DUSP1, TXNIP in HEY cells C and OVCAR8 cells D with up- and down-regulated CSGALNACT2. *, P ≤ 0.05; **, P ≤ 0.01; ***, P ≤ 0.001; ****, P ≤ 0.0001; ns, not statistically. E The correlation of GO biological process, molecular function, and CSGALNACT2 was analyzed by GSEA via RNA-Seq data. F Reactome analysis of the relationship between various reactions and biological pathways and CSGALNACT2 expression via RNA-Seq data. G-H The correlation of KEGG pathways and CSGALNACT2 was analyzed by GSEA via RNA-Seq data. I-J MAPK signaling pathway related proteins (p-Erk1/2, Erk1/2) were detected by western blotting in HEY, OVCAR8 and A2780 cells
Fig. 6
Fig. 6
Correlation analysis of CSGALNACT2 with immunotherapy and immune cell infiltration. A Kaplan–Meier curves were plotted based on the different groups of CSGALNACT2/CD8 + T cell enriched or decreased, CSGALNACT2/CD4 + memory T cell enriched or decreased, B CSGALNACT2/Regulatory T cell enriched or decreased C in TCGA cohort. D Survival analyses for high (174 cases) and low (174 cases) CSGALNACT2 expression patient groups in the anti-PD-L1 immunotherapy cohort using Kaplan–Meier curves (IMvigor210 cohort). E Differences in CSGALNACT2 among distinct tumor immune phenotypes in the IMvigor210 cohort. The lines in the boxes represented the median value by the Kruskal–Wallis test. F The number of patients with response to PD-L1 blockade immunotherapy in high or low CSGALNACT2 expression groups. SD, stable disease; PD, progressive disease; CR, complete response; PR, partial response. G The distribution of CSGALNACT2 in different anti-PD-L1 clinical response groups. H The correlation of CSGALNACT2 with immunotherapy response, Wilcoxon rank sum was applied for the significance test

References

    1. Lheureux S, et al. Epithelial ovarian cancer. Lancet. 2019;393(10177):1240–1253. doi: 10.1016/S0140-6736(18)32552-2. - DOI - PubMed
    1. Siegel RL, Miller KD, Jemal A. Cancer statistics, 2017. CA Cancer J. Clin. 2017;67(1):7–30. doi: 10.3322/caac.21387. - DOI - PubMed
    1. Chan JK, et al. Patterns and progress in ovarian cancer over 14 years. Obstet. Gynecol. 2006;108(3 Pt 1):521–528. doi: 10.1097/01.AOG.0000231680.58221.a7. - DOI - PubMed
    1. Cortez AJ, et al. Advances in ovarian cancer therapy. Cancer Chemother. Pharmacol. 2018;81(1):17–38. doi: 10.1007/s00280-017-3501-8. - DOI - PMC - PubMed
    1. Bejarano L, Jordāo MJC, Joyce JA. Therapeutic targeting of the tumor microenvironment. Cancer Discov. 2021;11(4):933–959. doi: 10.1158/2159-8290.CD-20-1808. - DOI - PubMed

MeSH terms

Substances