. 2023 Dec 11;15(1):109.
doi: 10.1186/s13073-023-01257-5.

Acute ischemia induces spatially and transcriptionally distinct microglial subclusters

Affiliations

Acute ischemia induces spatially and transcriptionally distinct microglial subclusters

Huiya Li et al. Genome Med. .

Abstract

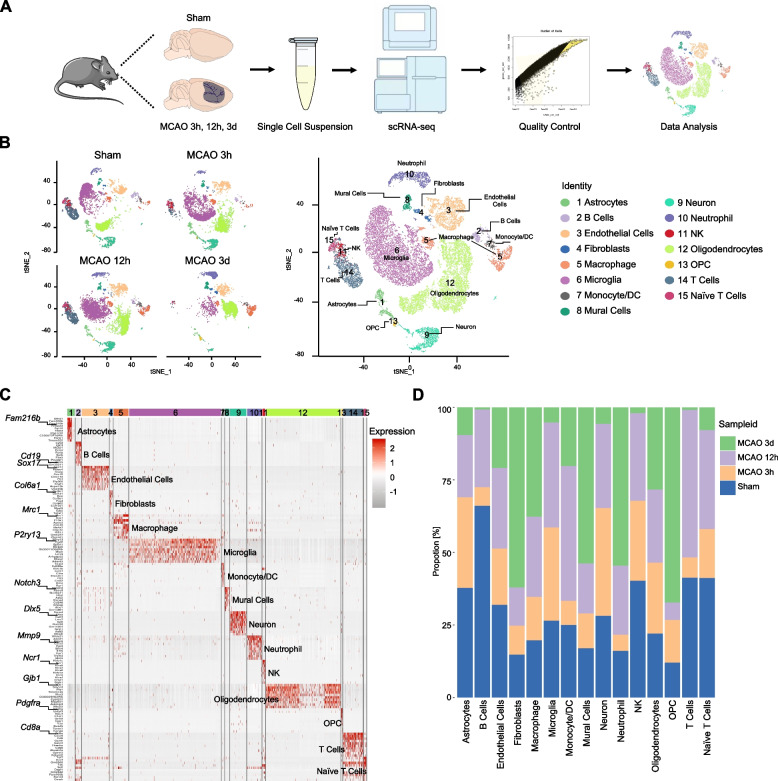
Background: Damage in the ischemic core and penumbra after stroke affects patient prognosis. Microglia immediately respond to ischemic insult and initiate immune inflammation, playing an important role in the cellular injury after stroke. However, the microglial heterogeneity and the mechanisms involved remain unclear.

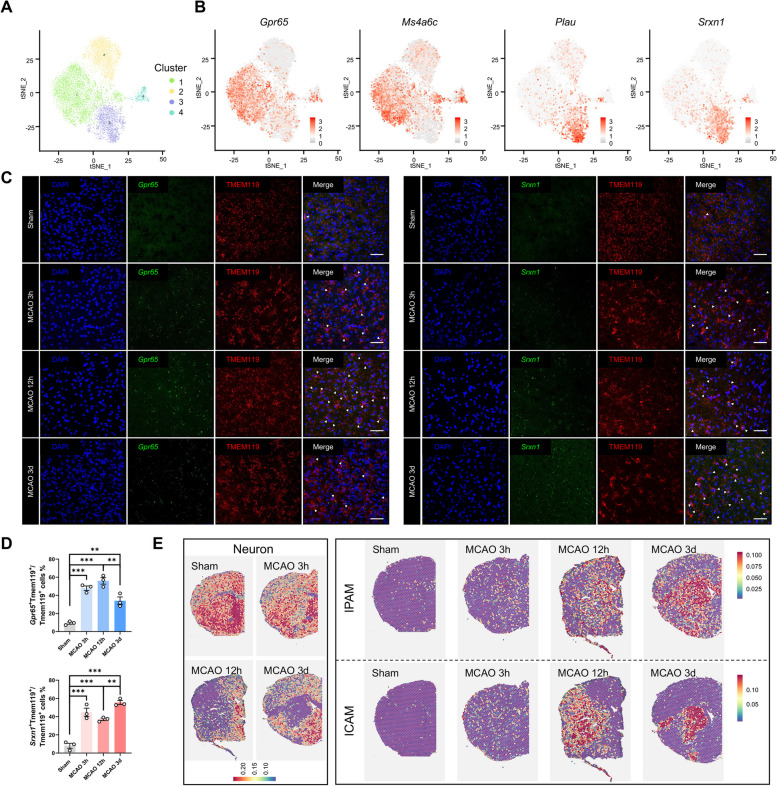
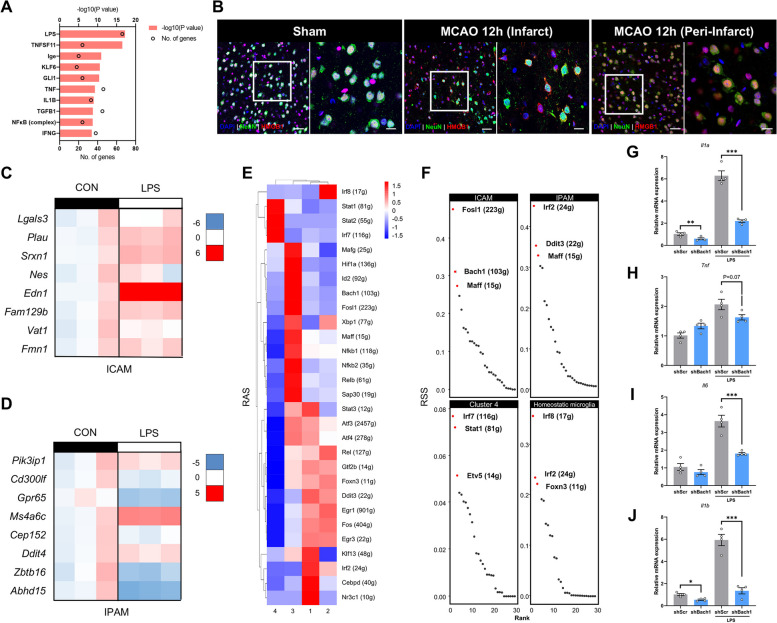
Methods: We first performed single-cell RNA-sequencing (scRNA-seq) and spatial transcriptomics (ST) on middle cerebral artery occlusion (MCAO) mice from three time points to determine stroke-associated microglial subclusters and their spatial distributions. Furthermore, the expression of microglial subcluster-specific marker genes and the localization of different microglial subclusters were verified on MCAO mice through RNAscope and immunofluorescence. Gene set variation analysis (GSVA) was performed to reveal functional characteristics of microglia sub-clusters. Additionally, ingenuity pathway analysis (IPA) was used to explore upstream regulators of microglial subclusters, which was confirmed by immunofluorescence, RT-qPCR, shRNA-mediated knockdown, and targeted metabolomics. Finally, the infarct size, neurological deficits, and neuronal apoptosis were evaluated in MCAO mice after manipulation of specific microglial subcluster.

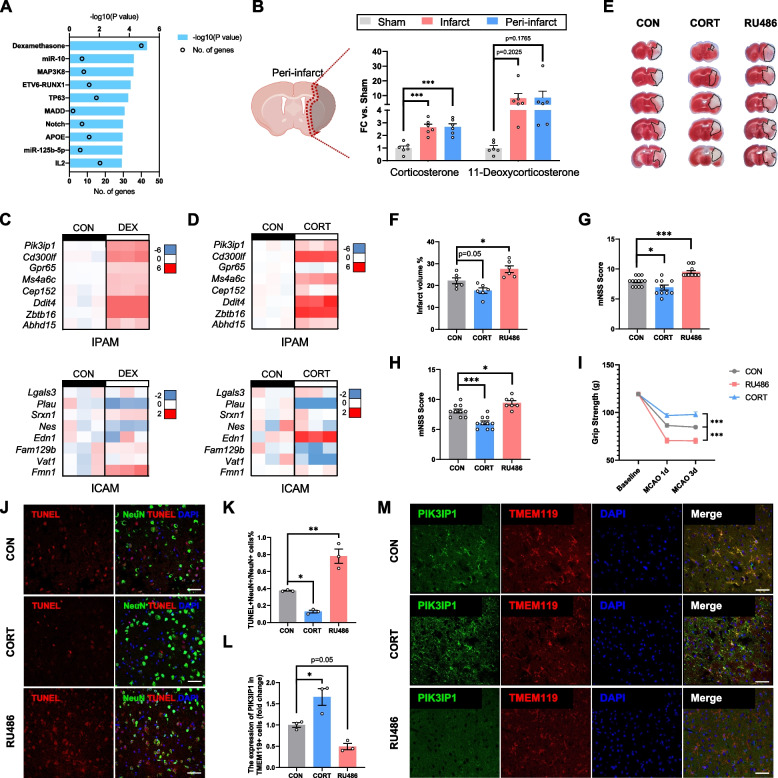
Results: We discovered stroke-associated microglial subclusters in the brains of MCAO mice. We also identified novel marker genes of these microglial subclusters and defined these cells as ischemic core-associated (ICAM) and ischemic penumbra-associated (IPAM) microglia, according to their spatial distribution. ICAM, induced by damage-associated molecular patterns, are probably fueled by glycolysis, and exhibit increased pro-inflammatory cytokines and chemokines production. BACH1 is a key transcription factor driving ICAM generation. In contrast, glucocorticoids, which are enriched in the penumbra, likely trigger IPAM formation, which are presumably powered by the citrate cycle and oxidative phosphorylation and are characterized by moderate pro-inflammatory responses, inflammation-alleviating metabolic features, and myelinotrophic properties.

Conclusions: ICAM could induce excessive neuroinflammation, aggravating brain injury, whereas IPAM probably exhibit neuroprotective features, which could be essential for the homeostasis and survival of cells in the penumbra. Our findings provide a biological basis for targeting specific microglial subclusters as a potential therapeutic strategy for ischemic stroke.

Keywords: BACH1; Glucocorticoids; Ischemic stroke; Microglia; Spatial transcriptomics; scRNA-seq.


Conflict of interest statement

The authors declare that they have no competing interests.

Figures

Fig. 1
Fig. 1
Identification of cell types. A Scheme of scRNA-seq. B t-SNE plot showing cell clusters in sham and MCAO (3-h, 12-h, and 72-h post-ischemic stroke) mouse brains. Colors highlight 15 transcriptionally distinct clusters. Cell types were manually annotated based on canonical marker gene expression (Additional file 2: Table S2). C Heatmap of top 10 marker genes enriched in each cell type based on bimod inspection. Genes of interest are highlighted. Cluster annotations and coloring are consistent across panels. D Proportional histogram depicting the proportion alterations of 15 transcriptionally distinct cell types at the acute stage of ischemic stroke (Sham, MCAO-3h, MCAO-12h, and MCAO-72h)
Fig. 2
Fig. 2
Ischemia induces two microglial subclusters. A t-SNE projection of microglia (9396 cells), sub-clustered into four sub-populations (Cluster 1: 4554 cells; Cluster 2: 2362 cells; Cluster 3: 2015 cells; Cluster 4: 465 cells). B Feature plots of selected marker genes enriched in Cluster 1 or Cluster 3. C–D Representative RNAscope images (C) co-stained with Gpr65/Srxn1 and microglial-marker TMEM119 within ischemic penumbra or core in sham and MCAO (3-h, 12-h, 3-day post-ischemic stroke) mice (scale bar: 50 µm; n = 3/group). Data are presented as mean ± SEM (D). **P < 0.01, ***P < 0.001, by Student’s t-test. E 10 × Visium spatial transcriptomics highlighting the presence of Cluster 1 (IPAM) and Cluster 3 (ICAM) in sham (control) and MCAO (3-h, 12-h, 3-day post-ischemic stroke) mouse brain sections, identified by marker genes from scRNA-seq using the AddModuleScore. NeuN was used to define the ischemic lesion
Fig. 3
Fig. 3
ICAM and IPAM exhibit distinct features. A GSVA showing biological processes differentially enriched in IPAM/ICAM. B Gene score feature plots in IPAM and ICAM using representative genes involved in glycolysis/TCA cycle/OXPHOS pathways (Additional file 2: Table S6). C Gene score feature plot for pro-inflammatory cytokines (Il1a, Il1b, Il6, Il18, Tnf, Hmox1, Ptgs2) in microglia. D Boxplots depicting macrophage/neutrophil/T cell/NK-specific chemokine expression (Additional file 2: Table S8) among four microglial subclusters using the AddModuleScore. E Gene score feature plots in IPAM and ICAM using canonical sphingolipid metabolism, UFA biosynthesis, fatty acid degradation, and fatty acid elongation marker genes (Additional file 2: Table S6)
Fig. 4
Fig. 4
M1/M2 dichotomy fails to classify microglial subclusters after ischemia. A Median correlation plot showing M1 polarization score and M2 polarization score of microglia from sham group and MCAO (3-h, 12-h, and 3-day post stroke) group using Corscatter (Additional file 2: Table S9). M1 polarization score and M2 polarization score of microglia from sham group and MCAO (3-h, 12-h, and 3-day post stroke) group were depicted in the box plot. B Gene score feature plot using M1-microglial marker. C Gene score feature plot using M2-microglial marker genes. D Median correlation plot showing M1 polarization score and M2 polarization score of IPAM and ICAM using Corscatter. E Median correlation plot showing the alterations of M1 polarization score and M2 polarization score in IPAM among different groups (sham, MCAO-3 h, MCAO-12 h, and MCAO-3d). F Median correlation plot showing the differences of M1 polarization score and M2 polarization score in ICAM among different groups (sham, MCAO-3 h, MCAO-12 h, and MCAO-3d). G Pseudo-time trajectory diagram of microglia. The expression of M1/ M2 microglial marker genes was depicted in the diagram respectively. H t-SNE projections highlighting M1-marker (Cd86 and Fcgr4) and M2-marker (Arg1 and Mrc1)
Fig. 5
Fig. 5
Key DAMPs and regulons drive ICAM generation. A Upstream IPA of top 200 differentially expressed genes in ICAM (Fisher’s exact test, Benjamini–Hochberg FDR). B Representative confocal immunofluorescence images showing HMGB1 and NEUN expression within the infarct or peri-infarct in sham or MCAO-12 h mouse brains (scale bar: 50 µm). The right panels are magnified (scale bar: 20 µm). C–D Heatmap showing ICAM-specific (C) or IPAM-specific (D) marker genes expression upon LPS stimulation (100 ng/mL, 3 h). n = 3/group. EF Heatmap (E) and ranking plot (F) depicting the RAS and RSS of different regulons among four microglial sub-clusters using SCENIC analysis. A transcription factor and its potential targeted genes were regarded as a regulon. RAS represents regulon activity. RSS indicates regulon specificity. GJ Real-time PCR analysis of the expression of pro-inflammatory factors (Il1a, Tnf, Il6, and Il1b) in shScr/shBach1 cell line upon or without LPS stimulation (500 ng/mL, 12 h). n = 4 biological independent samples. Data are presented as mean ± SEM. *P < 0.05, **P < 0.01, ***P < 0.001, by Student’s t-test
Fig. 6
Fig. 6
Glucocorticoids triggers IPAM formation. A Upstream IPA of top 200 differentially expressed genes in IPAM (Fisher’s exact test, Benjamini–Hochberg FDR). B Histograms visualizing targeted metabolomics results in the sham, infarct, and peri-infarct group brain samples from sham and MCAO-12 h mice. n = 6/group. CD Heatmap showing the expression of several ICAM-specific or IPAM-specific marker genes upon DEX (5 nM, 24 h) (C) or CORT (1 μM, 24 h) (D) stimulation. n = 3/group. EF TTC staining of brains from CON, CORT, and RU486 group (E). The infarct volume was quantified (F). n = 6/group. GH mNSS were performed at 1 day (G) and 3 days (H) after MCAO to evaluate the neurological deficits of each group. n = 7–14/group. I Grip strength was performed at 1 day and 3 days after MCAO to evaluate the neurological deficits of each group. n = 7–14/group. J Representative TUNEL images co-stained with neuronal-marker NEUN within the ischemic regions in the MCAO 1d brains from CON, CORT, and RU486 groups (scale bar: 50 µm). K Proportion of TUNEL+/NeuN+ cells in NeuN+ cells was quantified. n = 3/group. L Expression of PIK3IP1 in TMEM119.+ cells was quantified. The fluorescence intensity of PIK3IP1 in the CORT and RU486 groups was normalized to the mean value of that measured in the CON group. n = 3/group. M Representative immunostaining of IPAM-specific marker PIK3IP1 and microglia-specific marker TMEM119 in the peri-infarct within MCAO-1d sections from CON, CORT, and RU486 groups (scale bar: 20 µm). In B, FH, K, and L, one-way ANOVA with Tukey’s post hoc test. In I, two-way ANOVA with Tukey’s post hoc test. Data are presented as mean ± SEM. *P < 0.05, **P < 0.01, ***P < 0.001

References

    1. Cserép C, Pósfai B, Dénes Á. Shaping neuronal fate: functional heterogeneity of direct microglia-neuron interactions. Neuron. 2021;109:222–240. doi: 10.1016/j.neuron.2020.11.007. - DOI - PubMed
    1. Ma Y, Wang J, Wang Y, Yang GY. The biphasic function of microglia in ischemic stroke. Prog Neurobiol. 2017;157:247–272. doi: 10.1016/j.pneurobio.2016.01.005. - DOI - PubMed
    1. Borst K, Dumas AA, Prinz M. Microglia: immune and non-immune functions. Immunity. 2021;54:2194–2208. doi: 10.1016/j.immuni.2021.09.014. - DOI - PubMed
    1. Xiong XY, Liu L, Yang QW. Functions and mechanisms of microglia/macrophages in neuroinflammation and neurogenesis after stroke. Prog Neurobiol. 2016;142:23–44. doi: 10.1016/j.pneurobio.2016.05.001. - DOI - PubMed
    1. Alawieh A, Langley EF, Tomlinson S. Targeted complement inhibition salvages stressed neurons and inhibits neuroinflammation after stroke in mice. Sci Transl Med. 2018;10:aao6459. - PMC - PubMed

Publication types