. 2023 Dec 12;10(1):64.
doi: 10.1186/s40779-023-00500-9.

ADP-dependent glucokinase controls metabolic fitness in prostate cancer progression

Affiliations

ADP-dependent glucokinase controls metabolic fitness in prostate cancer progression

Hang Xu et al. Mil Med Res. .

Abstract

Background: Cell metabolism plays a pivotal role in tumor progression, and targeting cancer metabolism might effectively kill cancer cells. We aimed to investigate the role of hexokinases in prostate cancer (PCa) and identify a crucial target for PCa treatment.

Methods: The Cancer Genome Atlas (TCGA) database, online tools and clinical samples were used to assess the expression and prognostic role of ADP-dependent glucokinase (ADPGK) in PCa. The effect of ADPGK expression on PCa cell malignant phenotypes was validated in vitro and in vivo. Quantitative proteomics, metabolomics, and extracellular acidification rate (ECAR) and oxygen consumption rate (OCR) tests were performed to evaluate the impact of ADPGK on PCa metabolism. The underlying mechanisms were explored through ADPGK overexpression and knockdown, co-immunoprecipitation (Co-IP), ECAR analysis and cell counting kit-8 (CCK-8) assays.

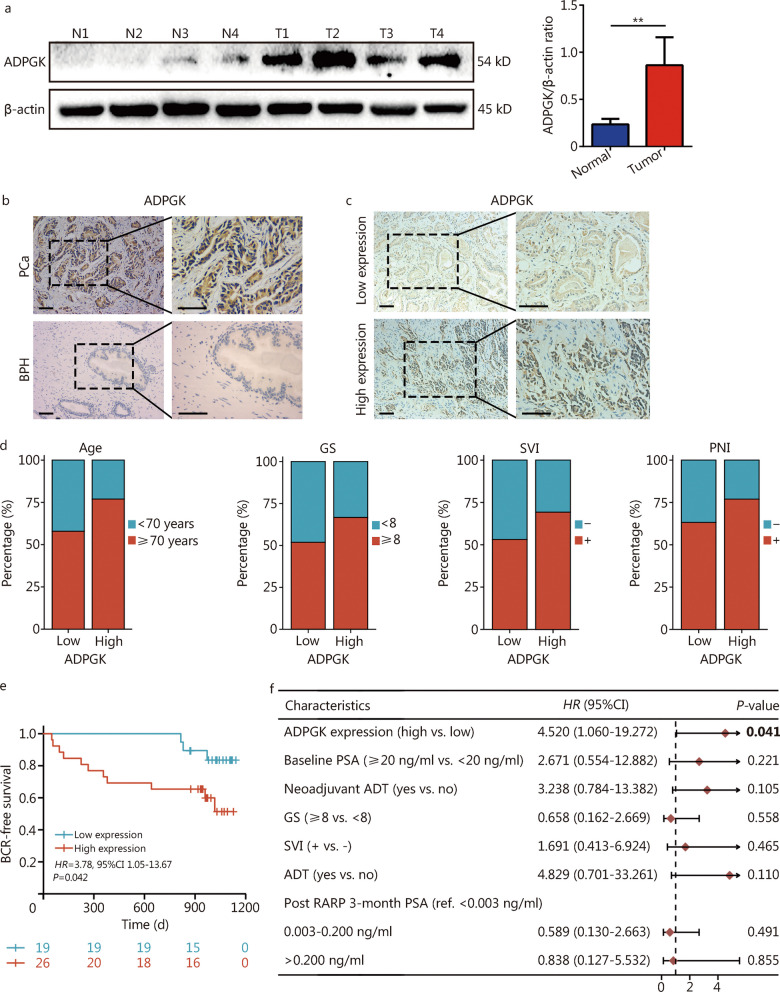
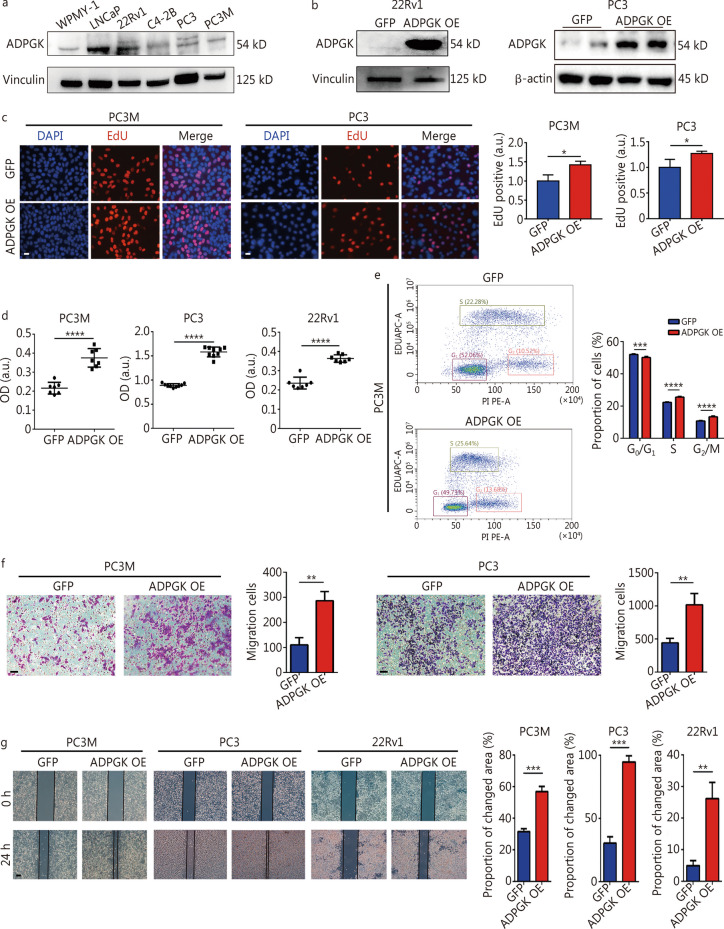
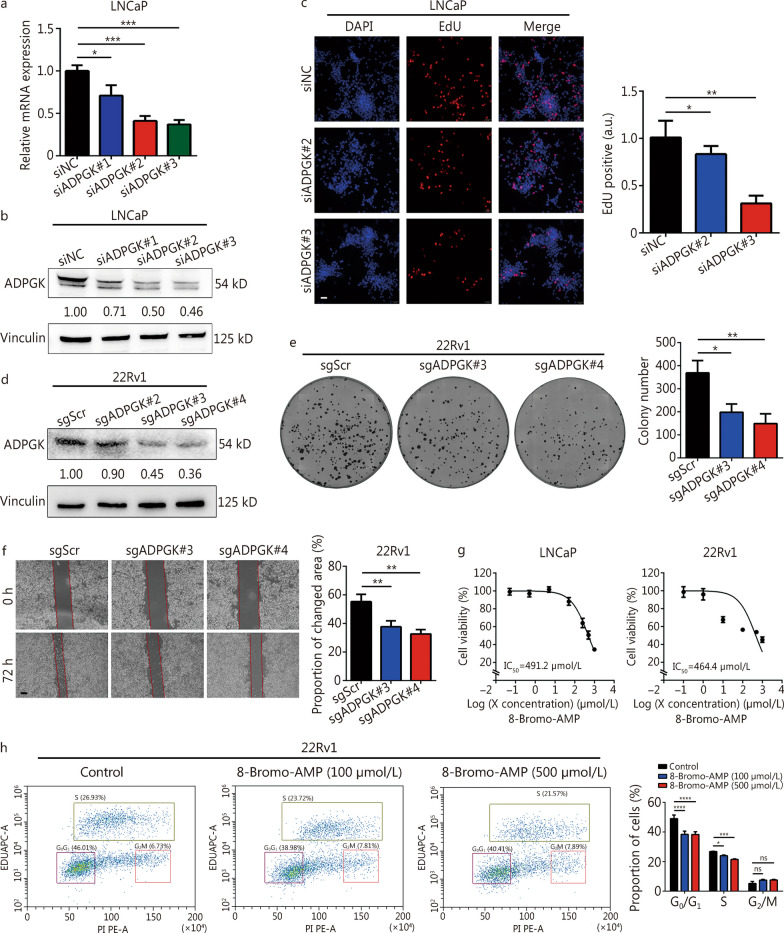
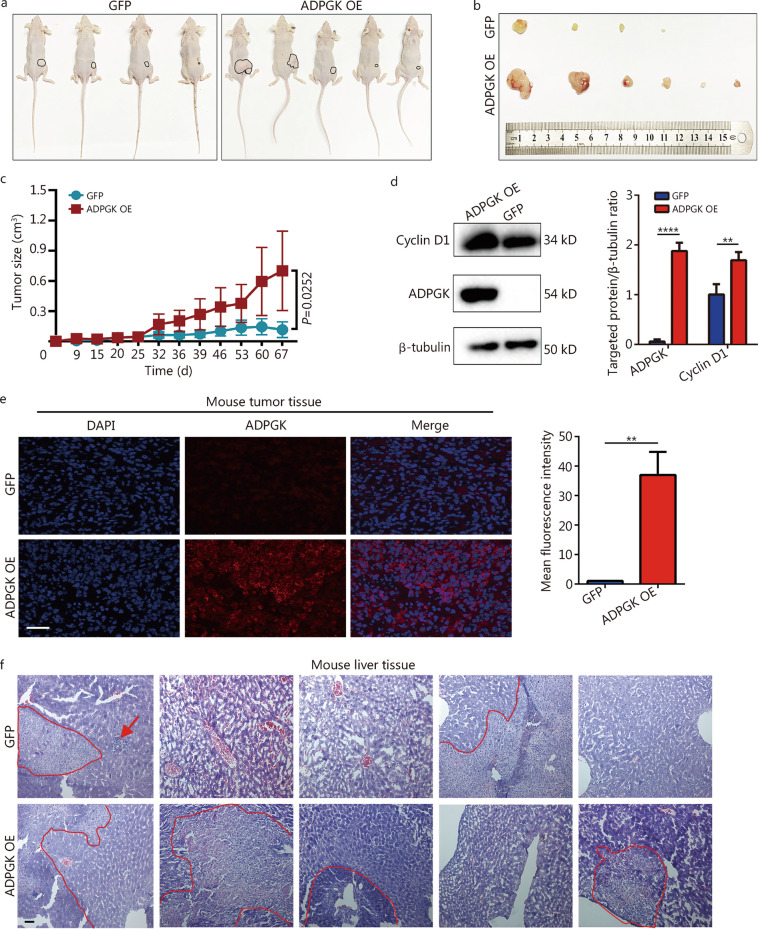
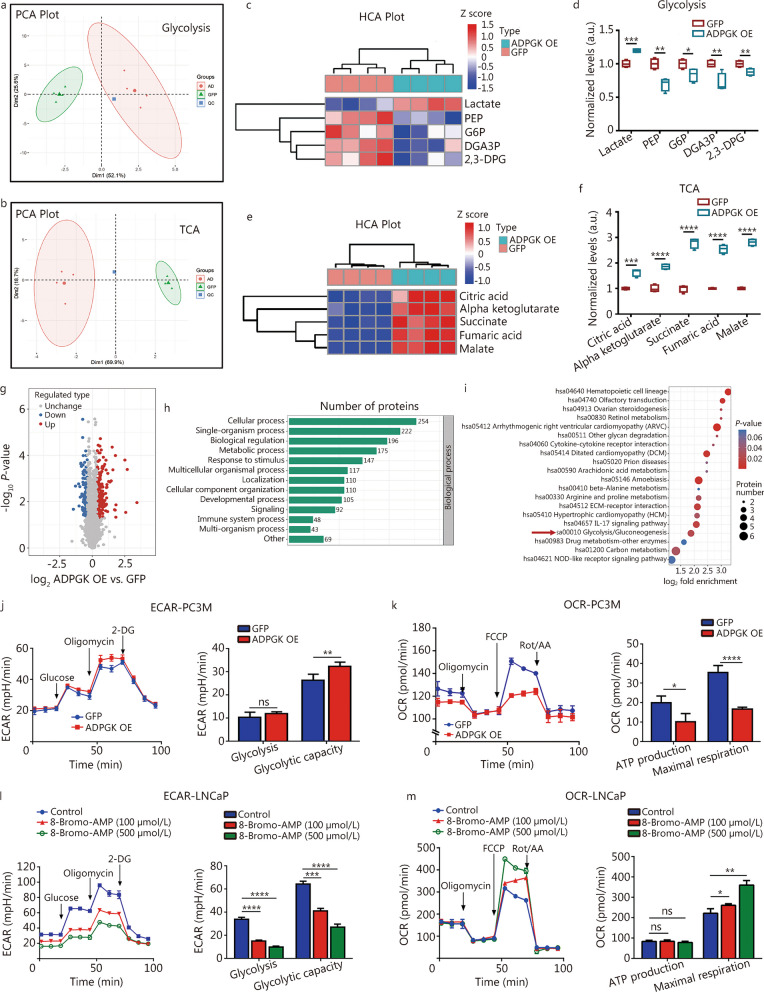
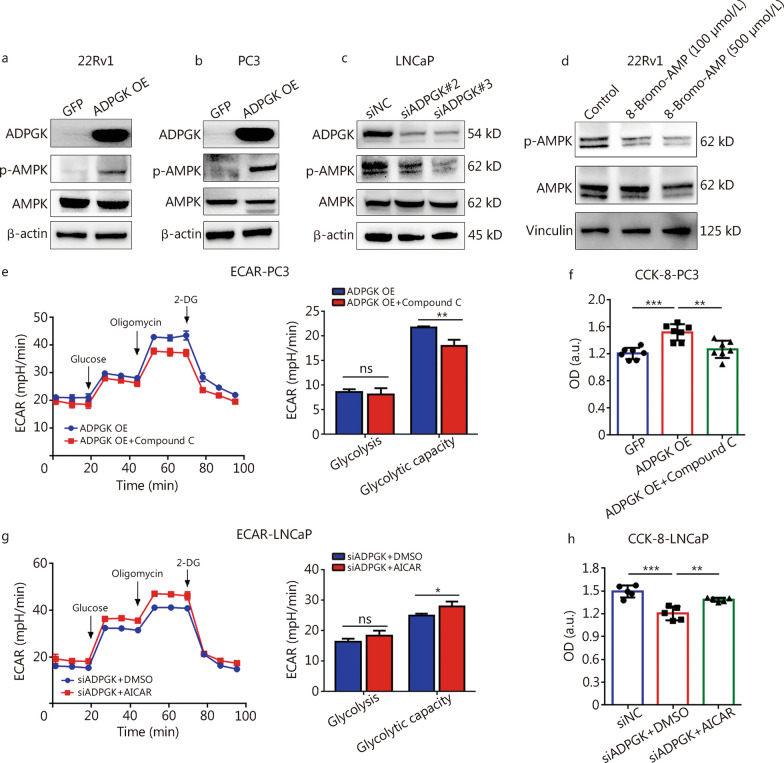
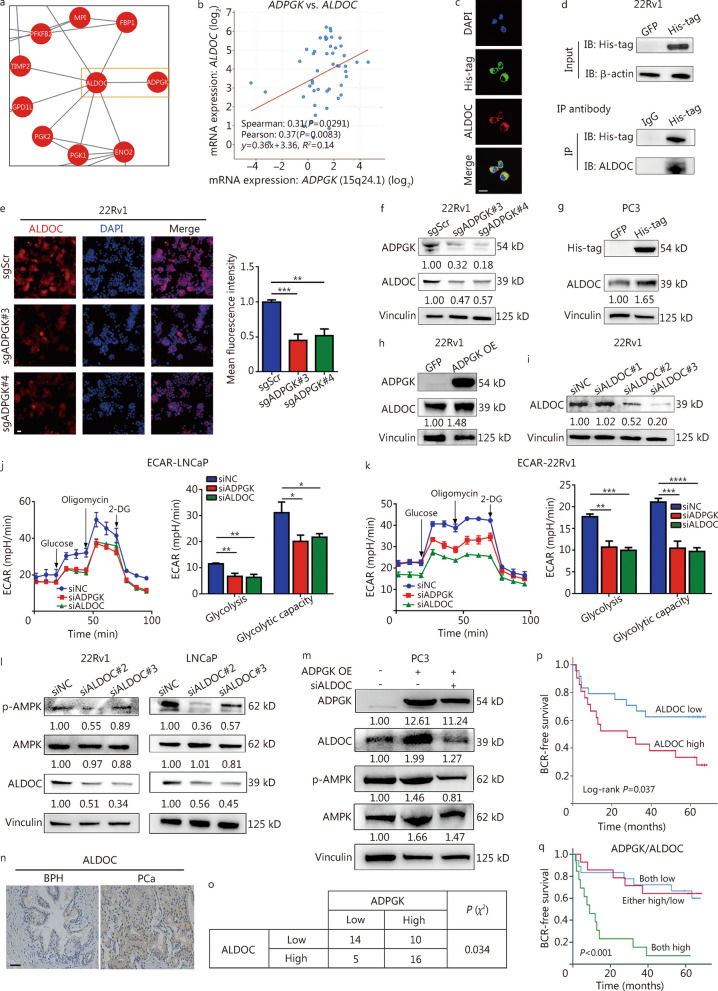
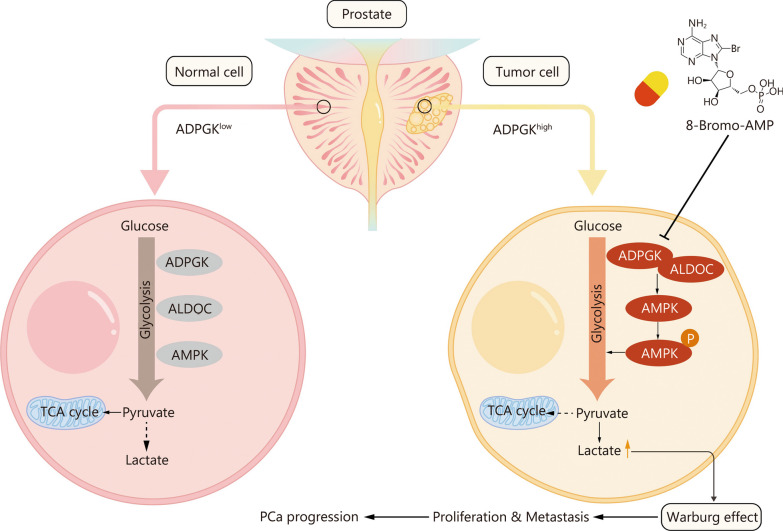
Results: ADPGK was the only glucokinase that was both upregulated and predicted worse overall survival (OS) in prostate adenocarcinoma (PRAD). Clinical sample analysis demonstrated that ADPGK was markedly upregulated in PCa tissues vs. non-PCa tissues. High ADPGK expression indicates worse survival outcomes, and ADPGK serves as an independent factor of biochemical recurrence. In vitro and in vivo experiments showed that ADPGK overexpression promoted PCa cell proliferation and migration, and ADPGK inhibition suppressed malignant phenotypes. Metabolomics, proteomics, and ECAR and OCR tests revealed that ADPGK significantly accelerated glycolysis in PCa. Mechanistically, ADPGK binds aldolase C (ALDOC) to promote glycolysis via AMP-activated protein kinase (AMPK) phosphorylation. ALDOC was positively correlated with ADPGK, and high ALDOC expression was associated with worse survival outcomes in PCa.

Conclusions: In summary, ADPGK is a driving factor in PCa progression, and its high expression contributes to a poor prognosis in PCa patients. ADPGK accelerates PCa glycolysis and progression by activating ALDOC-AMPK signaling, suggesting that ADPGK might be an effective target and marker for PCa treatment and prognosis evaluation.

Keywords: ADP-dependent glucokinase (ADPGK); AMPK; Aldolase C (ALDOC); Glycolysis; Prostate cancer (PCa).


Conflict of interest statement

The authors declare that they have no competing interests.

Figures

Fig. 1
Fig. 1
High ADPGK expression is associated with poor oncologic outcomes. a Validation of ADPGK expression in clinical PCa samples by Western blotting (n = 4). b ADPGK expression status in the clinical samples assessed by immunohistochemistry (IHC). Scale bar = 100 μm. c PCa samples were divided into low and high ADPGK expression groups according to the IHC results. Scale bar = 100 μm. d Associations of ADPGK with different clinical features. e Kaplan‒Meier curves showing the association of ADPGK with BCR in 45 patients. f Multivariate Cox regression analyses of the relationship between parameters with BCR. Data are presented as the mean ± SD. **P < 0.01. ADPGK ADP-dependent glucokinase, N normal, T tumor, PCa prostate cancer, BPH benign prostate hyperplasia, GS Gleason score, SVI seminal vesicle invasion, PNI perineural invasion, HR hazard ratio, SD standard deviation, BCR biochemical recurrence, ADT androgen deprivation therapy, PSA prostate specific antigen, RARP robot-assisted laparoscopic radical prostatectomy
Fig. 2
Fig. 2
ADPGK overexpression promotes PCa cell proliferation and migration in vitro. a ADPGK protein expression across prostate cell lines validated by Western blotting. b Western blotting results showed the stable overexpression of ADPGK in 22Rv1 and PC3 cells after lentivirus transfection. c Cell proliferation was measured by EdU assays (n = 3). Scale bar = 20 μm. d Cell viability was assessed by CCK-8 assays (n = 3). e Cell proliferation was measured by EdU flow cytometry analysis (n = 3). f Cell migration was assessed by Transwell assays (n = 3). Scale bar = 50 μm. g Cell migration was assessed by wound healing assays (n = 3). Scale bar = 200 μm. Data are presented as the mean ± SD. *P < 0.05, **P < 0.01, ***P < 0.001, ****P < 0.0001. ADPGK ADP-dependent glucokinase, PCa prostate cancer, SD standard deviation, OE overexpression, OD optical density, a.u. artificial unit
Fig. 3
Fig. 3
Inhibition of ADPGK suppresses PCa progression in vitro. a RNAi-mediated ADPGK knockdown was validated by qPCR. b RNAi-mediated ADPGK knockdown was validated by Western blotting. c Cell proliferation was measured by EdU assay after ADPGK knockdown (n = 3). Scale bar = 50 μm. d CRISPR/Cas9-mediated ADPGK knockdown was validated by Western blotting. e The effect of ADPGK knockdown on cell proliferation was validated in a colony formation assay (n = 3). f The effect of ADPGK knockdown on PCa cell migration ability was validated in a wound healing assay (n = 3). Scale bar = 200 μm. g A CCK-8 assay was performed to evaluate the effect of an ADPGK inhibitor (8-Bromo-AMP) on PCa cells (n = 5). h An EdU flow cytometric assay was performed in 22Rv1 cells using different concentrations of 8-Bromo-AMP (n = 3). Data are presented as the mean ± SD. *P < 0.05, **P < 0.01, ***P < 0.001, ****P < 0.0001, ns non-significant. Scr scramble, PCa prostate cancer, SD standard deviation, NC negative control, ADPGK ADP-dependent glucokinase, qPCR quantitative polymerase chain reaction, CRISPR clustered regularly interspaced short palindromic repeats, a.u. artificial unit
Fig. 4
Fig. 4
ADPGK promotes PCa growth and liver metastasis in vivo. a Tumor-bearing mice in two groups (the tumor of one mouse in the control group did not arise). b Tumor size of the two groups (one mouse in the ADPGK OE group grew 2 subcutaneous tumors, contributing to the final 6 tumors shown in the ADPGK OE group). c Changes in tumor growth size over time. d Cyclin D1 and ADPGK protein expression in xenograft tissues assessed by Western blotting (n = 3). e Verification of tumor tissues from the xenograft mice by immunofluorescence with an ADPGK antibody (n = 3). Scale bar = 50 μm. f Metastatic foci of the liver in the tumor-bearing mice by hematoxylin and eosin (HE) staining (circled in red line). Scale bar = 50 μm. Data are presented as the mean ± SD. **P < 0.01, ****P < 0.0001. PCa prostate cancer, ADPGK ADP-dependent glucokinase, SD standard deviation, NC negative control, OE overexpression
Fig. 5
Fig. 5
ADPGK controls PCa metabolic fitness. Principal component analysis (PCA) of the metabolomics of glycolysis (a) and the TCA cycle (b). c HCA plot from metabolomics of glycolysis. d Normalized levels of glycolytic products after ADPGK overexpression in PC3 cells. e HCA plot from metabolomics of TCA products. f Normalized levels of TCA products after ADPGK overexpression in PC3 cells. g A volcano plot from quantitative proteomics showed the differentially expressed proteins identified by quantitative proteomics (P-value < 0.05; |log2 fold change|> 1.3). GO (h) and KEGG (i) enrichment analysis of upregulated genes. ECAR (j) and OCR (k) tests in PC3M cells (n = 3). ECAR (l) and OCR (m) tests were performed in LNCaP cells after incubation with 8-Bromo-AMP for 72 h (n = 4). Data are presented as the mean ± SD. *P < 0.05, **P < 0.01, ***P < 0.001, ****P < 0.0001, ns non-significant. PCa prostate cancer, ADPGK ADP-dependent glucokinase, PEP phosphoenolpyruvate, G6P glucose-6-phosphate, DGA3P 3-phosphoglyceraldehyde, 2,3-DPG 2,3-diphosphoglycerate, TCA tricarboxylic acid, HCA hierarchical cluster analysis, GO Gene Ontology, KEGG Kyoto Encyclopedia of Genes and Genomes, ECAR extracellular acidification rate, OCR oxygen consumption rate, 2-DG 2-deoxy-glucose, FCCP fluorocarbonyl cyanide phenylhydrazone, Rot/AA rotenone/antimycin A, SD standard deviation, NC negative control, OE overexpression, a.u. artificial unit
Fig. 6
Fig. 6
ADPGK regulates PCa glycolysis through AMPK phosphorylation. Effect of ADPGK overexpression on AMPK and p-AMPK protein expression levels in 22Rv1 (a) and PC3 (b) cells. c Effect of ADPGK knockdown by siRNA on AMPK and p-AMPK protein expression levels in LNCaP cells. d Effect of the ADPGK inhibitor 8-Bromo-AMP on AMPK and p-AMPK protein expression levels in 22Rv1 cells. e ECAR test in ADPGK OE and ADPGK OE + 10 μmol/L Compound C (a type of AMPK inhibitor) in PC3 cells (n = 4). f CCK-8 assay showed the cell viability changes after ADPGK overexpression and Compound C addition (10 μmol/L) (n = 7). g ECAR results of siADPGK#3 and siADPGK#3 + 0.5 mmol/L acadesine (AICAR, a type of AMPK agonist) in LNCaP cells (n = 3). h CCK-8 assay showed the cell viability changes after ADPGK knockdown and AICAR addition (0.5 mmol/L) in LNCaP cells (n = 5). Data are presented as the mean ± SD. *P < 0.05, **P < 0.01, ***P < 0.001, ns non-significant. PCa prostate cancer, ADPGK ADP-dependent glucokinase, AMPK AMP-activated protein kinase, NC negative control, OE overexpression, ECAR extracellular acidification rate, 2-DG 2-deoxy-glucose, AICAR acadesine, OD optical density, SD standard deviation, a.u. artificial unit
Fig. 7
Fig. 7
ADPGK binds with ALDOC, activating the AMPK pathway. a Protein–protein interaction network analysis from quantitative proteomics. b Correlation analysis between ADPGK and ALDOC expression from cBioPortal (data from Neuroendocrine Prostate Cancer Multi-Institute). c Immunofluorescence staining for His-tag (blue) and ALDOC (red) primary antibodies in PC3-ADPGK-His-tag cells. The mean colocalization Pearson’s correlation coefficient was 0.78 (n = 3). Scale bar = 20 μm. d Co-immunoprecipitation experiments showed the interactions between ADPGK and ALDOC (5 μg of His-tag and IgG IP antibody). e ALDOC expression in 22Rv1 cells after ADPGK knockdown, as detected by an immunofluorescence assay. The mean immunofluorescence intensity was evaluated by ImageJ software (n = 5). Scale bar = 20 μm. f Effect of ADPGK knockdown on ALDOC expression in 22Rv1 cells detected by Western blotting. Effect of ADPGK overexpression on ALDOC expression in PC3 (g) and 22Rv1 (h) cells detected by Western blotting. i siRNA-mediated ALDOC knockdown detected by Western blotting. ECAR test in LNCaP (j) and 22Rv1 (k) cells after ADPGK or ALDOC knockdown (n = 3). l Effect of ALDOC knockdown on ALDOC, AMPK and p-AMPK expression in 22Rv1 and LNCaP cells. m Effect of ADPGK overexpression and siALDOC#2 on ADPGK, ALDOC, AMPK and p-AMPK expression in PC3 cells. n ALDOC expression status in clinical samples assessed by immunohistochemistry (IHC). Scale bar = 50 μm. o Representative IHC quantification of ADPGK and ALDOC expression status in PCa tissues (χ2 test). p Kaplan‒Meier curves showing the association of ALDOC expression with biochemical recurrence (BCR) in 45 patients. q Kaplan‒Meier curves showing survival outcomes among PCa patients stratified into three groups: ADPGKhigh/ALDOChigh group (n = 16), ADPGKlow/ALDOChigh + ADPGKhigh/ALDOClow group (n = 17), and ADPGKlow/ALDOClow group (n = 12). Data are presented as the mean ± SD. *P < 0.05, **P < 0.01, ***P < 0.001, ****P < 0.0001. PCa prostate cancer, BPH benign prostate hyperplasia, ADPGK ADP-dependent glucokinase, ALDOC aldolase C, AMPK AMP-activated protein kinase, NC negative control, OE overexpression, ECAR extracellular acidification rate, 2-DG 2-deoxy-glucose, SD standard deviation
Fig. 8
Fig. 8
Schematic diagram shows that ADPGK regulates metabolic fitness in PCa progression. ADPGK overexpression significantly promotes the process of glycolysis, and the overproduction of lactate induced Warburg effect further orchestrates the PCa progression. PCa prostate cancer, ADPGK ADP-dependent glucokinase, ALDOC aldolase C, AMPK AMP-activated protein kinase, TCA tricarboxylic acid

Comment in

References

    1. Siegel RL, Miller KD, Wagle NS, Jemal A. Cancer statistics, 2023. CA Cancer J Clin. 2023;73(1):17–48. doi: 10.3322/caac.21763. - DOI - PubMed
    1. Zi H, He SH, Leng XY, Xu XF, Huang Q, Weng H, et al. Global, regional, and national burden of kidney, bladder, and prostate cancers and their attributable risk factors, 1990–2019. Mil Med Res. 2021;8(1):60. - PMC - PubMed
    1. Mottet N, van den Bergh RCN, Briers E, Van den Broeck T, Cumberbatch MG, De Santis M, et al. EAU-EANM-ESTRO-ESUR-SIOG Guidelines on Prostate Cancer-2020 Update Part 1: screening, diagnosis, and local treatment with curative intent. Eur Urol. 2021;79(2):243–62. doi: 10.1016/j.eururo.2020.09.042. - DOI - PubMed
    1. Rebello RJ, Oing C, Knudsen KE, Loeb S, Johnson DC, Reiter RE, et al. Prostate cancer. Nat Rev Dis Primers. 2021;7(1):9. doi: 10.1038/s41572-020-00243-0. - DOI - PubMed
    1. Teo MY, Rathkopf DE, Kantoff P. Treatment of advanced prostate cancer. Annu Rev Med. 2019;70:479–499. doi: 10.1146/annurev-med-051517-011947. - DOI - PMC - PubMed

Publication types