. 2024 Feb;11(5):e2305023.
doi: 10.1002/advs.202305023. Epub 2023 Dec 11.

Regulating Chondro-Bone Metabolism for Treatment of Osteoarthritis via High-Permeability Micro/Nano Hydrogel Microspheres

Affiliations

Regulating Chondro-Bone Metabolism for Treatment of Osteoarthritis via High-Permeability Micro/Nano Hydrogel Microspheres

Guilai Zuo et al. Adv Sci (Weinh). 2024 Feb.

Abstract

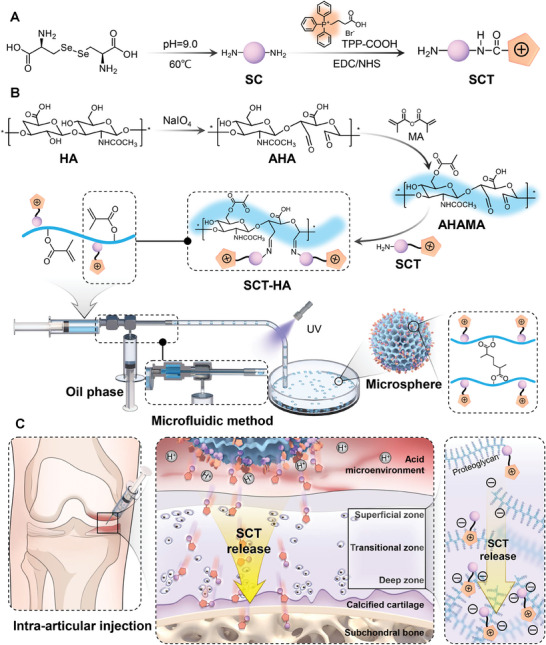
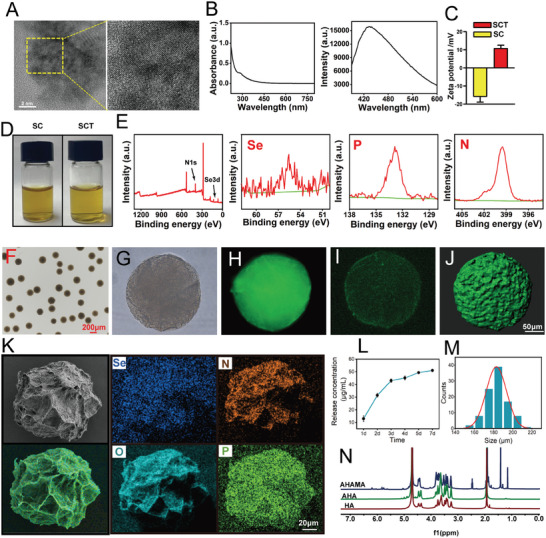
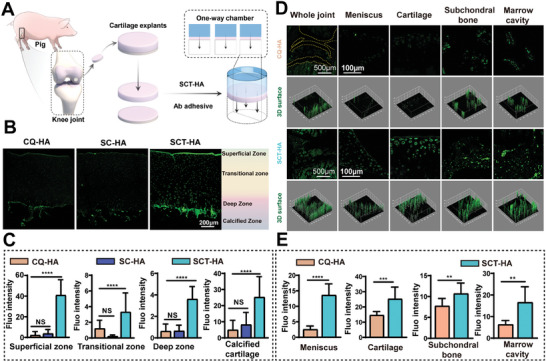
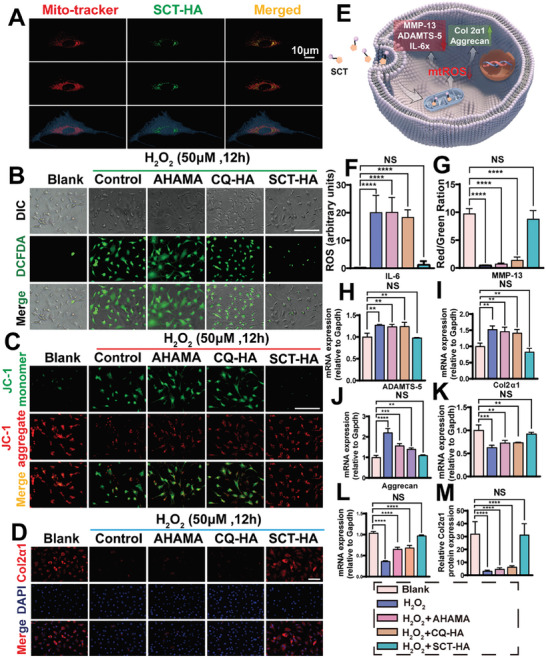
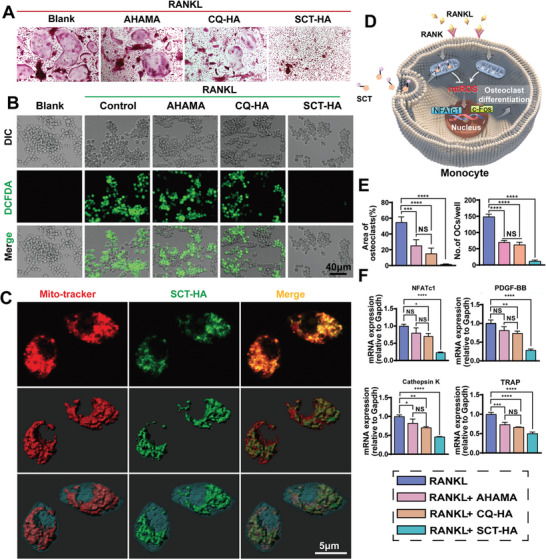
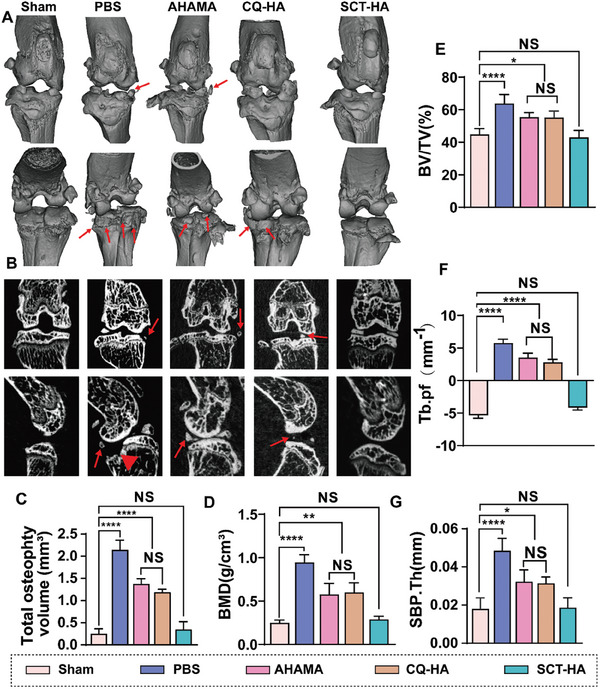
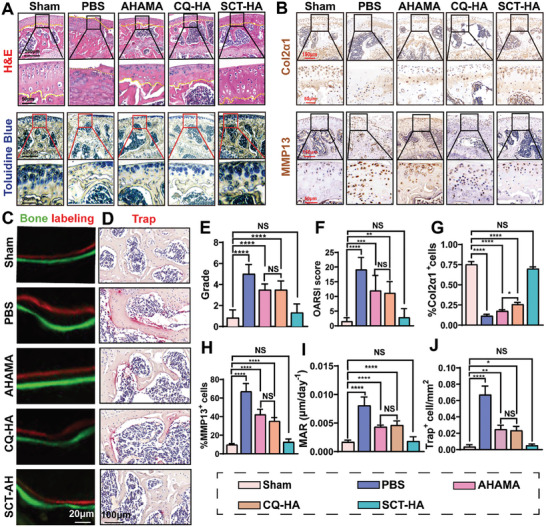
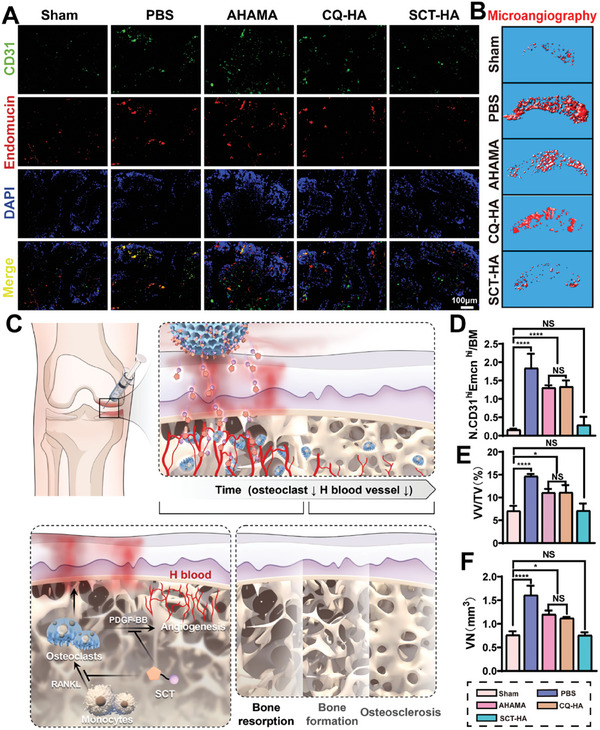
Destruction of cartilage due to the abnormal remodeling of subchondral bone (SB) leads to osteoarthritis (OA), and restoring chondro-bone metabolic homeostasis is the key to the treatment of OA. However, traditional intra-articular injections for the treatment of OA cannot directly break through the cartilage barrier to reach SB. In this study, the hydrothermal method is used to synthesize ultra-small size (≈5 nm) selenium-doped carbon quantum dots (Se-CQDs, SC), which conjugated with triphenylphosphine (TPP) to create TPP-Se-CQDs (SCT). Further, SCT is dynamically complexed with hyaluronic acid modified with aldehyde and methacrylic anhydride (AHAMA) to construct highly permeable micro/nano hydrogel microspheres (SCT@AHAMA) for restoring chondro-bone metabolic homeostasis. In vitro experiments confirmed that the selenium atoms scavenged reactive oxygen species (ROS) from the mitochondria of mononuclear macrophages, inhibited osteoclast differentiation and function, and suppressed early chondrocyte apoptosis to maintain a balance between cartilage matrix synthesis and catabolism. In vivo experiments further demonstrated that the delivery system inhibited osteoclastogenesis and H-vessel invasion, thereby regulating the initiation and process of abnormal bone remodeling and inhibiting cartilage degeneration in SB. In conclusion, the micro/nano hydrogel microspheres based on ultra-small quantum dots facilitate the efficient penetration of articular SB and regulate chondro-bone metabolism for OA treatment.

Keywords: high-permeability; hydrogel microsphere; osteoarthritis; subchondral bone.


Conflict of interest statement

The authors declare no conflict of interest.

Figures

Scheme 1
Scheme 1
A) SCT synthesis. B) SCT‐HA preparation using microfluidic technology, which includes the synthesis process of AHAMA. C) SCT‐HA releases SCT continuously in a weakly acidic environment within the joint cavity, allowing it to penetrate the cartilage matrix and reach the SB for OA treatment. SC, SCT, HA, AHA, AHAMA and aha represent selenium‐doped carbon quantum dots, TPP‐doped SC, hyaluronic acid, hyaluronic acid modified with aldehyde and hyaluronic acid modified with aldehyde and methacrylic anhydride, respectively.
Figure 1
Figure 1
Preparation and characterization of highly permeable targeted bone/chondrocyte mitochondrial micro/nano hydrogel microspheres. A) TEM image of the SCT. B) UV absorption spectra and fluorescence spectra of the SCT. C) Zeta‐potential measurements of SC and SCT aqueous solutions. D) Photographs of SC and SCT in solution. E) Se, P, and N XPS spectra in the SCT. F) Light microscopy of SCT‐HA hydrogel microspheres prepared by microfluidic technology. G) Light micrographs of individual SCT‐HA hydrogel microspheres. H) Fluorescence micrographs of individual SCT‐HA hydrogel microspheres. I) Photographs of individual SCT‐HA hydrogel microspheres under laser confocal microscopy. J) 3D rendering of individual SCT‐HA hydrogel microspheres using Imris software. K) SEM images of SCT‐HA and elemental mapping. L) Release curves of SCT‐HA microspheres. M) Particle size distribution of microspheres. N) 1H NMR spectra of AHAMA, AHA, and HA was used to identify aldehyde and methacrylic anhydride groups.
Figure 2
Figure 2
SB penetration of SCT‐HA in vitro and in vivo. A) Schematic illustration of the penetration assay of SCT‐HA in cartilage explants. B) Laser scanning confocal images of CQ‐HA, SC‐AHAMA (SC‐AH), and SCT‐HA penetrating articular cartilage explants. C) Fluorescence intensity analysis of the three materials penetrating the superficial zone, transitional zone, deep zone, and calcified cartilage of articular cartilage explants. n = 4 per group. D) Observation of the entire joint, meniscus, cartilage, SB, and bone marrow cavity in mouse knee sections after CQ‐HA and SCT‐HA injection into the joint cavity using laser scanning confocal observation and 3D surface reconstruction. E) Fluorescence intensity analysis of the meniscus, cartilage, SB, and marrow cavity in the knee joint of mice after CQ‐HA and SCT‐HA penetration. n = 4 per group. C) The data (mean ± standard deviation) were quantified using one‐way ANOVA followed by Tukey's posthoc multiple comparison test. N S: no significance. The p‐values < 0.05, 0.01, 0.001, and 0.0001 are presented as *, **, ***, and ****, respectively. E) The data (mean ± standard deviation) were quantified using Two‐tailed unpaired t‐test. NS: not significant. The p‐values < 0.05, 0.01, 0.001, and 0.0001 are presented as *, **, ***, and ****, respectively.
Figure 3
Figure 3
Protection of chondrocytes from H2O2‐induced ROS damage by highly permeable targeted bone/chondrocyte mitochondria micro/nano hydrogel microspheres. A) SCT‐HA targeting to the mitochondria in mouse chondrocytes: LSCM images showing Mito‐tracker mitochondrial dye (red), SCT autofluorescence (green), and merged (yellow). Mitochondria, SCT, and cell outlines (red, green, and blue) were reconstructed using Imris. B) Inhibition of H2O2‐induced ROS production by micro/nano hydrogel microspheres, DCFH‐DA staining of chondrocytes (green) indicating H2O2‐induced ROS production; scale bar = 100 µm. C) JC‐1 stain images of depolarized mitochondrial membranes after H2O2 intervention in chondrocytes. scale bar = 100 µm. D) Representative images showing the Col2α1 in chondrocytes treated with 50 µm H2O2 and co‐cultured with AHAMA, CQ‐HA, and SCT‐HA for 12 h; scale bar = 100 µm. E) SCT‐HA by targeting chondrocyte mitochondria inhibits ROS production, promotes cartilage anabolism, and inhibits chondrocyte catabolism and inflammation. F) Analysis of DCFH‐DA fluorescence intensity after H2O2 intervention in chondrocytes. n = 4 per group. G) Fluorescence intensity statistics of JC‐1 aggregate (red) and monomer (green) after H2O2 intervention in chondrocytes. n = 3 per group. H) IL‐6, I) MMP13, J) ADAMTS5, K) Col2α1, and L) Aggrecan expression in different groups after 12 h of treatment with 50 µM H2O2 on chondrocytes. n = 3 per group M) Immunofluorescence intensity statistics of the Col2α1 protein after H2O2 intervention in chondrocytes. n = 4 per group. F–M) The data (mean ± standard deviation) were quantified using one‐way ANOVA followed by Tukey's posthoc multiple comparison test. NS: no significance. The p‐values < 0.05, 0.01, 0.001, and 0.0001 are presented as *, **, ***, and ****, respectively.
Figure 4
Figure 4
Inhibition of osteoclast differentiation and function through highly permeable targeted bone/chondrocyte mitochondrial micro/nano hydrogel microspheres. A) TRAP staining showing SCT‐HA inhibition of osteoclast differentiation induced by RANKL. B) SCT‐HA suppresses RANKL‐induced ROS production in RAW246.7 cells, as evidenced by the green DCFH‐DA staining. C) SCT‐HA specifically targets the mitochondria of RAW246.7 cells by laser confocal images of Mito‐tracker dye (red), SCT autofluorescence (green), and merged (yellow). The Imris reconstruction illustrates the mitochondrial dye, SCT, and cell outline (red, green, and blue). D) SCT‐HA targets mitochondria in mononuclear macrophages, leading to the inhibition of ROS production and suppression of osteoclast differentiation‐associated signaling pathways. E) Statistical analysis of TRAP staining in different treatment groups involved in osteoclast differentiation. n = 5 per group. F) Expression levels of osteoclast‐associated genes NFATc1, PDGF‐BB, Cathepsin K, and TRAP after three days of treatment in different subgroups. n = 3 per group. E‐F) The data (mean ± standard deviation) were quantified using one‐way ANOVA followed by Tukey's posthoc multiple comparison test. NS: no sgnificance. The p‐values < 0.05, 0.01, 0.001, and 0.0001 are presented as *, **, ***, and ****, respectively.
Figure 5
Figure 5
Radiographic evaluation of SCT‐HA for OA treatment. A) Representative anterior and posterior 3D reconstructed Micro‐CT images of the knee joint; red arrows indicate the presence of osteophytes. B) Representative coronal and sagittal 2D Micro‐CT images of the knee joint; red arrows indicate the presence of osteophyte s, and red triangles represent joint surface collapse. C) Statistical analysis of osteophytes volume. D) Statistical analysis of bone mineralization density (BMD) in the SB plate of each treatment group. Statistical analysis of E) Bone Volume Fraction (BV/TV), F) Trabecular Separation (Tb.pf), and G) SB Plate Thickness (SBP.Th) in each treatment group. C‐G) Data (mean ± standard deviation) were quantified from three independent experiments, one‐way ANOVA with a Tukey's posthoc multiple comparison test. The sham group were healthy mice, and the other groups were OA models. NS: no significance. The p‐values < 0.05, 0.01, 0.001, and 0.0001 are presented as *, **, ***, and ****, respectively.
Figure 6
Figure 6
The SCT‐HA inhibits abnormal bone remodeling in the SB and prevents cartilage degradation. A) Representative images of toluidine blue and H&E staining. B) Col2α1 and MMP13 levels by immunohistochemical staining. C) Calcein green and Alizarin red double labeling using fluorescence microscopy. D) Representative TRAP‐stained SB sections of the tibia. E) Grade and F) OARSI scores. n = 6 per group. G) Summarized results of relative Col2α1 expression. n = 6 per group. H) MAR quantification. n = 5 per group. J) Quantification of TRAP+ multinuclear cells. n = 6 per group. E–J) Data (mean ± standard deviation) were quantified from three independent experiments, one‐way ANOVA with a Tukey's posthoc multiple comparison test. NS: no significance. The p‐values < 0.05, 0.01, 0.001, and 0.0001 are presented as *, **, ***, and ****, respectively.
Figure 7
Figure 7
The SCT‐HA inhibits blood vessel formation in the SB. A) Immunofluorescence images of H‐vessels (CD31hiEmcnhi) in SB of each treatment group. B) Microfil MV‐122 angiography of the SB in each treatment group after 3D reconstruction with Micro‐CT. C) Schematic diagram illustrating the inhibition of abnormal SB remodeling by SCT‐HA. SCT‐HA inhibits the differentiation of monocyte macrophages into osteoclasts and PDGF‐BB production to suppress the abnormal invasion of SB blood vessels in OA. By inhibiting blood vessels, which act as the “executors” of abnormal bone remodeling, SCT‐HA also prevents the occurrence of abnormal bone remodeling in SB. D) Quantitative statistical analysis on the H‐vessels within the SB of each group. n = 6 per group. E) Vascular volume relative to the tissue volume (VV/TV) in the SB. n = 3 per group. F) Vessel number (VN). n = 3 per group. D‐F) Data (mean ± standard deviation) were quantified from three independent experiments, one‐way ANOVA with a Tukey's posthoc multiple comparison test. NS: no significance. The p‐values < 0.05, 0.01, 0.001, and 0.0001 are presented as *, **, ***, and ****, respectively.
Figure 8
Figure 8
Transcriptional profiling of SCT‐HA regulating SB function on mouse OA model. A) Volcano plots for PBS versus Sham and SCT‐HA versus PBS group comparisons. Upregulated genes are marked red, and downregulated genes are marked blue. B) Heatmap illustrating the differential gene expression for PBS versus Sham and SCT‐HA versus PBS groups. Functional enrichment analysis of KEGG pathways using differentially expressed genes (DEGs) between C) PBS versus Sham groups D) SCT‐HA versus PBS groups. E) Alterations in osteoclast activation‐related genes between the SCT‐HA and PBS groups. Blue indicates downregulated osteoclast‐related genes, while purple indicates upregulated osteoclast‐related genes. F) GSEA of KEGG pathways between SCT‐HA and PBS groups. Normalized enrichment scores (NES) represent the combined dataset of KEGG pathway gene sets. (G, H, I) GSEA after applying a threshold screening.

Similar articles

Cited by

References

    1. Liu Y., Xie H.‐Q., Shen B., Rheumatology 2023, 62, 1436. - PubMed
    1. Hu Y., Chen X., Wang S., Jing Y., Su J., Bone Res. 2021, 9, 20. - PMC - PubMed
    1. Karsdal M. A., Leeming D. J., Dam E. B., Henriksen K., Alexandersen P., Pastoureau P., Altman R. D., Christiansen C., Osteoarthr. Cartil. 2008, 16, 638. - PubMed
    1. Burr D. B., Gallant M. A., Nat. Rev. Rheumatol. 2012, 8, 665. - PubMed
    1. Didomenico C. D., Lintz M., Bonassar L. J., Nat. Rev. Rheumatol. 2018, 14, 393. - PubMed

Publication types

LinkOut - more resources