. 2023 Dec 9:16:17562864231211077.
doi: 10.1177/17562864231211077. eCollection 2023.

Single-cell profiling reveals preferential reduction of memory B cell subsets in cladribine patients that correlates with treatment response

Affiliations

Single-cell profiling reveals preferential reduction of memory B cell subsets in cladribine patients that correlates with treatment response

Valerie E Teschner et al. Ther Adv Neurol Disord. .

Abstract

Background: Cladribine is a highly effective immunotherapy that is applied in two short-term courses over 2 years and reduces relapse rate and disease progression in patients with relapsing multiple sclerosis (MS). Despite the short treatment period, cladribine has a long-lasting effect on disease activity even after recovery of lymphocyte counts, suggesting a yet undefined long-term immune modulating effect.

Objectives: Our aim was to provide a more profound understanding of the detailed effects of cladribine, also with regard to the patients' therapy response.

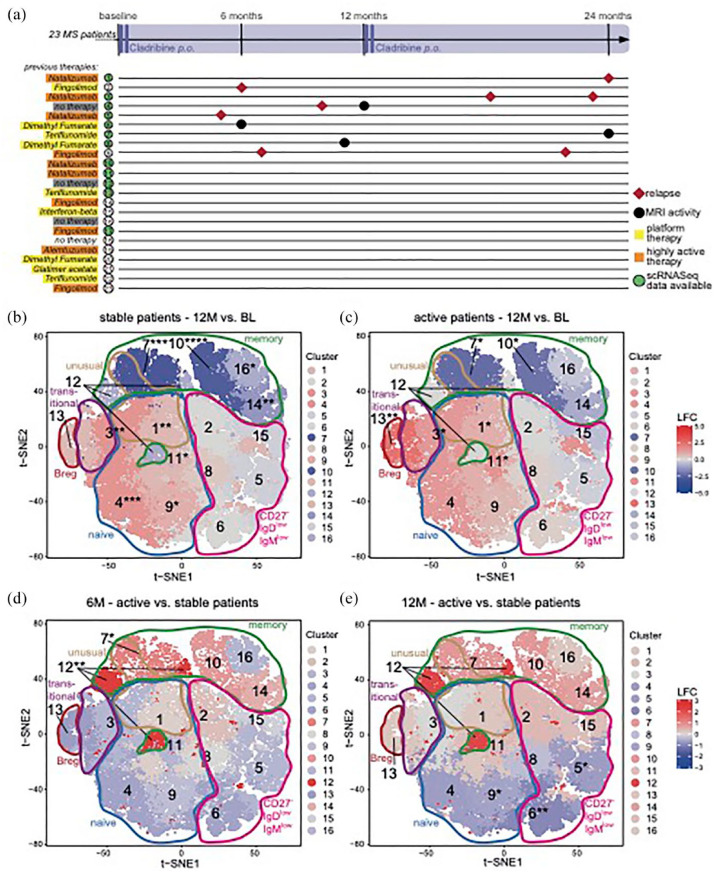
Design: We performed an open-labeled, explorative, prospective, single-arm study, in which we examined the detailed lymphocyte subset development of MS patients who received cladribine treatment over 2 years.

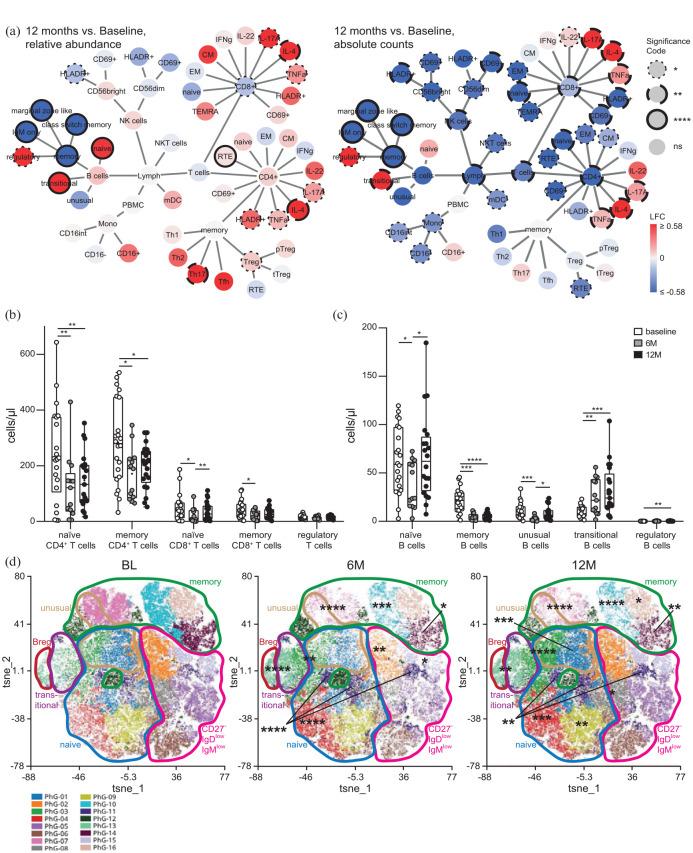
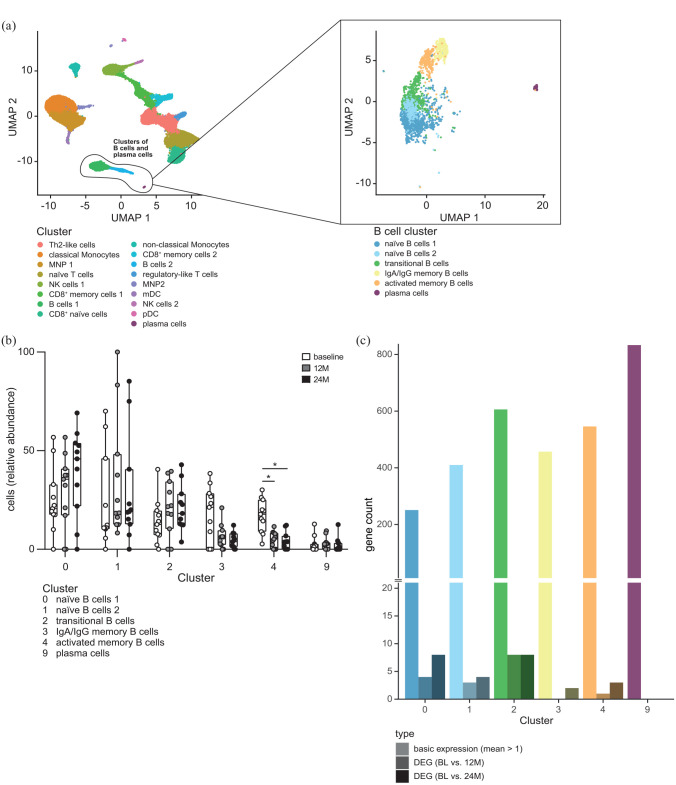
Methods: We performed in-depth profiling of the effects of cladribine on peripheral blood lymphocytes by flow cytometry, bulk RNA sequencing of sorted CD4+ T cells, CD8+ T cells, and CD19+ B cells as well as single-cell RNA sequencing of peripheral blood mononuclear cells in a total of 23 MS patients before and at different time points up to 24 months after cladribine treatment. Data were correlated with clinical and cranial magnetic resonance imaging (MRI) disease activity.

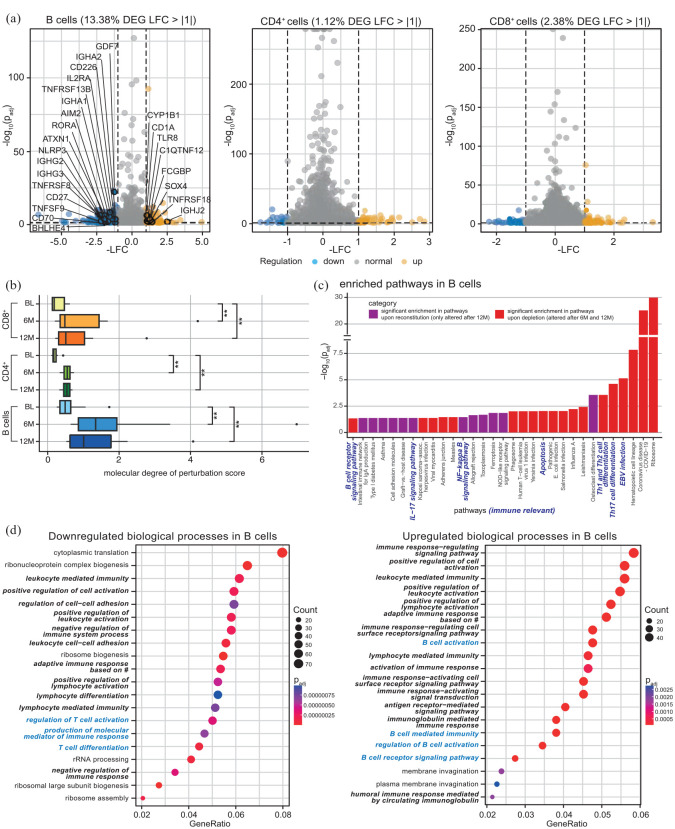
Results: Flow cytometry revealed a predominant and sustained reduction of memory B cells compared to other B cell subsets after cladribine treatment, whereas T cell subsets were slightly reduced in a more uniform pattern. The overall transcriptional profile of total blood B cells exhibited reduced expression of proinflammatory and T cell activating genes, while single-cell transcriptomics revealed that gene expression within each B cell cluster did not change over time. Stable patients displayed stronger reductions of selected memory B cell clusters as compared to patients with clinical or cerebral MRI disease activity.

Conclusion: We describe a pronounced and sustained effect of cladribine on the memory B cell compartment, and the resulting change in B cell subset composition causes a significant alteration of B cell transcriptional profiles resulting in reduced proinflammatory and T cell activating capacities. The extent of reduction in selected memory B cell clusters by cladribine may predict treatment response.

Keywords: cladribine; memory B cells; multiple sclerosis.


Figures

Figure 1.
Figure 1.
Immune cell subset composition in the peripheral blood of patients with RRMS under cladribine therapy at BL, after 6 (6M) and 12 months (12M) assessed by flow cytometry. (a) Network representation showing up- and downregulation of immune cell subsets comparing the time points 12M to BL (n = 21 patients). Statistical analysis was conducted by Wilcoxon signed rank test followed by correction for multiple testing using FDR. Significant changes are shown as dotted lines (*p ⩽ 0.05), dashed lines (**p ⩽ 0.01), long-dashed lines (***p ⩽ 0.001), and solid lines (****p ⩽ 0.0001) at the node borders. The color of the nodes signifies the LFC in up- (red) or downregulation (blue) of median-cell subset percentage abundances (left) or of absolute cell subset counts (right) after cladribine treatment as compared to baseline. (b and c) Corresponding box plots illustrating absolute counts of naïve and memory CD4+, CD8+, and regulatory CD4+ T cells (b), as well as naïve, memory, transitional, unusual, and regulatory B cells (c) before (BL, n = 22), after 6M (n = 14) and 12M (n = 21) of cladribine therapy initiation. (d) t-SNE representations obtained from concatenated samples per time point as in (c) consisting of CD19+ CD20+ B cells. Unsupervised clustering by PhenoGraph identified cell clusters is indicated by colors/numbers, encirclements depict B cell subsets as defined by differential marker expression based on single marker plots (Supplemental Figure 4). Statistical significance of changes after 6M and 12M compared to BL were assessed by Dunn’s test with FDR-correction for multiple comparisons as depicted by asterisks on clusters. BL, baseline; FDR, false discovery rate; LFC, log2 fold changes; RRMS, relapsing-remitting multiple sclerosis; t-SNE, t-distributed stochastic neighbor embedding.
Figure 2.
Figure 2.
Bulk transcriptomic analysis of flow cytometry-sorted B cells, CD4+ and CD8+ T cells from frozen PBMC of 12 RRMS patients at BL, after 6 and 12 months after cladribine therapy initiation (6M, 12M). (a) Volcano plots displaying significantly down- (LFC < −1, blue) and upregulated (LFC > 1, yellow) DEG (adjusted p-value ⩽0.05) comparing 12 months after cladribine therapy initiation to BL of B cells (highlighted are immune-relevant genes), CD4+ and CD8+ T cells. (b) Molecular degree of perturbation scores for B cells, CD4+ and CD8+ cells were calculated for all three time points, with the respective BL group as reference based on the cohort filtered for matched data (n = 10). (c) Pathway enrichment analysis in B cells. DEG for the time points 6M and 12M (each in comparison to BL) were used as input; the resulting pathways were classified as ‘significant enrichment upon reconstitution’ (i.e. only altered after 12M, padj < 0.05) or ‘significant enrichment upon depletion’ (i.e. altered after 6M and 12M, padj < 0.05) depending on their enrichment patterns. (d) Enrichment analysis of GO, BP based on differential expression analysis of bulk RNA sequencing data. Enrichment analysis based on significantly downregulated (c) and upregulated (d) DEG of B cells comparing 12M to BL. Shown are the top 20 GO enrichment terms for BP, including respective gene counts. GeneRatio stands for relevant genes for the tested term divided by total input genes. Immune-relevant pathways are marked in bold italic, B cell-relevant pathways in blue bold italic. Adjusted p-values were calculated through a hypergeometric distribution. Dot sizes correspond to the number of genes from the input lists that are enriched for each GO term. # = somatic recombination of immune receptors built from immunoglobulin superfamily domains. BL, baseline; BP, biological process; DEG, differentially expressed gene; GO, gene ontology; LFC, log2 fold change; padj, adjusted p-value; PBMC, peripheral blood mononuclear cells; RRMS, relapsing-remitting multiple sclerosis.
Figure 3.
Figure 3.
Single-cell transcriptomic analysis from frozen PBMC of RRMS patients (n = 11) at BL, after 12 (12M), and 24 months (24M) of cladribine therapy initiation. (a) UMAP plot representing all cell cluster (left) identified (all time points: BL, 12M, 24M). UMAP plot (right) represents a subset analysis of B cell and plasma cell clusters (highlighted and based on left UMAP). Cluster names were assigned based on marker gene expressions [feature definition is depicted in Supplemental Figure 8(A) and (B)]. (b) Grouped box plots show relative abundance of distinct B cell and plasma cell clusters for BL, 12M, and 24M after cladribine therapy initiation. Cluster defined as in Supplemental Figure 8(B). (c) Total gene counts with chosen expression patterns per cluster. Depicted are the number of genes with a minimum average expression level found in each cluster (mean count > 1; shown in bright/on the left side), as well as the number of differentially expressed genes between the conditions BL and 12M (shaded/center) and between BL and 24M (dark/right) within each cluster (adjusted p-value < 0.05). BL, baseline; PBMC, peripheral blood mononuclear cells; RRMS, relapsing-remitting multiple sclerosis; UMAP, uniform manifold approximation and projection.
Figure 4.
Figure 4.
Dynamics of B cell clusters as determined by flow cytometry of 23 cladribine treated RRMS patients at BL, 6 (6M) and 12 months (12M) in relation to treatment response. (a) Schematic visualization of relapses and MRI activity of all 23 patients investigated. Previous disease modifying therapies categorized as platform therapy (teriflunomide, glatiramer acetate, dimethyl fumarate, interferon beta formulation, yellow) and highly active therapy (fingolimod, natalizumab, alemtuzumab, orange). Additional information is summarized in Supplemental Table 3. Grey = therapy naïve patients. Single-cell sequencing analysis available of patients with green marked numbers [Figure 3]. (b–e) t-SNE-based heatmaps with PhenoGraph clustering and encirclements as in Figure 1(d) of stable [(b) nBL+12M = 13] and active [(c) nBL = 9, n12M = 8] patient cohorts, comparing the time points 12M to BL and of time points 6M [(d) nact = 5, nsta = 9] and 12M [(e) nact = 5, nsta = 16], comparing active to stable patient cohorts. The color of the cluster signifies the LFC of cluster abundance in up- (red) or downregulation (blue) 12M as compared to BL (b and c) or active compared to stable (d and e). Statistical significance (b–e) of changes was assessed by Dunn’s test with false discovery rate-correction for multiple comparisons as depicted by asterisks next to cluster numbers and in the corresponding box plots. BL, baseline; LFC, log2 fold change; MRI, magnetic resonance imaging; PBMC, peripheral blood mononuclear cells; RRMS, relapsing-remitting multiple sclerosis; t-SNE, t-distributed stochastic neighbor embedding.

References

    1. Liu R, Du S, Zhao L, et al.. Autoreactive lymphocytes in multiple sclerosis: pathogenesis and treatment target. Front Immunol 2022; 13: 996469. - PMC - PubMed
    1. Dendrou C, Fugger L, Friese M. Immunopathology of multiple sclerosis. Nat Rev Immunol 2015; 15: 545–558. - PubMed
    1. Hohlfeld R, Dornmair K, Meinl E, et al.. The search for the target antigens of multiple sclerosis, part 1: autoreactive CD4+ T lymphocytes as pathogenic effectors and therapeutic targets. Lancet Neurol 2016; 15: 198–209. - PubMed
    1. Dugast E, Shah S, Laplaud D. Single-cell analysis to better understand the mechanisms involved in MS. Int J Mol Sci 2022; 23: 12142. - PMC - PubMed
    1. Leist T, Weissert R. Cladribine: mode of action and implications for treatment of multiple sclerosis. Clin Neuropharmacol 2011; 34: 28–35. - PubMed