A method with ultra-high angular resolution for X-ray diffraction experiments
- PMID: 38084592
- PMCID: PMC10833433
- DOI: 10.1107/S160057752300961X
A method with ultra-high angular resolution for X-ray diffraction experiments
Abstract
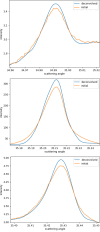
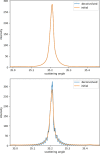
In X-ray diffraction measurements, the angular resolution has a detection limit due to the receiving size of the detector. In many cases this detection limit is too large and must be breached to obtain the desired information. A novel method is proposed here by making the detector simultaneously measuring and moving. Using the deconvolution algorithm to remove the convolution effect, the pixel size limitation is finally broken. The algorithm used is not a common one, and suppresses signals at high frequencies, ensuring the reliability of the peak shape after restoration. The feasibility of this method is verified by successfully measuring the crystal truncation rod signal of SrTiO3 single crystal, and the resolution is nearly ten times higher than that of a single pixel. Moreover, this method greatly reduces the noise and improves the signal-to-noise ratio.
Keywords: X-ray diffraction; crystal truncation rod; deconvolution; super resolution.
open access.
Figures


References
-
- Agrawal, A., Xu, Y. & Raskar, R. (2009). ACM Trans. Graph. 28, 1–8.
-
- Biggs, D. & Andrews, M. (1997). Appl. Opt. 36, 1766. - PubMed
-
- Disselhorst-Klug, C., Silny, J. & Rau, G. (1997). IEEE Trans. Biomed. Eng. 44, 567–574. - PubMed
-
- Egan, M. S., Seissiger, J., Salama, A. & El-Kaseeh, G. (2010). CSEG Recorder, 35, 29–36.
-
- Gozzo, F., Schmitt, B., Bortolamedi, Th., Giannini, C., Guagliardi, A., Lange, M., Meister, D., Maden, D., Willmott, P. & Patterson, B. D. (2004). J. Alloys Compd. 362, 206–217.
Grants and funding
LinkOut - more resources
Full Text Sources

