

Prevalence and temporal trend of gastric preneoplastic lesions in Asia: A systematic review with meta-analysis
- PMID: 38084663
- PMCID: PMC10859711
- DOI: 10.1002/ueg2.12507
Prevalence and temporal trend of gastric preneoplastic lesions in Asia: A systematic review with meta-analysis
Abstract
Background: Gastric cancer is the fifth most common cancer globally, with about 75% of cases occurring in Asia. While chronic atrophic gastritis (CAG) and intestinal metaplasia (IM) are well-recognized preneoplastic gastric lesions, we determined the prevalence and temporal trend of CAG and IM in Asia over the past 50 years.
Methods: In this systematic review and meta-analysis, we searched PubMed, Embase, MEDLINE, Scopus, and Web of Science for studies reporting the prevalence of CAG and IM in Asia (according to the United Nations geoscheme) published between 1970 and 2022. Heterogeneity was assessed by the I2 index and Cochran Q test. We adopted the random effects model to estimate the pooled prevalence and 95% confidence interval (CI). The slope of prevalence was estimated as a function of time in simple linear regression and weighted meta-regression models to demonstrate the temporal trend. Studies that reported the odds ratio (OR) of Helicobacter pylori infection and CAG/IM were analyzed separately to compile a pooled OR with a 95% CI. This study was registered in INPLASY2022120028.
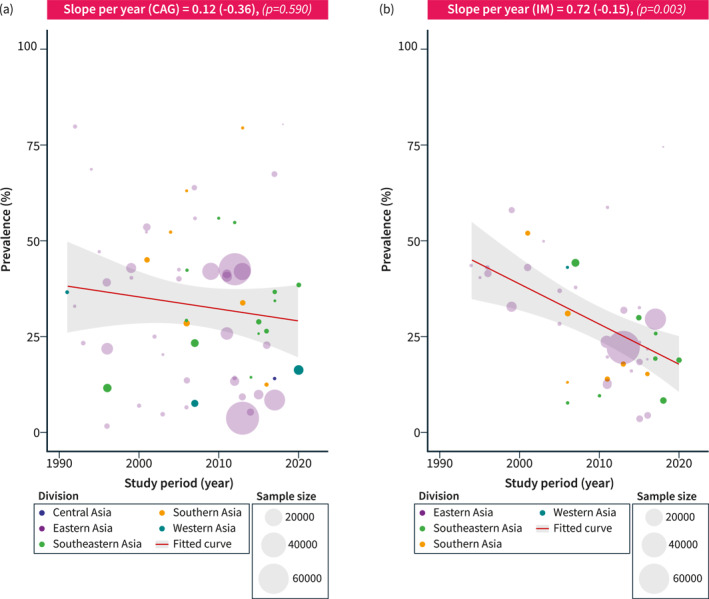
Results: Of the 81 studies from 19 Asian countries identified, the pooled prevalence for CAG and IM in Asia was 26.1% (95%CI: 22.7-30.0) and 22.9% (95%CI: 19.7-26.6), respectively. Over the past 5 decades, there was a significant decline in the prevalence of IM (slope in adjusted meta-regression models: -0.79 [95%CI: -1.28 to -0.26], P = 0.003), but there was no significant change in the pooled prevalence of CAG. Within Asia, the prevalence varied significantly among different regions. Southern Asia reported the highest pooled prevalence of CAG (42.9%, 95%CI: 27.5%-67.1%), while Western Asia reported the lowest level (12.7%, 95%CI: 5.0%-32.3%). For IM, Eastern Asia reported the highest prevalence (27.1%, 95%CI: 21.1-34.9), with the lowest prevalence reported in Western Asia (3.1%; 95% CI 1.2%-8.0%). H. pylori infection was linked to CAG and IM with OR of 2.16 (95%CI: 2.09-2.22) and 1.64 (95%CI: 1.57-1.72), respectively.
Conclusion: This updated meta-analysis showed that up to 26% of study individuals in Asia harbored preneoplastic gastric lesions. There was a declining temporal trend in the prevalence of IM, but not for CAG, in Asia.
Keywords: epidemiology; gastric atrophy; gastric cancer; gastric preneoplastic lesion; intestinal metaplasia; prevalence; systematic review.
© 2023 The Authors. United European Gastroenterology Journal published by Wiley Periodicals LLC on behalf of United European Gastroenterology.
Conflict of interest statement
The authors declare no conflicts of interest.
Figures


References
Publication types
MeSH terms
LinkOut - more resources
Full Text Sources
Medical
Miscellaneous
