. 2024 Mar;61(3):e14499.
doi: 10.1111/psyp.14499. Epub 2023 Dec 12.

The effect of hair type and texture on electroencephalography and event-related potential data quality

Affiliations

The effect of hair type and texture on electroencephalography and event-related potential data quality

Ty Lees et al. Psychophysiology. 2024 Mar.

Abstract

Research utilizing event-related potential (ERP) methods is generally biased with regard to sample representativeness. Among the myriad of factors that contribute to sample bias are researchers' assumptions about the extent to which racial differences in hair texture, volume, and style impact electrode placement, and subsequently, study eligibility. The current study examines these impacts using data collected from n = 213 individuals ages 17-19 years, and offers guidance on collection of ERP data across the full spectrum of hair types. Individual differences were quantified for hair texture using a visual scale, and for hair volume by measuring the amount of gel used in cap preparation. Electroencephalography data quality was assessed with multiple metrics at the preprocessing, post-processing, and variable generation stages. Results indicate that hair volume is associated with small, but systematic differences in signal quality and signal amplitude. Such differences are highly problematic as they could be misattributed to cognitive differences among groups. However, inclusion of gel volume as a covariate to account for individual differences in hair volume significantly reduced, and in most cases eliminated, group differences. We discuss strategies for overcoming real and perceived technical barriers for researchers seeking to achieve greater inclusivity and representativeness in ERP research.

Keywords: EEG; diversity; ethnicity; hair style; race; representation.


Figures

Figure 1 –
Figure 1 –. Classification of hair type and texture across the 8 possible categories for the low and high texture/curl groups.
Note: The histogram illustrates the distribution of participants across the 8 hair categories. Beneath each category is an example image of a participant who self-identified in that category. For the participants who did not provide a self-classification, the RA rating was substituted. Following guidance in previous research, categories were reduced into two groups, Hair Group 1 consisted of categories 1 through 3 and Hair Group 2 consisted of categories 4 through 8. Images for categories 6 and 7 additionally illustrate protective hairstyles represented in the sample.
Figure 2 –
Figure 2 –. Trial format of the electrophysiology Monetary Incentive Delay (eMID) task.
Note: On each trial, participants were initially presented with a cue stimulus indicating the trial type (i.e., gain, loss, neutral) and possible outcome (i.e., gain points, avoid gaining points, lose points, avoid losing points, no loss or gain). Following the first inter-stimulus interval (ISI) participants were shown a target stimulus to which participants were required to respond (marked by the red line, responset) to as quickly as possible. After a second ISI, participants were shown a feedback stimulus indicating the outcome of the trial.
Figure 3 –
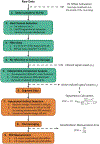
Figure 3 –. Schematic illustration of the automated ERP pre-processing pipeline used and its various output variables.
Note: The present processing pipeline consisted of 9 possible steps and their various sub-steps. Steps 1–5 (marked in green) were applied to both the baseline recording and the task recording, while Steps 6–9 (marked in orange) were only applied to the task recording. Solid lines indicate the the progression of the pipeline through its various steps, and the dashed lines indicate the points at which the output variables were exported from the pipeline. SEM = Standardized Measurement Error; SNR = Signal-to-Noise Ratio
Figure 4 –
Figure 4 –. Grand average P1 waveforms and corresponding scalp topography for all participants.
Note: Plot A presents the grand average P1 waveforms as derived at the P7 and Plot B presents the grand average P1 waveform at the P8 electrode for the full sample. Polarity is such that positive values are plotted up, and the shaded region indicates the window of measurement. On the right-hand side of the image, the scalp topography corresponding to these waveforms is plotted as the average amplitudes across the 60 – 160 ms post-cue stimuli window.
Figure 5 –
Figure 5 –. Grand average P3b waveform and correspond scalp topography for all participants.
Note: The left-hand side of the image plots the grand average P3b waveforms as derived at the Pz electrode for the full sample. Polarity is such that positive values are plotted up, and the shaded region indicates the window of measurement. On the right-hand side of the image, the scalp topography corresponding to the Pz waveform is plotted as the average amplitudes across the 250 – 550 ms post-cue stimuli window.
Figure 6 –
Figure 6 –. Comparison of baseline DC Offset values between self-categorized hair groups across different brain regions.
Note: Figure 6A presents the observed DC offset values computed for the five investigated brain regions, and the accompanying post-hoc between-group comparisons of the estimated marginal means from the simple model predicting DC offset of the baseline recording. Figure 6B presents the results for the same model with gel volume included as a covariate. Across both figures the solid and dashed lines plot the estimated marginal means (with error bars representing the standard error) for hair groups 1 (green) and 2 (orange) respectively, while the violin plots depict the observed data. Underneath each plot are the tabulated type 3 omnibus test results for the respective model that predicted lobular DC offset of the baseline recording. Cent = Central Lobe; df = Degrees of freedom; Front = Frontal Lobe; Occ = Occipital Lobe; Par = Parietal Lobe; Temp = Temporal Lobe ** p < 0.01, *** p < 0.001
Figure 7 –
Figure 7 –. Comparison of baseline Signal-to-Noise ratio values between self-categorized hair groups across midline electrodes.
Note: Figure 7A presents the observed Signal-to-Noise values computed for the five investigated midline electrode locations, and the accompanying post-hoc between-group comparisons of the estimated marginal means from the simple model predicting Signal-to-Noise ratio of the baseline recording. Figure 7B presents the same results but for the model that also included gel-volume as a covariate. Across both figures the solid and dashed lines plot the estimated marginal means (with error bars representing the standard error) for hair groups 1 (green) and 2 (orange) respectively, while the violin plots plot the observed data. Underneath each plot are the tabulated type 3 omnibus test results for the respective model that predicted electrode specific Signal-to-Noise ratio of the baseline recording. C = Central; df = Degrees of freedom; F = Frontal; O = Occipital; P = Parietal; z = Midline p < 0.1, * p < 0.05, ** p < 0.01
Figure 8 –
Figure 8 –. Comparison of ERP amplitude values between self-categorized hair groups across the P7, P8, and Pz electrodes.
Note: Figure 8A presents the observed ERP amplitude values from the task recording computed for P7, P8, and Pz electrode locations, and the accompanying post-hoc between-group comparisons of the estimated marginal means from the simple model predicting ERP amplitude. Figure 8B presents the same results but for the model that also included gel-volume as a covariate. Across both figures the solid and dashed lines plot the estimated marginal means (with error bars representing the standard error) for hair groups 1 (green) and 2 (orange) respectively, while the violin plots plot the observed data. Underneath each plot are the tabulated type 3 omnibus test results for the respective model that predicted electrode specific ERP amplitude. df = Degrees of freedom; P = Parietal; z = Midline p < 0.1; * p < 0.05, **p < 0.01
Figure 9 –
Figure 9 –. Comparison of ERP Standardized Measurement Error (SME) values between self-categorized hair groups across the P7, P8, and Pz electrodes.
Note: Figure 9A presents the observed Standardized Measurement Error (SME) values that correspond to the P1, and P3 ERP components computed at P7, P8, and Pz electrode locations, and the accompanying post-hoc between-group comparisons of the estimated marginal means from the simple model predicting ERP amplitude. Figure 9B presents the same results but for the model that also included gel-volume as a covariate. Across both figures the solid and dashed lines plot the estimated marginal means (with error bars representing the standard error) for hair groups 1 (green) and 2 (orange) respectively, while the violin plots plot the observed data. Underneath each plot are the tabulated type 3 omnibus test results for the respective model that predicted electrode specific SME. df = Degrees of freedom; P = Parietal; z = Midline

References

    1. Bates D, Mächler M, Bolker B, & Walker S (2015). Fitting Linear Mixed-Effects Models Using lme4. Journal of Statistical Software, 67(1), 1–48. 10.18637/jss.v067.i01 - DOI
    1. Bernard BA (2003). Hair shape of curly hair. Journal of the American Academy of Dermatology, 48(6), S120–S126. 10.1067/mjd.2003.279 - DOI - PubMed
    1. Bradford DE, DeFalco A, Perkins ER, Carbajal I, Kwasa J, Goodman FR, … Joyner KJ (2022). Whose Signals Are Being Amplified? Toward a More Equitable Clinical Psychophysiology. Clinical Psychological Science, 216770262211121. 10.1177/21677026221112117 - DOI - PMC - PubMed
    1. Broyd SJ, Richards HJ, Helps SK, Chronaki G, Bamford S, & Sonuga-Barke EJS (2012). An electrophysiological monetary incentive delay (e-MID) task: A way to decompose the different components of neural response to positive and negative monetary reinforcement. Journal of Neuroscience Methods, 209(1), 40–49. 10.1016/j.jneumeth.2012.05.015 - DOI - PubMed
    1. Choy T, Baker E, & Stavropoulos K (2022). Systemic Racism in EEG Research: Considerations and Potential Solutions. Affective Science, 3(1), 14–20. 10.1007/s42761-021-00050-0 - DOI - PMC - PubMed

LinkOut - more resources