. 2023 Dec 1;15(12):evad229.
doi: 10.1093/gbe/evad229.

Widespread Deviant Patterns of Heterozygosity in Whole-Genome Sequencing Due to Autopolyploidy, Repeated Elements, and Duplication

Affiliations

Widespread Deviant Patterns of Heterozygosity in Whole-Genome Sequencing Due to Autopolyploidy, Repeated Elements, and Duplication

Xavier Dallaire et al. Genome Biol Evol. .

Abstract

Most population genomic tools rely on accurate single nucleotide polymorphism (SNP) calling and filtering to meet their underlying assumptions. However, genomic complexity, resulting from structural variants, paralogous sequences, and repetitive elements, presents significant challenges in assembling contiguous reference genomes. Consequently, short-read resequencing studies can encounter mismapping issues, leading to SNPs that deviate from Mendelian expected patterns of heterozygosity and allelic ratio. In this study, we employed the ngsParalog software to identify such deviant SNPs in whole-genome sequencing (WGS) data with low (1.5×) to intermediate (4.8×) coverage for four species: Arctic Char (Salvelinus alpinus), Lake Whitefish (Coregonus clupeaformis), Atlantic Salmon (Salmo salar), and the American Eel (Anguilla rostrata). The analyses revealed that deviant SNPs accounted for 22% to 62% of all SNPs in salmonid datasets and approximately 11% in the American Eel dataset. These deviant SNPs were particularly concentrated within repetitive elements and genomic regions that had recently undergone rediploidization in salmonids. Additionally, narrow peaks of elevated coverage were ubiquitous along all four reference genomes, encompassed most deviant SNPs, and could be partially associated with transposons and tandem repeats. Including these deviant SNPs in genomic analyses led to highly distorted site frequency spectra, underestimated pairwise FST values, and overestimated nucleotide diversity. Considering the widespread occurrence of deviant SNPs arising from a variety of sources, their important impact in estimating population parameters, and the availability of effective tools to identify them, we propose that excluding deviant SNPs from WGS datasets is required to improve genomic inferences for a wide range of taxa and sequencing depths.

Keywords: autopolyploid; heterozygosity; paralog; repetitive DNA; salmonid; whole-genome sequencing.


Figures

Fig. 1.
Fig. 1.
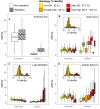
All investigated datasets harbor SNPs in deviation of Hardy–Weinberg equilibrium and allelic ratio. Summary of canonical (black) and deviant (red) SNPs as categorized by ngsParalog (P < 0.001) for 100,000 randomly selected SNPs in the American Eel, Arctic Char, Lake Whitefish (James Bay and Great Slave Lake), and Atlantic Salmon (1.5× and 4.8× coverage) datasets. A) Histograms of FIS with an inset pie chart showing the proportion of SNPs by category. B) HDplot showing the proportion of heterozygotes in relation to deviation in allelic ratio (Z-score). C) Proportion of heterozygotes in relation to mean allelic ratio in heterozygous samples with at least 4× coverage. D) Distribution of depth of coverage by SNP category. The y axis was restricted to depth under 10× for clarity, but deviant SNPs had maximum depths that greatly exceeded 10×.
Fig. 2.
Fig. 2.
Deviant SNPs are found in low- to intermediate-coverage datasets. Number of canonical (black, above) and deviant (red, below) SNPs as categorized by ngsParalog in the 4.8× Atlantic Salmon dataset. Deviant SNPs categorized as canonical in the subsampled datasets are represented by the hatched portion of bars, but canonical SNPs categorized as deviant were too rare to be visualized. SNPs absent from the 4.8× dataset (less than 1.5% of all SNPs) were not shown.
Fig. 3.
Fig. 3.
Deviant SNPs are more common in repetitive DNA and recently rediploidized regions. Density of canonical and deviant SNPs (by kb) in 1 Mb nonoverlapping windows for the A) American Eel, B) Arctic Char, C) James Bay Lake Whitefish, and D) 4.8× Atlantic Salmon datasets. SNPs are split based on whether they were found in repetitive regions identified by Repeat Masker (hatched) or not (plain boxplot). Windows are categorized based on their percentage of identity with their ohnolog, color-coded from yellow to dark red. For salmonid datasets, the inset histograms show the relative frequency of percentages of identity in windows. Only base pairs with an average depth above 0.75× were considered for the calculation of SNP densities.
Fig. 4.
Fig. 4.
Peaks of elevated coverage are enriched in both deviant SNPs and certain classes of repetitive DNA elements. A) Depth of coverage in 15 kb windows on the first chromosome of the American Eel, Arctic Char, Lake Whitefish, and Atlantic Salmon (from top to bottom; the first chromosome was arbitrarily selected and is shown here as a representative illustration of patterns observed over the entire genome). The position of canonical (black) and deviant (red) SNPs are marked as points according to their likelihood ratio of being in a mismapped region, according to ngsParalog. The extent of repetitive elements is indicated by colored rectangles at the bottom of the plots, the depth threshold delimiting peaks of coverage is shown by the light gray dashed line, and deviant regions composed of 150 bp windows centered on each deviant SNPs are shadowed in light red. B) Proportion of sequence covered of the most frequent clades of transposable elements and other repeat types in the sufficiently covered portion of the genome (left) compared to peaks of elevated coverage between 20 and 1,000 bp (right).
Fig. 5.
Fig. 5.
Population genetic differentiation is underestimated when deviant SNPs are not removed from the dataset. A) Relationship between pairwise Fst estimated between populations using all SNPs in the Arctic Char dataset and only SNPs categorized as canonical by ngsParalog. Three pairs of populations are highlighted in yellow, corresponding to population 1 (low Fst), 2 (medium Fst), and 3 (high Fst) paired with a fourth common population. Unfolded two-dimensional site frequency spectra (2dSFS) are shown for these pairs using B) all SNPs and C) only canonical SNPs. One-dimensional site frequency spectra (1dSFS) for the four highlighted populations are shown along the axes of the 2dSFS. For better visualization, SNPs fixed for either allele were hidden from the 1dSFS.
Fig. 6.
Fig. 6.
Failure to remove deviant SNPs leads to overestimation of genetic diversity in datasets with various deviant SNP densities. Distribution of A) Waterson's estimator (ϴW), B) nucleotide diversity (ϴπ), and C) Tajima's D in windows of 100 Mb (window step of 20 kb) for four populations (n = 30 individuals) of Arctic Char and a random sample of 30 individuals in the panmictic population of American Eel. Diversity estimation was performed before (red) and after (gray) masking a region of 150 bp centered on each deviant SNP.

References

    1. Andolfatto P. Hitchhiking effects of recurrent beneficial amino acid substitutions in the Drosophila melanogaster genome. Genome Res. 2007:17(12):1755–1762. 10.1101/gr.6691007. - DOI - PMC - PubMed
    1. Andrews KR, Good JM, Miller MR, Luikart G, Hohenlohe PA. Harnessing the power of RADseq for ecological and evolutionary genomics. Nat Rev Genet. 2016:17(2):81–92. 10.1038/nrg.2015.28. - DOI - PMC - PubMed
    1. Bao W, Kojima KK, Kohany O. Repbase update, a database of repetitive elements in eukaryotic genomes. Mob DNA. 2015:6(1):11. 10.1186/s13100-015-0041-9. - DOI - PMC - PubMed
    1. Begun DJ, Holloway AK, Stevens K, Hillier LDW, Poh YP, Hahn MW, Nista PM, Jones CD, Kern AD, Dewey CN, et al. Population genomics: whole-genome analysis of polymorphism and divergence in Drosophila simulans. PLoS Biol. 2007:5(11):e310. 10.1371/journal.pbio.0050310. - DOI - PMC - PubMed
    1. Benjamin A, Sağlam İK, Mahardja B, Hobbs J, Hung TC, Finger AJ. Use of single nucleotide polymorphisms identifies backcrossing and species misidentifications among three San Francisco estuary osmerids. Conserv Genet. 2018:19(3):701–712. 10.1007/s10592-018-1048-9. - DOI

Publication types