. 2024 Jan;68(2):e2300533.
doi: 10.1002/mnfr.202300533. Epub 2023 Dec 12.

Prenatal Human Milk Oligosaccharides (HMOs) in the Context of BMI, Gestational Weight Gain, and Lipid Profile-An Association Study in Pregnant Women with Overweight or Obesity

Affiliations

Prenatal Human Milk Oligosaccharides (HMOs) in the Context of BMI, Gestational Weight Gain, and Lipid Profile-An Association Study in Pregnant Women with Overweight or Obesity

Lukas Schönbacher et al. Mol Nutr Food Res. 2024 Jan.

Abstract

Background: Human milk oligosaccharides (HMOs) are bioactive glycans first detected in human milk. Their presence in maternal blood during pregnancy suggests systemic functions. Dynamics and associations of the most abundant prenatal HMOs in relation to maternal BMI and serum lipids in a cohort of 87 pregnant women with either overweight or obesity are studied.

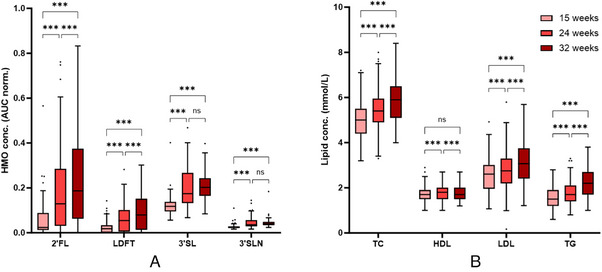
Methods: Serum HMOs (2'FL, 3'SL, 3'SLN, LDFT), serum lipids (total cholesterol, HDL, LDL, triglycerides), and BMI are measured at 15, 24, and 32 weeks of gestation.

Results: 2'FL and LDFT are negatively correlated to pre-pregnancy BMI and increase significantly slower between 15 and 24 weeks in highly obese women. Women without detectable increase of serum 2'FL (non-secretors) show a less pronounced gestational weight gain and lower BMI in the third trimester as compared to women phenotype as secretors. Higher early-pregnancy 2'FL is associated with high HDL and low triglycerides in pregnancy. On the other hand, higher 3'SL at 15 weeks is associated with higher triglycerides, LDL, and total cholesterol.

Conclusions: Higher early-pregnancy 2'FL is associated with a cardioprotective lipid profile, whereas higher 3'SL is associated with an atherogenic lipid profile. Serum trajectories of 2'FL and LDFT in obese women suggest an obesity mediated delay of α-1,2-fucosylation.

Keywords: 2’-Fucosyllactose (2’FL); FUT2; human milk oligosaccharides (HMOs); obesity; pregnancy.


Conflict of interest statement

The authors declare no conflict of interest.

Figures

Figure 1
Figure 1
Flowchart of recruitment and follow‐up of study participants.
Figure 2
Figure 2
Concentrations of serum HMOs (A) and lipids (B) over the course of pregnancy. Box‐and‐whisker‐plots (Tukey) show increasing concentrations of all four HMOs. Total cholesterol (TC), LDL, and triglycerides (TG) increase with each study visit, HDL shows highest concentrations at 24 weeks. (ns, not significant; *** p < 0.001).
Figure 3
Figure 3
Body weight and BMI over the course of pregnancy stratified by secretor status. Box‐and‐whisker‐plots show body weight (A) and BMI (B) separately for secretor positive and secretor negative women at different time points in pregnancy. There is a steady increase in weight and BMI in secretor positive women, but not in secretor negative women (ns, not significant; *p < 0.05; **** p < 0.0001).
Figure 4
Figure 4
Trajectories of HMO concentrations in maternal serum (AUC normalized to internal standard) over the course of pregnancy. Line graphs show concentrations (median and IQR) separately for pregnant women with overweight/obesity class I (BMI < 35 kg m 2, gray lines) and with obesity class II and above (BMI ≥ 35 kg m 2, red lines) for the fucosylated HMOs 2’FL (A) and LDFT (B) (includes data of secretor‐positive women; BMI < 35 kg m 2, n = 39; BMI ≥ 35 kg m−2, n = 33) and the sialylated HMOs 3’SL (C) and 3’SLN (D) (data of the whole study sample, BMI < 35 kg m 2, n = 49; BMI ≥ 35 kg m−2, n = 38). Repeated measures 2‐way ANOVA (mixed model) with Sidak's multiple comparison test showed difference in concentration trajectories between the BMI categories for 2’FL and LDFT. Concentrations of 2’FL were significantly lower in women with obesity class II and above at week 24 (p = 0.0061). Concentrations of LDFT were significantly lower in women with obesity class II and above at week 24 and 32 (p < 0.0003). There were no significant differences in concentrations of 3’SL and 3’SLN at each time points between BMI groups. ns, not significant; **p < 0.001; ***p < 0.0001; HMO, human milk oligosaccharide; LDFT, Lactodifucotetraose; 2′FL, 2′‐Fucosyllactose; 3′SL, 3′‐Sialyllactose; 3′SLN, 3′‐Sialyllactosamine.

References

    1. Urashima T., Asakuma S., Leo F., Fukuda K., Messer M., Oftedal O. T., Adv. Nutr. 2012, 3, 473S. - PMC - PubMed
    1. Urashima T., Hirabayashi J., Sato S., Kobata A., Trends Glycosci. Glycotechnol. 2018, 30, SE51.
    1. Marcobal A., Barboza M., Froehlich J. W., Block D. E., German J. B., Lebrilla C. B., Mills D. A., J. Agric. Food Chem. 2010, 58, 5334. - PMC - PubMed
    1. Sisk P. M., Lovelady C. A., Dillard R. G., Gruber K. J., O'Shea T. M., J. Perinatol. 2007, 27, 428. - PubMed
    1. Schanler R. J., Lau C., Hurst N. M., Smith E. O., Pediatrics 2005, 116, 400. - PubMed