. 2024 Jan 1;221(1):e20230063.
doi: 10.1084/jem.20230063. Epub 2023 Dec 12.

Commensal bacteria promote type I interferon signaling to maintain immune tolerance in mice

Affiliations

Commensal bacteria promote type I interferon signaling to maintain immune tolerance in mice

Adriana Vasquez Ayala et al. J Exp Med. .

Abstract

Type I interferons (IFNs) exert a broad range of biological effects important in coordinating immune responses, which have classically been studied in the context of pathogen clearance. Yet, whether immunomodulatory bacteria operate through IFN pathways to support intestinal immune tolerance remains elusive. Here, we reveal that the commensal bacterium, Bacteroides fragilis, utilizes canonical antiviral pathways to modulate intestinal dendritic cells (DCs) and regulatory T cell (Treg) responses. Specifically, IFN signaling is required for commensal-induced tolerance as IFNAR1-deficient DCs display blunted IL-10 and IL-27 production in response to B. fragilis. We further establish that IFN-driven IL-27 in DCs is critical in shaping the ensuing Foxp3+ Treg via IL-27Rα signaling. Consistent with these findings, single-cell RNA sequencing of gut Tregs demonstrated that colonization with B. fragilis promotes a distinct IFN gene signature in Foxp3+ Tregs during intestinal inflammation. Altogether, our findings demonstrate a critical role of commensal-mediated immune tolerance via tonic type I IFN signaling.


Conflict of interest statement

Disclosures: L.-F. Lu reported personal fees from Elixiron Immunotherapeutics and grants from Molecular Axiom outside the submitted work. No other disclosures were reported.

Figures

Figure 1.
Figure 1.
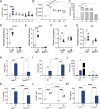
Commensal bacteria maintain intestinal type I IFN responses. (A and B) Expression of (A) Ifnb and (B) Mx1 in colon tissue from GF, B. fragilis–monocolonized (Bf), and SPF as measured by qRT-PCR relative to β-actin. Each point represents a single mouse. (C) GF and SPF colon explants were cultured with or without stimulation of poly I:C (pIC; 2 μg/ml) for 24 h. Supernatant was then collected and measured for IFNβ secretion by ELISA. Each point represents a single mouse. (D) cLP cells were isolated from GF and SPF mice and stimulated with IFNβ (25 ng/ml). pSTAT1 was assessed by flow cytometry. Each point represents colons pooled from multiple mice, with n = 10 per group. (E–H) GF, Bf, and SPF mice were injected (IP) with 100 µg/ml pIC, and colon tissues were harvested 4 h after injection. Gene expression for (E) Mx2, (F) Irf7, (G) Ifit1, and (H) Ifnb was measured. Each point represents a single mouse. Data are representative of at least two independent experiments. Statistical significance was determined by Kruskal-Wallis, unpaired t test, and two-way ANOVA. P < 0.05 (*), P < 0.01 (**), and P < 0.0001 (****).
Figure S1.
Figure S1.
Gut microbiota are required for the maintenance of type I IFN responses. (A) Colon tissue from GF, B. fragilis–monocolonized (Bf), or SPF mice were harvested and analyzed for expression of Ifnar1 by qRT-PCR relative to β-actin. (B) GF or SPF mice were injected (IP) with 100 µg/mouse poly I:C (pIC) and colon tissues were harvested after 4 h after injection. Gene expression for Ifnar1 was measured by qRT-PCR relative to β-actin. (C) SPF WT C57BL/6 mice were treated with an antibiotic cocktail consisting of ampicillin, metronidazole, neomycin, and vancomycin (ANMV) supplemented with glucose for 2–3 wk, and cLP lymphocytes were isolated and analyzed by flow cytometry to visualize proportions of cLP CD11c+ cells and pSTAT1 MFI among CD11c+ cells. (D) GF and SPF splenocytes were treated with 2 µg/ml pIC for 18 h. Supernatant was collected to measure cytokine and chemokine secretion by multiplex ELISA. (E–I) GF, Bf, and SPF mice were injected (IP) with 100 µg/mouse pIC and colon tissues were harvested after 4 h after injection. Gene expression relative to β-actin for (E) Mx1, (F) Irf3, (G) Oas1, (H) Isg15, and (I) Irf9 was measured. Each point represents a single mouse. Data are representative of two experiments. Statistical significance was determined by two-way ANOVA. P < 0.05 (*), P < 0.01 (**), P < 0.001 (***), and P < 0.0001 (****).
Figure 2.
Figure 2.
Select commensal bacteria induce IFN signaling to promote tolerogenic responses in DCs. (A) BMDCs from SPF mice were treated with B. fragilis (Bf), B. thetaiotaomicron (Bt), B. vulgatus (Bv), L. plantarum (Lp), A. caccae (Ac), B. producta (Bp), and C. ramosum (Cr) for 18 h. Supernatant was collected and IFNβ production was measured by ELISA. (B–D) BMDCs were treated with Bf for 18 h and expression of (B) Ifnb, (C) Ifna, and (D) Ifng were measured relative to β-actin by qRT-PCR. (E and F) WT and Ifnar1−/− BMDCs were pulsed with Bf for 18 h. Cells were harvested and analyzed by qRT-PCR for gene expression of (E) IFNβ and stained for (F) flow cytometry analysis of pSTAT1 in CD11c+ DCs. (G and H) Splenocytes from IFNβ-YFP reporter mice were treated with Bf ex vivo for 18 h and mean fluorescent intensity (MFI) of IFNβ-YFP was assessed in (G) plasmacytoid dendritic cells (pDCs) and (H) conventional dendritic cells (cDCs) by flow cytometry. (I) cLP cells were isolated and enriched for CD11c+ cells from GF and Bf-monocolonized mice and cultured for 18 h. Supernatant was collected and IFNβ production was measured by ELISA. Each point represents colons pooled from five mice per point and represents n = 30 for each group. (J–O) WT and IFNAR-deficient BMDCs were pulsed with Bf for 18 h. Cells were harvested and analyzed by qRT-PCR for gene expression of (J) Il10, (L) Il27p28, and (N) Il1b relative to β-actin. Supernatant from BMDC cultures was collected and cytokine secretion was measured for (K) IL-10, (M) IL-27p28, and (O) IL-1β by ELISA. Data are representative of at least two independent experiments. Statistical analysis was determined by unpaired t test and two-way ANOVA. P < 0.05 (*), P < 0.01 (**), P < 0.001 (***), and P < 0.0001 (****).
Figure S2.
Figure S2.
DC-signaling pathways mediate tonic type I IFN and tolerogenic cytokine responses. (A) BMDCs from WT SPF mice were treated with B. fragilis (Bf), B. thetaiotaomicron (Bt), B. vulgatus (Bv), L. plantarum (Lp), A. caccae (Ac), B. producta (Bp), and C. ramosum (Cr) for 18 h. Cells were stained and pSTAT1 among CD11c+ DCs were analyzed by flow cytometry. (B–C) BMDCs from WT SPF mice were treated with E. coli (Ec), S. enterica serovar Typhimurium (STm), Group B Streptococcus (GBS), and L. monocytogenes (Lm) for 18 h and (B) cells were stained and pSTAT1 among CD11c+ DCs was analyzed by flow cytometry and (C) supernatant was collected and measured for IFNβ by ELISA. (D–G) WT and IFNAR1-deficient BMDCs were pulsed with Bf for 18 h. Cells were harvested and analyzed by qRT-PCR for expression of (D) Oas1, (E) Mx2, (F) Irf3, and (G) Irf9. (H) BMDCs from Nod2fl/fl and Nod2∆CD11c mice were treated with Bf or 100 ng/ml of muramyl dipeptide for 18 h, and supernatants from BMDC cultures were collected and IFNβ secretion was measured by ELISA. (I) BMDCs from WT and Tlr2−/− mice were treated with Bf or 100 ng/ml of Pam3CSK4 (PAM) for 18 h, and supernatants from BMDC cultures were collected and IFNβ secretion was measured by ELISA. (J) BMDCs from WT and Tlr4−/− mice were treated with Bf or 100 ng/ml of LPS for 18 h, and supernatants from BMDC cultures were collected and IFNβ secretion was measured by ELISA. (K–M) BMDCs from Il27fl/fl and Il27∆CD11c mice were treated with Bf for 18 h. (K) Supernatants from BMDC cultures were collected and IL-10 secretion was measured by ELISA. (L) Cells were stained for pSTAT1 and analyzed by flow cytometry. (M) Supernatants from BMDC cultures were collected and IFNβ secretion was measured by ELISA. Data are representative of two experiments. Statistical analysis was determined by unpaired t test and two-way ANOVA. P < 0.05 (*), P < 0.01 (**), P < 0.001 (***), and P < 0.0001 (****).
Figure S3.
Figure S3.
IFNAR signaling in DCs is required for B. fragilis–induced immune responses. WT and IFNAR1-deficient BMDCs were pulsed with B. fragilis for 18 h. (A, C, and D) Cells were harvested and analyzed by qRT-PCR for expression of (A) Ifng, (C) Il6, and (D) Tnfa relative to β-actin. (B and E–H) Supernatant from BMDC cultures were collected and protein secretion was measured for (B) IFNγ, (E) TNF-α, (F) RANTES, (G) CXCL1, and (H) IP-10 by ELISA. Data are representative of two experiments. Statistical significance was determined by two-way ANOVA. P < 0.01 (**), P < 0.001 (***), and P < 0.0001 (****).
Figure 3.
Figure 3.
Type I IFN signaling in DCs is required to promote Treg responses. WT and Ifnar1−/− BMDCs were untreated (−) or treated with B. fragilis (Bf) cocultured with WT CD4+ T cells. (A and B) Cells were treated with 10 µg/ml of IFNα/β neutralizing antibodies or isotype control (IgG2a) every 24 h and then stained and analyzed by flow cytometry for (A) Foxp3+ Tregs and (B) IL-10–producing Foxp3+ Tregs. (C and D) WT and Ifnar1−/− BMDCs were untreated (−) or treated with Bf cocultured with Il27rafl/fl or Il27ra∆Foxp3 CD4+ T cells. Cells were stained and analyzed by flow cytometry for IL-10–producing Foxp3+ Tregs. (C) Representative plots are shown and (D) proportions of IL-10–producing Foxp3+ Tregs are quantified. Data are representative of at least two independent experiments. Statistical significance was determined by two-way ANOVA. P < 0.05 (*), P < 0.01 (**), and P < 0.0001 (****).
Figure S4.
Figure S4.
Type I IFN signaling facilitates commensal-induced Treg responses. (A) WT BMDCs were untreated (−) or treated with IL-27 (50 ng/ml) cocultured with WT T cells and then stained and analyzed by flow cytometry for IL-10 production among Foxp3+ Tregs. (B) WT BMDCs were cocultured with WT T-cells with or without B. fragilis (Bf), B. thetaiotaomicron (Bt), B. vulgatus (Bv), L. plantarum (Lp), A. caccae (Ac), B. producta (Bp), and C. ramosum (Cr) treatment for 72 h. Cells were then stained to visualize IL-10+ Foxp3+ Tregs by flow cytometry. (C) WT BMDCs were pulsed with Bf, Bt, Bv, Lp, Ac, Bp, and Cr for 18 h. Supernatant was collected and measured for IL-27 production by ELISA. (D) WT and IFNAR1-deficient BMDCs were untreated (−) or treated with Bf cocultured with Il27rafl/fl or Il27ra∆Foxp3 CD4+ T cells. Supernatant was collected and measured for IL-27 by ELISA. (E–G) SPF WT C57BL/6 mice were treated with an antibiotic cocktail consisting of ampicillin, metronidazole, neomycin, and vancomycin (ANMV) supplemented with glucose for 2–3 wk, and cLP lymphocytes were isolated and analyzed by flow cytometry to visualize proportions of (E) Foxp3+ among CD4+ T cells and pSTAT1 MFI among Foxp3+ CD4+ T-cells, (F) IL-10+ among Foxp3+ CD4+ T cells, and (G) IL-10+ among cLP CD11c+ cells. Each point represents a single mouse. (H and I) Ifnar1fl/f, Ifnar1∆CD11c, and Ifnar1∆Foxp3 mice were gavaged with either PBS or Bf for 2 wk and proportions of (H) CD4+ Foxp3+ RORgt+ Tregs and (I) RORgt+ IL-17A+ cells were assessed by flow cytometry. (J) 4–6-wk-old female GF Foxp3hCD2/IL-10Venus mice were orally gavaged with a single dose of Bf (108 CFU resuspended in sterile PBS). 2 wk later mice were subjected to 5% DNBS colitis or EtOH control for 3 d, and colon length and change in weight percentage were recorded. Data are representative of at least two independent experiments. Statistical analysis was determined by unpaired t test and two-way ANOVA. P < 0.05 (*), P < 0.01 (**), P < 0.001 (***), and P < 0.0001 (****).
Figure 4.
Figure 4.
Bacterial colonization induces type I IFN signature in intestinal Tregs. (A–C) WT and Ifnar1−/− SPF mice were orally gavaged with either sterile PBS or live B. fragilis (Bf; 2 × 10⁸ CFUs) for 2 wk and proportions of (A) CD4+ Foxp3+ Tregs, (B) CD4+ Foxp3+ IL10+ Tregs, and (C) CD4+ Foxp3 IL17A+ T cells in cLP were assessed by flow cytometry. (D and E) Ifnar1fl/fl, Ifnar1∆Foxp3, and Ifnar1∆CD11c SPF mice were orally gavaged with either sterile PBS or live Bf (2 × 10⁸ CFUs) for 2 wk and proportions of (D) CD4+ Foxp3+ Tregs and (E) Foxp3+ IL-10+ Tregs were assessed by flow cytometry. (F–M) 4–6-wk-old female GF Foxp3hCD2/IL-10Venus mice were orally gavaged with a single dose of Bf (108 CFUs). 2 wk later, mice were subjected to 5% DNBS colitis for 3 d and MLNs were harvested, and single suspensions were prepared. CD4+hCD2+ cells were enriched and subjected to single-cell RNA sequence analysis. (F) UMAP projection of Tregs from MLNs from GF and Bf mice showing six clusters of Treg subpopulations: ISG Treg, central Treg (cTreg), Treg, naive Treg, effector Treg (eTreg), and ICOS Treg. Each dot corresponds to a single cell, colored according to cell type. Inset, bar plot of the proportions of each Treg subpopulation in GF and Bf MLNs. (G) GO enrichment analysis of ISG Tregs in Bf mice relative to GF controls. Gene expression of (H) Stat1, (I) Stat2, (J) Irf7, (K) Irf9, and (L) Isg15 in ISG Tregs of GF and Bf mice. (M) Heatmap showing the top 100 differentially expressed genes in the six Treg subpopulations in GF and Bf MLNs. The dendrogram is based on a hierarchical cluster analysis of Euclidean distances. Each point represents a single mouse. Statistical significance was determined by two-way ANOVA. P < 0.05 (*), P < 0.01 (**), and P < 0.0001 (****).
Figure S5.
Figure S5.
Colonization with B. fragilis promotes intestinal ISG Treg responses. 4–6-wk-old female GF Foxp3hCD2/IL-10Venus mice were orally gavaged with a single dose of B. fragilis (Bf; 108 CFU resuspended in sterile PBS). 2 wk later, mice were subjected to 5% DNBS colitis for 3 d and MLNs were harvested, and single suspensions were prepared. CD4+hCD2+ cells were enriched and subjected to single-cell RNA sequence analysis. (A) UMAP projection of genes used as markers to differentiate subpopulations of Tregs. (B) Gene expression of Irf9, Oas1a, Irf7, Oasl1, Ifit3, Socs1, Stat1, Isg15, Stat2, and Usp18 in six clusters of Treg subpopulations: ISG Treg, cTreg, Treg, naive Treg eTreg, and ICOS Treg of GF and Bf mice. (C) UMAP projection of single cells colored by GF and Bf populations. (D) WT BMDCs were untreated (−) or treated with Bf cocultured with Il27rafl/fl or Il27ra∆Foxp3 CD4+ T cells. Cells were stained and analyzed by flow cytometry for ISG15-producing Foxp3+ Tregs. (E) KEGG pathway enrichment of ICOS Tregs. (F) UMAP of Treg subpopulations from MLNs of GF and Bf mice during steady-state. (G and H) MLN CD4+ T cells were isolated from GF and Bf-monocolonized mice. Relative expression of (G) Isg15 and (H) Stat1 relative to β-actin was evaluated by qRT-PCR. Each point represents a single mouse. Data are representative of at least two independent experiments. Statistical analysis was determined by unpaired t test and two-way ANOVA. P < 0.05 (*), P < 0.001 (***), and P < 0.0001 (****).

References

    1. Abt, M.C., Osborne L.C., Monticelli L.A., Doering T.A., Alenghat T., Sonnenberg G.F., Paley M.A., Antenus M., Williams K.L., Erikson J., et al. . 2012. Commensal bacteria calibrate the activation threshold of innate antiviral immunity. Immunity. 37:158–170. 10.1016/j.immuni.2012.04.011 - DOI - PMC - PubMed
    1. Aman, M.J., Tretter T., Eisenbeis I., Bug G., Decker T., Aulitzky W.E., Tilg H., Huber C., and Peschel C.. 1996. Interferon-α stimulates production of interleukin-10 in activated CD4+ T cells and monocytes. Blood. 87:4731–4736. 10.1182/blood.V87.11.4731.bloodjournal87114731 - DOI - PubMed
    1. Amsden, H., Kourko O., Roth M., and Gee K.. 2022. Antiviral activities of interleukin-27: A partner for interferons? Front. Immunol. 13:902853. 10.3389/fimmu.2022.902853 - DOI - PMC - PubMed
    1. Atarashi, K., Tanoue T., Oshima K., Suda W., Nagano Y., Nishikawa H., Fukuda S., Saito T., Narushima S., Hase K., et al. . 2013. Treg induction by a rationally selected mixture of Clostridia strains from the human microbiota. Nature. 500:232–236. 10.1038/nature12331 - DOI - PubMed
    1. Awasthi, A., Carrier Y., Peron J.P.S., Bettelli E., Kamanaka M., Flavell R.A., Kuchroo V.K., Oukka M., and Weiner H.L.. 2007. A dominant function for interleukin 27 in generating interleukin 10-producing anti-inflammatory T cells. Nat. Immunol. 8:1380–1389. 10.1038/ni1541 - DOI - PubMed