. 2023 Dec 12;134(3):e173034.
doi: 10.1172/JCI173034.

Itaconate suppresses atherosclerosis by activating a Nrf2-dependent antiinflammatory response in macrophages in mice

Affiliations

Itaconate suppresses atherosclerosis by activating a Nrf2-dependent antiinflammatory response in macrophages in mice

Jianrui Song et al. J Clin Invest. .

Abstract

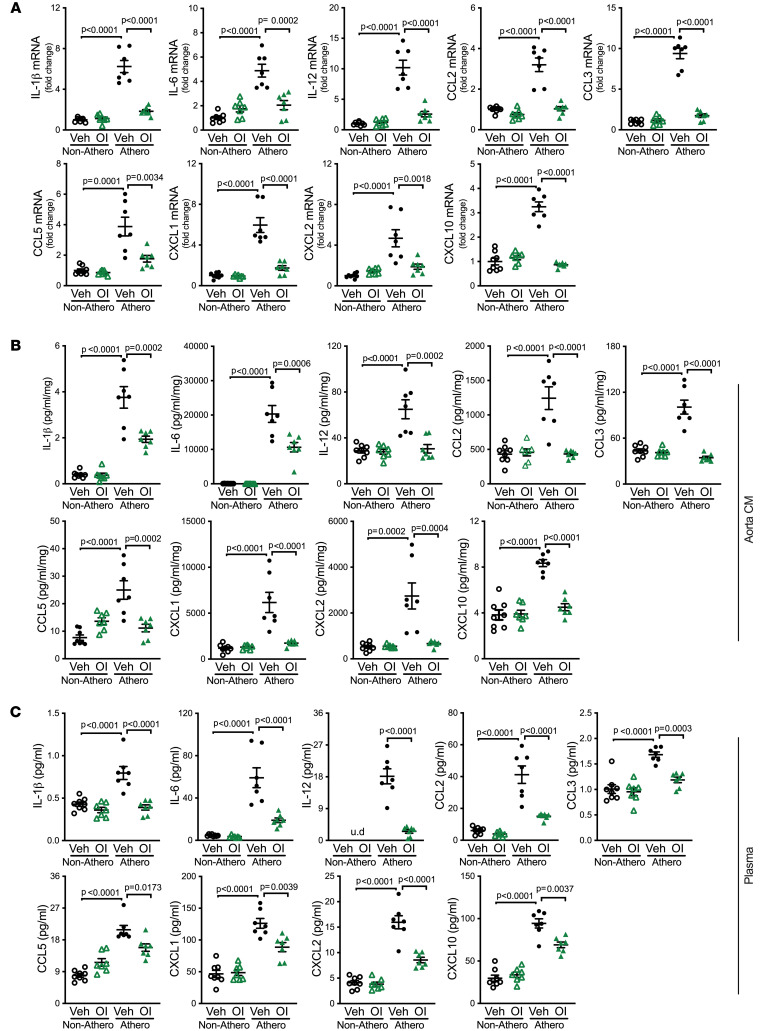
Itaconate has emerged as a critical immunoregulatory metabolite. Here, we examined the therapeutic potential of itaconate in atherosclerosis. We found that both itaconate and the enzyme that synthesizes it, aconitate decarboxylase 1 (Acod1, also known as immune-responsive gene 1 [IRG1]), are upregulated during atherogenesis in mice. Deletion of Acod1 in myeloid cells exacerbated inflammation and atherosclerosis in vivo and resulted in an elevated frequency of a specific subset of M1-polarized proinflammatory macrophages in the atherosclerotic aorta. Importantly, Acod1 levels were inversely correlated with clinical occlusion in atherosclerotic human aorta specimens. Treating mice with the itaconate derivative 4-octyl itaconate attenuated inflammation and atherosclerosis induced by high cholesterol. Mechanistically, we found that the antioxidant transcription factor, nuclear factor erythroid 2-related factor 2 (Nrf2), was required for itaconate to suppress macrophage activation induced by oxidized lipids in vitro and to decrease atherosclerotic lesion areas in vivo. Overall, our work shows that itaconate suppresses atherogenesis by inducing Nrf2-dependent inhibition of proinflammatory responses in macrophages. Activation of the itaconate pathway may represent an important approach to treat atherosclerosis.

Keywords: Atherosclerosis; Cardiology; Cardiovascular disease; Inflammation; Macrophages.


Figures

Figure 1
Figure 1. Acod1 expression and Itaconate production increase in atherosclerotic aorta.
Atherosclerosis was induced by intraperitoneally injecting mice with PCSK9-AAV and feeding a Western diet (WD) for 10 weeks. (A) Acod1 mRNA levels in control (Con, n = 8) and atherosclerotic (Athero, n = 7) aortas were measured by qRT-PCR. (B) Aorta lysates from Con and Athero mice were separated by gel electrophoresis and proteins were detected by Western blotting with the indicated antibodies. The quantification of Acod1 (n = 9/group) after normalization to GAPDH is shown on the right. (C) Relative abundance of TCA cycle metabolites (itaconate, isocitrate, α-ketoglutarate, succinate, malate, pyruvate, citrate, and cis-aconitate) was measured by metabolomics in nonatherosclerotic control (n = 12) and atherosclerotic (n = 7) aortas. a.u., arbitrary units based on MS peak area. The absolute concentrations of itaconate in aortas were also measured. (D) Representative images of anti-Acod1–stained human atherosclerotic coronary artery. Correlation between the percentage Acod1-positive area and clinical occlusion using 2-sided Pearson’s correlation analysis is shown on the right (n = 22). In AC, results are presented as mean ± SEM, and unpaired, 2-tailed Student’s t test was used for statistical analysis.
Figure 2
Figure 2. Acod1 deficiency promotes atherosclerosis by enhancing inflammation.
WT and Acod1–/– mice were induced to become atherosclerotic via PCSK9-AAV administration followed by 10-week Western diet. (A and B) Representative images of H&E-stained (A) aortic root and (B) brachiocephalic artery (BCA) sections of WT and Acod1–/– mice. Arrows indicate atherosclerotic lesions and arrowheads indicate necrotic cores. (C) The quantifications of lesion area and necrotic area in each section of aortic root (n = 23–24/group) and BCA (n = 10/group) are shown. (DF) The quantification of Mac2-positive area in each section of aortic root (n = 13/group) and BCA (n = 10/group) of atherosclerotic WT and Acod1–/– mice is shown (D), with representative images of anti-Mac2–stained (E) aortic root and (F) BCA sections. (G and H) The inflammatory cytokines and chemokines’ (G) gene expression in atherosclerotic aorta and (H) protein levels in tissue culture medium of atherosclerotic aortas from WT and Acod1–/– mice, including IL-1β, IL-6, IL-12, CCL2, CCL3, CCL5, CXCL1, CXCL2, and CXCL10, were measured by qRT-PCR (n = 7/group) and multiplex assay (n = 8–9/group), respectively. Results are presented as mean ± SEM. Two-way ANOVA followed by Tukey’s post hoc test was used in C and D and unpaired, 2-tailed Student’s t test was used in G and H for statistical analysis. Scale bars: 200 μm (A and E) and 50 μm (B and F).
Figure 3
Figure 3. Single-cell analysis of macrophages within the atherosclerotic aorta of WT and Acod1–/– mice.
WT and Acod1–/– mice were induced to become atherosclerotic via PCSK9-AAV administration followed by 10-week Western diet. (A) UMAP plot showing 8 different macrophage subpopulations revealed by scRNA-seq. (B) The expression of representative signature genes from each macrophage subpopulation was overlaid on the UMAP plot. Color intensity indicates normalized expression levels as shown for each gene. (C) The expression of M1-like and M2-like marker genes in each macrophage subpopulation was determined. The size of the dots indicates the percentage of cells expressing the gene of interest, while the intensity of the color indicates expression levels. (D) UMAP plots of macrophages from atherosclerotic WT and Acod1–/– aortas. Clusters are colored as in A. (E) The proportion of macrophage subpopulations from atherosclerotic WT and Acod1–/– aortas. (F) Differential abundance testing of changes in the proportion of macrophage subpopulations in atherosclerotic Acod1–/– aortas. Clusters that passed the threshold of adjusted P values < 0.05 and log2FC > 1.2 were deemed significant and colored. FC, fold change. (G) Volcano plot showing differentially expressed genes in macrophages from atherosclerotic Acod1–/– aortas. Up- and downregulated genes are colored orange and green, respectively. FDR, false discovery rate. (H) Violin plots showing the expression of 2 representative genes, Ccl3 and Irf7, that were differentially expressed between WT and Acod1–/– across all macrophage subpopulations. (I and J) Gene ontology analysis of (I) up- and (J) downregulated genes in macrophages from atherosclerotic Acod1–/– aortas.
Figure 4
Figure 4. Acod1 deficiency in myeloid cells confers increased atherogenesis and macrophage infiltration.
Acod1fl/fl and Acod1fl/fl LysMcre mice were induced to become atherosclerotic via PCSK9-AAV administration followed by 10-week Western diet. (A and B) Representative images of H&E-stained (A) aortic root and (B) brachiocephalic artery (BCA) sections of atherosclerotic Acod1fl/fl and Acod1fl/fl LysMcre mice. Arrows indicate atherosclerotic lesions and arrowheads indicate necrotic cores. (C) The quantifications of lesion area and necrotic area in each section of aortic root (n = 17–20/group) and BCA (n = 17–19/group) are shown. (DF) The quantification of Mac2-positive area in each section of aortic root (n = 9/group) and BCA (n = 11–13/group) of atherosclerotic Acod1fl/fl and Acod1fl/fl LysMcre mice is shown (D), along with representative images of anti-Mac2–stained (E) aortic root and (F) BCA sections. Results are shown as mean ± SEM. Two-way ANOVA followed by Tukey’s post hoc test was used for statistical analysis. P values indicate the main effect of the comparison. Scale bars: 200 μm (A and E) and 50 μm (B and F).
Figure 5
Figure 5. Itaconate derivative 4-octyl itaconate inhibits atherogenesis.
(A) Representative images of H&E-stained aortic root and brachiocephalic artery (BCA) sections of mice with indicated treatment. Vehicle, vehicle control; OI, 4-octyl itaconate; Athero+Vehicle, atherosclerosis and vehicle; Athero+OI, atherosclerosis and 4-octyl itaconate. Arrows indicate atherosclerotic lesions and arrowheads indicate necrotic cores. (B and C) The quantifications of lesion area and necrotic area (B) as well as Mac2-positive area (C) in each section of aortic root and BCA from indicated mice are shown (n = 7–8/group). (D) Representative images of anti-Mac2–stained aortic root and BCA sections of mice with indicated treatment. Results are shown as mean ± SEM. Two-way ANOVA followed by Tukey’s post hoc test was used for statistical analysis. P values indicate the main effect of the comparison between Athero+Vehicle vs. Athero+OI. Scale bars: 200 μm (top row in A and D) and 50 μm (bottom row in A and D).
Figure 6
Figure 6. 4-Octyl itaconate attenuates inflammation caused by atherosclerosis.
WT mice were subjected to the following treatments: 4-octyl itaconate (OI) only, atherosclerosis (Athero) only, and OI plus Athero. Vehicle was used as the control for OI, and mice without atherosclerosis (Non-Athero) were used as control mice. (A) Gene expression of inflammatory cytokines and chemokines, including IL-1β, IL-6, IL-12, CCL2, CCL3, CCL5, CXCL1, CXCL2, and CXCL10, in aortas of indicated mice were measured by qRT-PCR (n = 7–8/group). (B and C) The protein levels of inflammatory cytokines and chemokines, including IL-1β, IL-6, IL-12, CCL2, CCL3, CCL5, CXCL1, CXCL2, and CXCL10 in (B) tissue culture medium (CM) of aortas or (C) plasma of indicated mice were determined by multiplex assay (n = 7–8/group). u.d., undetectable. Protein levels in aorta CM were normalized to tissue weight for analysis. Results are presented as mean ± SEM. Two-way ANOVA followed by Tukey’s post hoc test was used for statistical analysis.
Figure 7
Figure 7. Nrf2 signaling is importantly involved in suppressing atherogenesis and inflammation mediated by itaconate.
(A) Whole-cell lysates were extracted from aortas of mice with or without atherosclerosis, and the protein level of Nrf2 was determined by Western blotting. The quantification is shown on the right (n = 10/group). (B) Aorta lysates from WT and Acod1–/– mice with or without atherosclerosis were extracted, and Nrf2 protein level was determined by Western blotting. The quantifications of Nrf2 (n = 8/group) that were normalized to GAPDH are shown on the right. (C) Aorta lysates from WT mice (with or without atherosclerosis) that were subjected to 4-octyl itaconate (OI) administration or vehicle control (Veh) were immunoblotted against Nrf2. Quantification is shown on the right (n = 5/group). GAPDH was used as loading control in AC. Con, control; Athero, atherosclerosis. (D) Representative images of anti-Nrf2–stained human atherosclerotic coronary artery. Scale bar: 200 μm. Correlation between the percentage Nrf2-positive area and clinical occlusion using 2-sided Pearson’s correlation analysis is shown on the right (n = 22). (E and F) Bone marrow–derived macrophages (BMDMs) from WT and Nrf2–/– mice were treated with or without OI (250 μM), followed by exposure to oxLDL (100 μg/mL). Vehicle was used as control. Cells and culture medium supernatant were collected at the end of experiment, and RNA was extracted from the cells. The inflammatory cytokines’ and chemokines’ (E) gene expression in those BMDMs and (F) protein levels in the culture media, including IL-1β, IL-6, IL-12, CCL2, CCL3, CCL5, CXCL1, CXCL2, and CXCL10, were measured by qRT-PCR and multiplex assay, respectively (n = 6/group). u.d., undetectable. Results are presented as mean ± SEM. Unpaired, 2-tailed Student’s t test was used in A and 2-way ANOVA followed by Tukey’s post hoc test was used in B, C, E, and F for statistical analysis.

References

    1. Strelko CL, et al. Itaconic acid is a mammalian metabolite induced during macrophage activation. J Am Chem Soc. 2011;133(41):16386–16389. doi: 10.1021/ja2070889. - DOI - PMC - PubMed
    1. Michelucci A, et al. Immune-responsive gene 1 protein links metabolism to immunity by catalyzing itaconic acid production. Proc Natl Acad Sci U S A. 2013;110(19):7820–7825. doi: 10.1073/pnas.1218599110. - DOI - PMC - PubMed
    1. Bambouskova M, et al. Electrophilic properties of itaconate and derivatives regulate the IκBζ-ATF3 inflammatory axis. Nature. 2018;556(7702):501–504. doi: 10.1038/s41586-018-0052-z. - DOI - PMC - PubMed
    1. Lampropoulou V, et al. Itaconate links inhibition of succinate dehydrogenase with macrophage metabolic remodeling and regulation of inflammation. Cell Metab. 2016;24(1):158–166. doi: 10.1016/j.cmet.2016.06.004. - DOI - PMC - PubMed
    1. Cordes T, et al. Itaconate modulates tricarboxylic acid and redox metabolism to mitigate reperfusion injury. Mol Metab. 2020;32:122–135. doi: 10.1016/j.molmet.2019.11.019. - DOI - PMC - PubMed

Publication types